Sustainable transport
| A subtopic of sustainability |
| Sustainable transport |
|---|
 |
| Also relevant to: |
| Aspects of sustainable transport: |
| Sustainable transport toolbox |
|
|
Sustainable transport refers to the broad subject of transport that is sustainable in the senses of social, environmental and climate impacts and the ability to, in the global scope, supply the source energy indefinitely. Components for evaluating sustainability include the particular vehicles used for road, water or air transport; the source of energy; and the infrastructure used to accommodate the transport (roads, railways, airways, waterways, canals and terminals). Transport operations and logistics as well as transit-oriented development are also involved in evaluation. Transportation sustainability is largely being measured by transportation system effectiveness and efficiency as well as the environmental and climate impacts of the system.[1]
Short-term activity often promotes incremental improvement in fuel efficiency and vehicle emissions controls while long-term goals include migrating transportation from fossil-based energy to other alternatives such as renewable energy and use of other renewable resources. The entire life cycle of transport systems is subject to sustainability measurement and optimization.[2]
Sustainable transport systems make a positive contribution to the environmental, social and economic sustainability of the communities they serve. Transport systems exist to provide social and economic connections, and people quickly take up the opportunities offered by increased mobility,[3] with poor households benefiting greatly from low carbon transport options.[4] The advantages of increased mobility need to be weighed against the environmental, social and economic costs that transport systems pose.
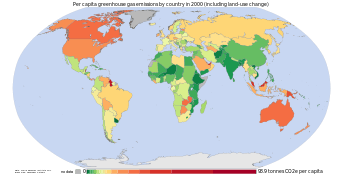
Transport systems have significant impacts on the environment, accounting for between 20% and 25% of world energy consumption and carbon dioxide emissions.[5] The majority of the emissions, almost 97%, came from direct burning of fossil fuels.[6] Greenhouse gas emissions from transport are increasing at a faster rate than any other energy using sector.[7] Road transport is also a major contributor to local air pollution and smog.[8]
The United Nations Environment Programme (UNEP) estimates that each year 2.4 million premature deaths from outdoor air pollution could be avoided.[9] Particularly hazardous for health are emissions of black carbon, a component of particulate matter, which is a known cause of respiratory and carcinogenic diseases and a significant contributor to global climate change.[10] The links between greenhouse gas emissions and particulate matter make low carbon transport an increasingly sustainable investment at local level—both by reducing emission levels and thus mitigating climate change; and by improving public health through better air quality.[10]
The social costs of transport include road crashes, air pollution, physical inactivity,[11] time taken away from the family while commuting and vulnerability to fuel price increases. Many of these negative impacts fall disproportionately on those social groups who are also least likely to own and drive cars.[12] Traffic congestion imposes economic costs by wasting people's time and by slowing the delivery of goods and services.
Traditional transport planning aims to improve mobility, especially for vehicles, and may fail to adequately consider wider impacts. But the real purpose of transport is access – to work, education, goods and services, friends and family – and there are proven techniques to improve access while simultaneously reducing environmental and social impacts, and managing traffic congestion.[13] Communities which are successfully improving the sustainability of their transport networks are doing so as part of a wider programme of creating more vibrant, livable, sustainable cities.
Definition
The term sustainable transport came into use as a logical follow-on from sustainable development, and is used to describe modes of transport, and systems of transport planning, which are consistent with wider concerns of sustainability. There are many definitions of the sustainable transport, and of the related terms sustainable transportation and sustainable mobility.[14] One such definition, from the European Union Council of Ministers of Transport, defines a sustainable transportation system as one that:
- Allows the basic access and development needs of individuals, companies and society to be met safely and in a manner consistent with human and ecosystem health, and promotes equity within and between successive generations.
- Is affordable, operates fairly and efficiently, offers a choice of transport mode, and supports a competitive economy, as well as balanced regional development.
- Limits emissions and waste within the planet’s ability to absorb them, uses renewable resources at or below their rates of generation, and uses non-renewable resources at or below the rates of development of renewable substitutes, while minimizing the impact on the use of land and the generation of noise.
Sustainability extends beyond just the operating efficiency and emissions. A life-cycle assessment involves production, use and post-use considerations. A cradle-to-cradle design is more important than a focus on a single factor such as energy efficiency.[15][16]
History

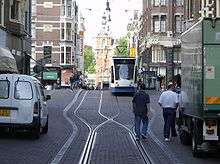
Most of the tools and concepts of sustainable transport were developed before the phrase was coined. Walking, the first mode of transport, is also the most sustainable.[17] Public transport dates back at least as far as the invention of the public bus by Blaise Pascal in 1662.[18] The first passenger tram began operation in 1807 and the first passenger rail service in 1825. Pedal bicycles date from the 1860s. These were the only personal transport choices available to most people in Western countries prior to World War II, and remain the only options for most people in the developing world. Freight was moved by human power, animal power or rail.
The post-war years brought increased wealth and a demand for much greater mobility for people and goods. The number of road vehicles in Britain increased fivefold between 1950 and 1979,[19] with similar trends in other Western nations. Most affluent countries and cities invested heavily in bigger and better-designed roads and motorways, which were considered essential to underpin growth and prosperity. Transport planning became a branch of Urban Planning and identified induced demand as a pivotal change from "predict and provide" toward a sustainable approach incorporating land use planning and public transit. Public investment in transit, walking and cycling declined dramatically in the United States, Great Britain and Australia, although this did not occur to the same extent in Canada or mainland Europe.[20][21]
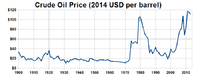
Concerns about the sustainability of this approach became widespread during the 1973 oil crisis and the 1979 energy crisis. The high cost and limited availability of fuel led to a resurgence of interest in alternatives to single occupancy vehicle travel.
Transport innovations dating from this period include high-occupancy vehicle lanes, citywide carpool systems and transportation demand management. Singapore implemented congestion pricing in the late 1970s, and Curitiba began implementing its Bus Rapid Transit system in the early 1980s.
Relatively low and stable oil prices during the 1980s and 1990s led to significant increases in vehicle travel from 1980–2000, both directly because people chose to travel by car more often and for greater distances, and indirectly because cities developed tracts of suburban housing, distant from shops and from workplaces, now referred to as urban sprawl. Trends in freight logistics, including a movement from rail and coastal shipping to road freight and a requirement for just in time deliveries, meant that freight traffic grew faster than general vehicle traffic.
At the same time, the academic foundations of the "predict and provide" approach to transport were being questioned, notably by Peter Newman in a set of comparative studies of cities and their transport systems dating from the mid-1980s.[22]
The British Government's White Paper on Transport[23] marked a change in direction for transport planning in the UK. In the introduction to the White Paper, Prime Minister Tony Blair stated that
We recognise that we cannot simply build our way out of the problems we face. It would be environmentally irresponsible – and would not work.
A companion document to the White Paper called "Smarter Choices" researched the potential to scale up the small and scattered sustainable transport initiatives then occurring across Britain, and concluded that the comprehensive application of these techniques could reduce peak period car travel in urban areas by over 20%.[24]
A similar study[25] by the United States Federal Highway Administration,[26] was also released in 2004 and also concluded that a more proactive approach to transportation demand was an important component of overall national transport strategy.
Environmental impact
| Part of a series about |
| Sustainable energy |
|---|
 |
| Energy conservation |
| Renewable energy |
| Sustainable transport |
|
Transport systems are major emitters of greenhouse gases, responsible for 23% of world energy-related GHG emissions in 2004, with about three quarters coming from road vehicles. Currently 95% of transport energy comes from petroleum.[7] Energy is consumed in the manufacture as well as the use of vehicles, and is embodied in transport infrastructure including roads, bridges and railways.[28]
The first historical attempts of evaluating the Life Cycle environmental impact of vehicle is due to Theodore Von Karman.[29] After decades in which all the analysis has been focused on emending the Von Karman model, Dewulf and Van Langenhove have introduced an model based on the second law of thermodynamics and exergy analysis.[30] Chester and Orwath,[31][32][33] have developed a similar model based on the first law that accounts the necessary costs for the infrastructure.
The environmental impacts of transport can be reduced by reducing the weight of vehicles,[34] sustainable styles of driving, reducing the friction of tires, encouraging electric and hybrid vehicles, improving the walking and cycling environment in cities, and by enhancing the role of public transport, especially electric rail.[7]
Green vehicles are intended to have less environmental impact than equivalent standard vehicles, although when the environmental impact of a vehicle is assessed over the whole of its life cycle this may not be the case.[35] Electric vehicle technology has the potential to reduce transport CO2 emissions, depending on the embodied energy of the vehicle and the source of the electricity.[36] The primary sources of electricity currently used in most countries (coal, gas, oil) mean that until world electricity production changes substantially, private electric cars will result in the same or higher production of CO2 than petrol equivalent vehicles.[37] The Online Electric Vehicle (OLEV), developed by the Korea Advanced Institute of Science and Technology (KAIST), is an electric vehicle that can be charged while stationary or driving, thus removing the need to stop at a charging station. The City of Gumi in South Korea runs a 24 km roundtrip along which the bus will receive 100 kW (136 horsepower) electricity at an 85% maximum power transmission efficiency rate while maintaining a 17 cm air gap between the underbody of the vehicle and the road surface. At that power, only a few sections of the road need embedded cables.[38] Hybrid vehicles, which use an internal combustion engine combined with an electric engine to achieve better fuel efficiency than a regular combustion engine, are already common. Natural gas is also used as a transport fuel. Biofuels are a less common, and less promising, technology; Brazil met 17% of its transport fuel needs from bioethanol in 2007, but the OECD has warned that the success of biofuels in Brazil is due to specific local circumstances; internationally, biofuels are forecast to have little or no impact on greenhouse emissions, at significantly higher cost than energy efficiency measures.[39]
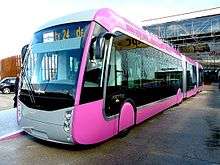
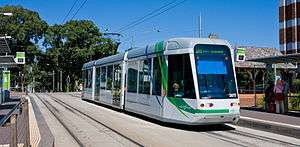
In practice there is a sliding scale of green transport depending on the sustainability of the option. Green vehicles are more fuel-efficient, but only in comparison with standard vehicles, and they still contribute to traffic congestion and road crashes. Well-patronised public transport networks based on traditional diesel buses use less fuel per passenger than private vehicles, and are generally safer and use less road space than private vehicles.[20] Green public transport vehicles including electric trains, trams and electric buses combine the advantages of green vehicles with those of sustainable transport choices. Other transport choices with very low environmental impact are cycling and other human-powered vehicles, and animal powered transport. The most common green transport choice, with the least environmental impact is walking.
Transport on rails boasts an excellent efficiency (see fuel efficiency in transportation).
Transport and social sustainability
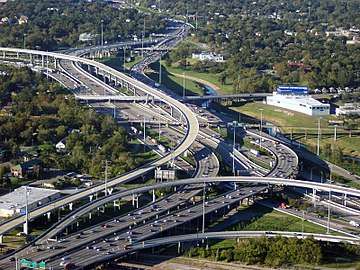
Cities with overbuilt roadways have experienced unintended consequences, linked to radical drops in public transport, walking, and cycling. In many cases, streets became void of “life.” Stores, schools, government centers and libraries moved away from central cities, and residents who did not flee to the suburbs experienced a much reduced quality of public space and of public services. As schools were closed their mega-school replacements in outlying areas generated additional traffic; the number of cars on US roads between 7:15 and 8:15 a.m. increases 30% during the school year.[40]
Yet another impact was an increase in sedentary lifestyles, causing and complicating a national epidemic of obesity, and accompanying dramatically increased health care costs.[11][41]
Cities
Cities are shaped by their transport systems. In The City in History, Lewis Mumford documented how the location and layout of cities was shaped around a walkable center, often located near a port or waterway, and with suburbs accessible by animal transport or, later, by rail or tram lines.
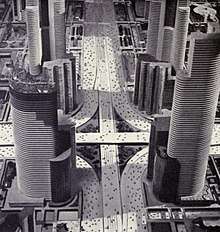
In 1939, the New York World's Fair included a model of an imagined city, built around a car-based transport system. In this "greater and better world of tomorrow", residential, commercial and industrial areas were separated, and skyscrapers loomed over a network of urban motorways. These ideas captured the popular imagination, and are credited with influencing city planning from the 1940s to the 1970s.[42]
The popularity of the car in the post-war era led to major changes in the structure and function of cities.[43] There was some opposition to these changes at the time. The writings of Jane Jacobs, in particular The Death and Life of Great American Cities provide a poignant reminder of what was lost in this transformation, and a record of community efforts to resist these changes. Lewis Mumford asked "is the city for cars or for people?"[44] Donald Appleyard documented the consequences for communities of increasing car traffic in "The View from the Road" (1964) and in the UK, Mayer Hillman first published research into the impacts of traffic on child independent mobility in 1971.[45] Despite these notes of caution, trends in car ownership,[19] car use and fuel consumption continued steeply upward throughout the post-war period.
Mainstream transport planning in Europe has, by contrast, never been based on assumptions that the private car was the best or only solution for urban mobility. For example, the Dutch Transport Structure Scheme has since the 1970s required that demand for additional vehicle capacity only be met "if the contribution to societal welfare is positive", and since 1990 has included an explicit target to halve the rate of growth in vehicle traffic.[46] Some cities outside Europe have also consistently linked transport to sustainability and to land-use planning, notably Curitiba, Brazil, Portland, Oregon and Vancouver, Canada.

There are major differences in transport energy consumption between cities; an average U.S. urban dweller uses 24 times more energy annually for private transport than a Chinese urban resident, and almost four times as much as a European urban dweller. These differences cannot be explained by wealth alone but are closely linked to the rates of walking, cycling, and public transport use and to enduring features of the city including urban density and urban design.[47]

The cities and nations that have invested most heavily in car-based transport systems are now the least environmentally sustainable, as measured by per capita fossil fuel use.[47] The social and economic sustainability of car-based transportation engineering has also been questioned. Within the United States, residents of sprawling cities make more frequent and longer car trips, while residents of traditional urban neighbourhoods make a similar number of trips, but travel shorter distances and walk, cycle and use transit more often.[48] It has been calculated that New York residents save $19 billion each year simply by owning fewer cars and driving less than the average American.[49] A less car intensive means of urban transport is carsharing, which is becoming popular in North America and Europe, and according to The Economist, carsharing can reduce car ownership at an estimated rate of one rental car replacing 15 owned vehicles.[50] Car sharing has also begun in the developing world, where traffic and urban density is often worse than in developed countries. Companies like Zoom in India, eHi in China, and Carrot in Mexico, are bringing car-sharing to developing countries in an effort to reduce car-related pollution, ameliorate traffic, and expand the number of people who have access to cars.[51]
The European Commission adopted the Action Plan on urban mobility on 2009-09-30 for sustainable urban mobility. The European Commission will conduct a review of the implementation of the Action Plan in the year 2012, and will assess the need for further action. In 2007, 72% of the European population lived in urban areas, which are key to growth and employment. Cities need efficient transport systems to support their economy and the welfare of their inhabitants. Around 85% of the EU’s GDP is generated in cities. Urban areas face today the challenge of making transport sustainable in environmental (CO2, air pollution, noise) and competitiveness (congestion) terms while at the same time addressing social concerns. These range from the need to respond to health problems and demographic trends, fostering economic and social cohesion to taking into account the needs of persons with reduced mobility, families and children.[52]
Policies and governance
Sustainable transport policies have their greatest impact at the city level. Outside Western Europe, cities which have consistently included sustainability as a key consideration in transport and land use planning include Curitiba, Brazil; Bogota, Colombia; Portland, Oregon; and Vancouver, Canada. The state of Victoria, Australia passed legislation in 2010 – the Transport Integration Act[53] – to compel its transport agencies to actively consider sustainability issues including climate change impacts in transport policy, planning and operations.[54]
Many other cities throughout the world have recognised the need to link sustainability and transport policies, for example by joining Cities for Climate Protection.[55]
Community and grassroots action
Sustainable transport is fundamentally a grassroots movement, albeit one which is now recognised as of citywide, national and international significance.
Whereas it started as a movement driven by environmental concerns, over these last years there has been increased emphasis on social equity and fairness issues, and in particular the need to ensure proper access and services for lower income groups and people with mobility limitations, including the fast-growing population of older citizens. Many of the people exposed to the most vehicle noise, pollution and safety risk have been those who do not own, or cannot drive cars, and those for whom the cost of car ownership causes a severe financial burden.[56]
An organization called Greenxc started in 2011 created a national awareness campaign in the United States encouraging people to carpool by ride-sharing cross country stopping over at various destinations along the way and documenting their travel through video footage, posts and photography.[57] Ride-sharing reduces individual's carbon footprint by allowing several people to use one car instead of everyone using individual cars.
Recent trends
Car travel increased steadily throughout the twentieth century, but trends since 2000 have been more complex. Oil price rises from 2003 have been linked to a decline in per capita fuel use for private vehicle travel in the USA,[58] Britain and Australia. In 2008, global oil consumption fell by 0.8% overall, with significant declines in consumption in North America, Western Europe, and parts of Asia.[59] Other factors affecting a decline in driving, at least in America, include the retirement of Baby Boomers who now drive less, preference for other travel modes (such as transit) by younger age cohorts, the Great Recession, and the rising use of technology (internet, mobile devices) which have made travel less necessary and possibly less attractive.[60]
Greenwashing
The term green transport is often used as a greenwash marketing technique for products which are not proven to make a positive contribution to environmental sustainability. Such claims can be legally challenged. For instance Norway's consumer ombudsman has targeted automakers who claim that their cars are "green", "clean" or "environmentally friendly". Manufacturers risk fines if they fail to drop the words.[61] The Australian Competition and Consumer Commission (ACCC) describes green claims on products as very vague, inviting consumers to give a wide range of meanings to the claim, which risks misleading them.[62] In 2008 the ACCC forced a car retailer to stop its green marketing of Saab cars, which was found by the Australian Federal Court as misleading.[63]
Objectives
The EU Directorate-General for Transport and Energy (DG-TREN) has launched a programme which focusses mostly on Urban Transport. Its main measures are:
|
|
|
See also
- Energy efficiency in transport
- Alternatives to car use
- Sustainable aviation fuel
- Sustainable distribution
- Environmental impact of aviation
- EcoMobility Alliance
- Hypermobility
- Institute for Transportation and Development Policy
- Localism (politics)
- Michael Replogle
- Michelin Challenge Bibendum
- International Association of Public Transport
Notes and references
- ↑ Jeon, C M; Amekudzi (March 2005), "Addressing Sustainability in Transportation Systems: Definitions, Indicators, and Metrics" (PDF), Journal of Infrastructure Systems: 31–50
- ↑ Helping to Build a Safe and Sustainable Transportation Infrastructure (PDF), U.S. Department of Transportation’s Research and Innovative Technology Administration, May 2010
- ↑ Schafer, A. (1998) "The global demand for motorized mobility." Transportation Research A 32(6), 455-477.
- ↑ "LEDS in Practice: Fight poverty". Low Emission Development Strategies Global Partnership (LEDS GP).
- ↑ ">World Energy Council (2007). "Transport Technologies and Policy Scenarios". World Energy Council. Archived from the original on 2008-12-04. Retrieved 2009-05-26.
- ↑ "About Transportation & Climate Change: Transportation's Role in Climate Change: Overview - DOT Transportation and Climate Change Clearinghouse". climate.dot.gov. Retrieved 2015-11-15.
- 1 2 3 Intergovernmental Panel on Climate Change (2007). "IPCC Fourth Assessment Report: Mitigation of Climate Change, chapter 5, Transport and its Infrastructure" (PDF). Intergovernmental Panel on Climate Change. Retrieved 2009-05-26.
- ↑ "National multipollutant emissions comparison by source sector in 2002". US Environmental Protection Agency. 2002. Retrieved 2009-03-18.
- ↑ "Air pollution: World's worst Environmental health risk" (PDF). United Nations Environment Programme (UNEP).
- 1 2 "LEDS in Practice: Breathe clean". Low Emission Development Strategies Global Partnership (LEDS GP).
- 1 2 World Health Organisation, Europe. "Health effects of transport". Archived from the original on 2010-04-30. Retrieved 2008-08-29.
- ↑ Social Exclusion Unit, Office of the Prime Minister (UK). "Making the Connections - final report on transport and social exclusion" (PDF). Archived from the original (PDF) on 2010-09-07. Retrieved 2003-02-01.
- ↑ Todd Litman (1998). "Measuring Transportation: Traffic, Mobility and Accessibility" (PDF). Victoria Transport Policy Institute. Retrieved 2009-03-18.
- ↑ Todd Litman (2009). "Sustainable Transportation and TDM". Online TDM Encyclopedia. Victoria Transport Policy Institute. Retrieved 2009-04-07.
- ↑ Strategies for Managing Impacts from Automobiles, US EPA Region 10, retrieved May 22, 2012
- ↑ "European Union's End-of-life Vehicle (ELV) Directive", End of Life Vehicles, EU, retrieved May 22, 2012
- ↑ "Walking benefits". Transport for London. Retrieved 2009-05-16.
- ↑ "March 18, 1662: The Bus Starts Here ... in Paris". Wired. 2008-03-18. Archived from the original on 2009-05-22. Retrieved 2009-05-16.
- 1 2 "Transport Statistics Great Britain 2008: Section 9, Vehicles" (PDF). Archived from the original (PDF) on 2009-01-03. Retrieved 2009-03-18.
- 1 2 "Making Transit Work: insight from Western Europe, Canada and the United States" (PDF). Transportation Research Board. 2001. Retrieved 2008-07-22.
- ↑ "Promoting Safe Walking and Cycling to Improve Public Health:Lessons from The Netherlands and Germany" (PDF). American Journal of Public Health, Vol. 93. Retrieved 2008-08-30.
- ↑ Cities and Automobile Dependence: An International Sourcebook, Newman P and Kenworthy J, Gower, Aldershot, 1989
- ↑ "White Paper on Transport". 2004. Archived from the original on 2010-02-06. Retrieved 2009-07-04.
- ↑ Cairns, S; et al. (July 2004). "Smarter Choices, Changing the Way we Travel page v". Archived from the original on June 14, 2007. Retrieved 2008-07-27.
- ↑ [ similar study]
- ↑ "Mitigating Traffic Congestion". 2004. Retrieved 2009-07-04.
- ↑ "Van Hool presents the ExquiCity Design Mettis". Archived from the original on 5 June 2013. Retrieved 5 June 2012.
- ↑ Joshua M. Pearce, Sara J. Johnson, and Gabriel B. Grant Resources, Conservation and Recycling, 51 pp. 435-453, 2007. "3D-Mapping Optimization of Embodied Energy of Transportation". Retrieved 1 March 2018.
- ↑ Gabrielli G, and von Karman Th, “What price speed?,” Mechanical Engineering, Vol 72, pp. 775-781, 1950.
- ↑ Dewulf J, and Van Langenhove H., “Exergetic material input per unit of service (EMIPS) for the assessment of resource productivity of transport commodities”. Resources Conservation and Recycling. 38(2), Pages: 161–174 (2003).
- ↑ Chester M, and Horvath A, Environmental Assessment of Passenger Transportation Should Include Infrastructure and Supply Chains, Environmental Research Letters 4(2), 2009.
- ↑ Chester M, and Horvath A, High-speed Rail with Emerging Automobiles and Aircraft Can Reduce Environmental Impacts in California's Future, Environmental Research Letters 7(3), 2012.
- ↑ Chester et al., “Infrastructure and Automobile Shifts: Positioning Transit to Reduce Life-cycle Environmental Impacts for Urban Sustainability Goals”, Environmental Research Letters 8(1), 2012
- ↑ TRANCOSSI, M. What price of speed? A critical revision through constructal optimization of transport modes. International Journal of Energy and Environmental Engineering, 2014, 1-24. https://link.springer.com/article/10.1007/s40095-015-0160-6
- ↑ Heather L. MacLean and Lester B. Lave University of Toronto (2003). "OECD's Economic Assessment of Biofuel Support Policies". Environmental Science & Technology. 37 (23): 5445. doi:10.1021/es034574q. Retrieved 1 March 2018.
- ↑ Brinkman, Norman; Eberle, Ulrich; Formanski, Volker; Grebe, Uwe-Dieter; Matthe, Roland (2012-04-15). "Vehicle Electrification - Quo Vadis". VDI. Retrieved 2013-04-27.
- ↑ Clive Matthew-Wilson. "The Emperor's New Car" (PDF). Retrieved 2016-06-05.
- ↑ http://www.kaist.edu/english/01_about/06_news_01.php?req_P=bv&req_BIDX=10&req_BNM=ed_news&pt=17&req_VI=4404
- ↑ OECD. "OECD's Economic Assessment of Biofuel Support Policies". Archived from the original on 2009-05-15. Retrieved 2009-07-31.
- ↑ U.S. Centers for Disease Control and Prevention. "Active Transportation to School Then and Now — Barriers and Solutions". KidsWalk-to-School: Resource Materials - DNPAO - CDC. Archived from the original on 2010-03-09. Retrieved 2008-07-22.
- ↑ "An interview with Dr Reid Ewing". Relationship between urban sprawl and physical activity, obesity, and morbidity. American Journal of Health Promotion 18[1]: 47-57. September–October 2003. Archived from the original on 2006-03-15. Retrieved 2008-07-25.
- ↑ Ellis, Cliff (2005). "Lewis Mumford and Norman Bel Geddes: the highway, the city and the future". Planning Perspectives. 20 (1): 51–68. doi:10.1080/0266543042000300537. Retrieved 2009-06-14.
- ↑ James Howard Kunstler (1993). The Geography of Nowhere.
- ↑ Lewis Mumford. "Lewis Mumford on the City". Retrieved 2009-03-18.
- ↑ Hillman, Mayer. "Children Key publications". Key publicatonson children's quality of life by Dr. Mayer Hillman. Retrieved 2009-03-18.
- ↑ van den Hoorn, T & B van Luipen (2003). "National and Regional Transport Policy in the Netherlands" (PDF). Archived from the original (PDF) on 2011-07-24. Retrieved 2008-07-27.
- 1 2 Kenworthy, J R Transport Energy Use and Greenhouse Emissions in Urban Passenger Transport Systems : A Study of 84 Global Cities Archived 2008-09-09 at the Wayback Machine. Murdoch University
- ↑ Ewing, Reid & Cervero, Robert (2001). "Travel and the Built Environment: A Synthesis" (PDF). Transportation Research Record, 1780: 87-114. 2001. Retrieved 2008-07-22.
- ↑ "New York City's Green Dividend" (PDF). CEOs for Cities. 2009. Retrieved 2010-05-15.
- ↑ "Seeing the back of the car". The Economist. 2012-09-22. Retrieved 2012-09-23. Published in the Sept 22nd 2012 print edition.
- ↑ "How are social enterprises helping address road safety and transportation challenges in India?".
- ↑ Transport: Action Plan on urban mobility - European commission Archived 2010-05-29 at the Wayback Machine.
- ↑ Transport Integration Act 2010
- ↑ Transport Integration Act 2010, Part 2 - see http://www.legislation.vic.gov.au.
- ↑ "ICLEI Local Governments for Sustainability". Cities for Climate Protection. International Council for Local Environmental Initiatives. 1995–2008. Archived from the original on 2009-03-07. Retrieved 2009-03-18.
- ↑ "Making the Connections: Final report on transport and social exclusion". UK Social Exclusion Unit. February 2003. Archived from the original on 2008-05-21. Retrieved 2008-07-22.
- ↑ "GreenXC". GreenXC Website.
- ↑ "Transportation Energy Data Book". US Department of Energy. 2009. Retrieved 2010-05-14.
- ↑ "BP Statistical Review of World Energy 2009". BP. 2009. Retrieved 2010-05-14.
- ↑ "A New Direction". 2013. U.S. PIRG. Retrieved 15 October 2013.
- ↑ "Norways Says Cars Neither Green Nor Clean". Reuters.com. 2007-09-06. Retrieved 2009-10-04.
- ↑ ACCC: Green marketing and the Trade Practices Act, 2008 Archived 2010-12-12 at the Wayback Machine.. Retrieved 2009-10-04.
- ↑ 'Drive.com.au: Coming clean on green Archived 2012-02-22 at the Wayback Machine.. Retrieved 2009-10-04.
Bibliography
- Sustainability and Cities: Overcoming Automobile Dependence, Island Press, Washington DC, 1999. Newman P and Kenworthy J, ISBN 1-55963-660-2.
- Sustainable Transportation Networks, Edward Elgar Publishing, Cheltenham, England, 2000. Nagurney A, ISBN 1-84064-357-9
- Introduction to Sustainable Transportation: Policy, Planning and Implementation, Earthscan, London, Washington DC, 2010. Schiller P Eric C. Bruun and Jeffrey R. Kenworthy, ISBN 978-1-84407-665-9.
- Sustainable Transport, Mobility Management and Travel Plans, Ashgate Press, Farnham, Surrey, 2012, Enoch M P. ISBN 978-0-7546-7939-4.
External links
- Sustainable Mobility Initiative (National Renewable Energy Laboratory)
- Sustainable Transportation Research (National Renewable Energy Laboratory)
- Efficient Mobility Summit: Transportation and the Future of Dynamic Mobility Systems, January 2016 (National Renewable Energy Laboratory)
- Share & lend bicycles across the globe, for free
- A Global High Shift Scenario: Impacts And Potential For More Public Transport, Walking, And Cycling With Lower Car Use, Institute for Transportation and Development Policy, September 2014
- INHERIT Project, a Horizon 2020 Project to identify ways of living, moving and consuming that protect the environment and promote health and health equity.
- Guiding Principles to Sustainable Mobility
- Sustainable Urban Transport Project - knowledge platform (SUTP)
- Capacity Building for Sustainable Urban Transport - open platform for training and e-learning offers (hosted by SUTP)
- German Partnership for Sustainable Mobility (GPSM)
- Institute for Transportation and Development Policy (ITDP)
- EMBARQ - The WRI Center for Sustainable Transportation
- Institute for Sustainability and Technology Policy
- Bridging the Gap: Pathways for transport in the post 2012 process
- Sustainable-mobility.org: the centre of resources on sustainable transport
- QUEST project: Quality Management tool for Urban Energy efficient Sustainable Transport
- EcoMobility Alliance: An ICLEI - Local Governments for Sustainability Initiative on Transport
- Sustainable Transportation in the Middle East via Carboun
- The Ecoliner Fairwinds, a proposed large sailing container vessel
- The Greenheart, a proposed small sailing container vessel
- Transport Action Plan: Urban Electric Mobility Initiative, United Nations, Climate Summit 2014, September 2014
- Turning the right corner : ensuring development through a low-carbon transport sector, World Bank Group, May 2013.
- Is this the future? A more sustainable inner city delivery system
- Improve sustainability of delivery fleets
- Transportation Research at IssueLab