Traffic congestion
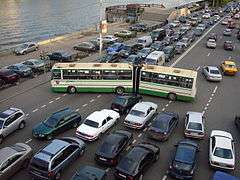
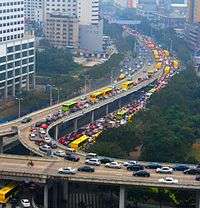
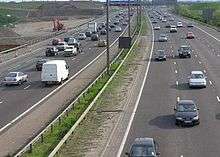
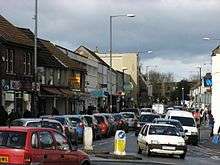
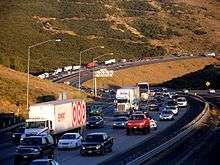
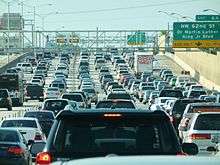
Traffic congestion is a condition on transport networks that occurs as use increases, and is characterized by slower speeds, longer trip times, and increased vehicular queueing. When traffic demand is great enough that the interaction between vehicles slows the speed of the traffic stream, this results in some congestion. While congestion is a possibility for any mode of transportation, this article will focus on automobile congestion on public roads.
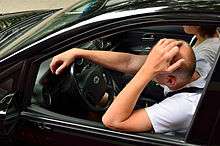
As demand approaches the capacity of a road (or of the intersections along the road), extreme traffic congestion sets in. When vehicles are fully stopped for periods of time, this is colloquially known as a traffic jam or traffic snarl-up. Traffic congestion can lead to drivers becoming frustrated and engaging in road rage.
Mathematically, congestion is usually looked at as the number of vehicles that pass through a point in a window of time, or a flow. Congestion flow lends itself to principles of fluid dynamics.
Causes
Traffic congestion occurs when a volume of traffic or modal split generates demand for space greater than the available street capacity; this point is commonly termed saturation. There are a number of specific circumstances which cause or aggravate congestion; most of them reduce the capacity of a road at a given point or over a certain length, or increase the number of vehicles required for a given volume of people or goods. About half of U.S. traffic congestion is recurring, and is attributed to sheer weight of traffic; most of the rest is attributed to traffic incidents, road work and weather events.[2]
Traffic research still cannot fully predict under which conditions a "traffic jam" (as opposed to heavy, but smoothly flowing traffic) may suddenly occur. It has been found that individual incidents (such as accidents or even a single car braking heavily in a previously smooth flow) may cause ripple effects (a cascading failure) which then spread out and create a sustained traffic jam when, otherwise, normal flow might have continued for some time longer.[3]
Separation of work and residential areas
People often work and live in different parts of the city. Places of work are often located away from housing areas, resulting in the need for people to commute to work. According to a 2011 report published by the United States Census Bureau, a total of 132.3 million people in the United States commute between their work and residential areas daily. [4]
Movement to obtain or provide goods and services
People may need to move about within the city to obtain goods and services, for instance to purchase goods or attend classes in a different part of the city. Brussels, a city with a strong service economy, has one of the worst traffic congestion in the world, wasting 74 hours in traffic in 2014.
Inadequate transport infrastructure and services.
This means that the city’s transportation facilities are not capable of handling the amount of traffic it receives, such as the lack of alternative routes on roads, and a lack of public transportation where buses and trains are overcrowded and infrequent. In Mumbai, India, trains are often filled to many times their capacity. Buses caught in traffic congestion are often filled with passengers. Therefore, many people turn to driving their own cars to have a more pleasant commute. Thus, many people turn to driving their own cars which can cause a heavier traffic flow.
Mathematical theories

Some traffic engineers have attempted to apply the rules of fluid dynamics to traffic flow, likening it to the flow of a fluid in a pipe. Congestion simulations and real-time observations have shown that in heavy but free flowing traffic, jams can arise spontaneously, triggered by minor events ("butterfly effects"), such as an abrupt steering maneuver by a single motorist. Traffic scientists liken such a situation to the sudden freezing of supercooled fluid.[5]
However, unlike a fluid, traffic flow is often affected by signals or other events at junctions that periodically affect the smooth flow of traffic. Alternative mathematical theories exist, such as Boris Kerner's three-phase traffic theory (see also spatiotemporal reconstruction of traffic congestion).
Because of the poor correlation of theoretical models to actual observed traffic flows, transportation planners and highway engineers attempt to forecast traffic flow using empirical models. Their working traffic models typically use a combination of macro-, micro- and mesoscopic features, and may add matrix entropy effects, by "platooning" groups of vehicles and by randomising the flow patterns within individual segments of the network. These models are then typically calibrated by measuring actual traffic flows on the links in the network, and the baseline flows are adjusted accordingly.
A team of MIT mathematicians has developed a model that describes the formation of "phantom jams," in which small disturbances (a driver hitting the brake too hard, or getting too close to another car) in heavy traffic can become amplified into a full-blown, self-sustaining traffic jam. Key to the study is the realization that the mathematics of such jams, which the researchers call "jamitons," are strikingly similar to the equations that describe detonation waves produced by explosions, says Aslan Kasimov, lecturer in MIT's Department of Mathematics. That discovery enabled the team to solve traffic-jam equations that were first theorized in the 1950s.[6]
Economic theories
Congested roads can be seen as an example of the tragedy of the commons. Because roads in most places are free at the point of usage, there is little financial incentive for drivers not to over-use them, up to the point where traffic collapses into a jam, when demand becomes limited by opportunity cost. Privatization of highways and road pricing have both been proposed as measures that may reduce congestion through economic incentives and disincentives. Congestion can also happen due to non-recurring highway incidents, such as a crash or roadworks, which may reduce the road's capacity below normal levels.
Economist Anthony Downs argues that rush hour traffic congestion is inevitable because of the benefits of having a relatively standard work day . In a capitalist economy, goods can be allocated either by pricing (ability to pay) or by queueing (first-come first-served); congestion is an example of the latter. Instead of the traditional solution of making the "pipe" large enough to accommodate the total demand for peak-hour vehicle travel (a supply-side solution), either by widening roadways or increasing "flow pressure" via automated highway systems, Downs advocates greater use of road pricing to reduce congestion (a demand-side solution, effectively rationing demand), in turn plowing the revenues generated therefrom into public transportation projects.
A 2011 study in The American Economic Review indicates that there may be a "fundamental law of road congestion." The researchers, from the University of Toronto and the London School of Economics, analyzed data from the U.S. Highway Performance and Monitoring System for 1983, 1993 and 2003, as well as information on population, employment, geography, transit, and political factors. They determined that the number of vehicle-kilometers traveled (VKT) increases in direct proportion to the available lane-kilometers of roadways. The implication is that building new roads and widening existing ones only results in additional traffic that continues to rise until peak congestion returns to the previous level.[7][8]
Classification
Qualitative classification of traffic is often done in the form of a six letter A-F level of service (LOS) scale defined in the Highway Capacity Manual, a US document used (or used as a basis for national guidelines) worldwide. These levels are used by transportation engineers as a shorthand and to describe traffic levels to the lay public. While this system generally uses delay as the basis for its measurements, the particular measurements and statistical methods vary depending on the facility being described. For instance, while the percent time spent following a slower-moving vehicle figures into the LOS for a rural two-lane road, the LOS at an urban intersection incorporates such measurements as the number of drivers forced to wait through more than one signal cycle.[9]
Traffic congestion occurs in time and space, i.e., it is a spatiotemporal process. Therefore, another classification schema of traffic congestion is associated with some common spatiotemporal features of traffic congestion found in measured traffic data. Common spatiotemporal empirical features of traffic congestion are those features, which are qualitatively the same for different highways in different countries measured during years of traffic observations. Common features of traffic congestion are independent on weather, road conditions and road infrastructure, vehicular technology, driver characteristics, day time, etc. Examples of common features of traffic congestion are the features [J] and [S] for, respectively, the wide moving jam and synchronized flow traffic phases found in Kerner’s three-phase traffic theory. The common features of traffic congestion can be reconstructed in space and time with the use of the ASDA and FOTO models.
Negative impacts
Traffic congestion has a number of negative effects:
- Wasting time of motorists and passengers ("opportunity cost"). As a non-productive activity for most people, congestion reduces regional economic health.
- Delays, which may result in late arrival for employment, meetings, and education, resulting in lost business, disciplinary action or other personal losses.
- Inability to forecast travel time accurately, leading to drivers allocating more time to travel "just in case", and less time on productive activities.
- Wasted fuel increasing air pollution and carbon dioxide emissions owing to increased idling, acceleration and braking.
- Wear and tear on vehicles as a result of idling in traffic and frequent acceleration and braking, leading to more frequent repairs and replacements.
- Stressed and frustrated motorists, encouraging road rage and reduced health of motorists
- Emergencies: blocked traffic may interfere with the passage of emergency vehicles traveling to their destinations where they are urgently needed.
- Spillover effect from congested main arteries to secondary roads and side streets as alternative routes are attempted ('rat running'), which may affect neighborhood amenity and real estate prices.
- Higher chance of collisions due to tight spacing and constant stopping-and-going.
Road rage
Road rage is aggressive or angry behavior by a driver of an automobile or other motor vehicle. Such behavior might include rude gestures, verbal insults, deliberately driving in an unsafe or threatening manner, or making threats. Road rage can lead to altercations, assaults, and collisions which result in injuries and even deaths. It can be thought of as an extreme case of aggressive driving.
The term originated in the United States in 1987–1988 (specifically, from Newscasters at KTLA, a local television station), when a rash of freeway shootings occurred on the 405, 110 and 10 freeways in Los Angeles, California. These shooting sprees even spawned a response from the AAA Motor Club to its members on how to respond to drivers with road rage or aggressive maneuvers and gestures.[10]
Economic loss
| Area | Loss in Billion | Note |
|---|---|---|
| USA | $305 [11] | [12] |
| UK | $52.01 | [13] |
| NYC | $33.7 | |
| LA | $19.2 | [14] |
| Manila | $18.615 | [15] |
| Bangladesh | $11.4 | [16] |
| SF | $10.6 | |
| Atlanta | $7.1 | |
| Jakarta | $5 | [17] |
| Dhaka | $4.462 | [18] |
| GTHA | $3.3 | [19] |
Positives impacts
Congestion has the benefit of encouraging motorists to retime their trips so that expensive road space is in full use for more hours per day.[20]
The standard response to congestion is to expand road space somehow, perhaps by widening an existing road or else by adding a new road, bridge or tunnel. However, that could well result in increased traffic flow, otherwise known as induced demand, causing congestion to appear somewhere else. Moreover, Braess' paradox shows that adding road capacity might make congestion worse, even if demand does not increase.
It has been argued that traffic congestion, by reducing road speeds in cities, could reduce the frequency and severity of road accidents.[21]
Countermeasures
Road infrastructure
- Junction improvements
- Grade separation, using bridges (or, less often, tunnels) freeing movements from having to stop for other crossing movements
- Ramp signalling, 'drip-feeding' merging traffic via traffic signals onto a congested motorway-type roadway
- Reducing junctions
- Local-express lanes, providing through lanes that bypass junction on-ramp and off-ramp zones
- Limited-access road, roads that limit the type and amounts of driveways along their lengths
- Reversible lanes, where certain sections of highway operate in the opposite direction on different times of the day(s) of the week, to match asymmetric demand. These pose a potential for collisions, if drivers do not notice the change in direction indicators. This may be controlled by variable-message signs or by movable physical separation
- Separate lanes for specific user groups (usually with the goal of higher people throughput with fewer vehicles)
- Bus lanes as part of a busway system
- Express toll lanes
- HOV lanes, for vehicles with at least three (sometimes at least two) riders, intended to encourage carpooling
- Slugging, impromptu carpooling at HOV access points, on a hitchhiking or payment basis
- Market-based carpooling with pre-negotiated financial incentives for the driver
Urban planning and design
City planning and urban design practices can have a huge impact on levels of future traffic congestion, though they are of limited relevance for short-term change.
- Grid plans including fused grid road network geometry, rather than tree-like network topology which branches into cul-de-sacs (which reduce local traffic, but increase total distances driven and discourage walking by reducing connectivity). This avoids concentration of traffic on a small number of arterial roads and allows more trips to be made without a car.
- Zoning laws that encourage mixed-use development, which reduces distances between residential, commercial, retail, and recreational destinations (and encourage cycling and walking)
- Carfree cities, car-light cities, and eco-cities designed to eliminate the need to travel by car for most inhabitants.[22][23]
- Transit-oriented development are residential and commercial areas designed to maximize access to public transport by providing a transit station or stop (train station, metro station, tram stop, or bus stop).
Supply and demand
Congestion can be reduced by either increasing road capacity (supply), or by reducing traffic (demand). Capacity can be increased in a number of ways, but needs to take account of latent demand otherwise it may be used more strongly than anticipated. Critics of the approach of adding capacity have compared it to "fighting obesity by letting out your belt" (inducing demand that did not exist before). For example, when new lanes are created, households with a second car that used to be parked most of the time may begin to use this second car for commuting.[24][25] Reducing road capacity has in turn been attacked as removing free choice as well as increasing travel costs and times, placing an especially high burden on the low income residents who must commute to work.
Increased supply can include:
- Adding more capacity at bottlenecks (such as by adding more lanes at the expense of hard shoulders or safety zones, or by removing local obstacles like bridge supports and widening tunnels)
- Adding more capacity over the whole of a route (generally by adding more lanes)
- Creating new routes
- Traffic management improvements (see separate section below)
Reduction of demand can include:
- Parking restrictions, making motor vehicle use less attractive by increasing the monetary and non-monetary costs of parking, introducing greater competition for limited city or road space.[26] Most transport planning experts agree that free parking distorts the market in favour of car travel, exacerbating congestion.[27][28]
- Park and ride facilities allowing parking at a distance and allowing continuation by public transport or ride sharing. Park-and-ride car parks are commonly found at metro stations, freeway entrances in suburban areas, and at the edge of smaller cities.
- Reduction of road capacity to force traffic onto other travel modes. Methods include traffic calming and the shared space concept.
- Road pricing, charging money for access onto a road/specific area at certain times, congestion levels or for certain road users
- "Cap and trade", in which only licensed cars are allowed on the roads.[29] A limited quota of car licences are issued each year and traded in a free market fashion. This guarantees that the number of cars does not exceed road capacity while avoiding the negative effects of shortages normally associated with quotas. However, since demand for cars tends to be inelastic, the result are exorbitant purchase prices for the licenses, pricing out the lower levels of society, as seen Singapore's Certificate of Entitlement scheme.[30]
- Congestion pricing, where a certain area, such as the inner part of a congested city, is surrounded with a cordon into which entry with a car requires payment. The cordon may be a physical boundary (i.e., surrounded by toll stations) or it may be virtual, with enforcement being via spot checks or cameras on the entry routes. Major examples are Singapore's electronic road pricing, the London congestion charge system, Stockholm congestion tax and the use of High-occupancy toll lanes, predominately in North America.
- Road space rationing, where regulatory restrictions prevent certain types of vehicles from driving under certain circumstances or in certain areas.
- Number plate restrictions based on days of the week, as practiced in several large cities in the world, such as Athens,[31] Mexico City, Manila and São Paulo.[32] In effect, such cities are banning a different part of the automobile fleet from roads each day of the week. Mainly introduced to combat smog, these measures also reduce congestion. A weakness of this method is that richer drivers can purchase a second or third car to circumvent the ban.
- Permits, where only certain types of vehicles (such as residents) are permitted to enter a certain area, and other types (such as through-traffic) are banned.[32] For example, Bertrand Delanoë, the mayor of Paris, has proposed to impose a complete ban on motor vehicles in the city's inner districts, with exemptions only for residents, businesses, and the disabled.[33]
- Policy approaches, which usually attempt to provide either strategic alternatives or which encourage greater usage of existing alternatives through promotion, subsidies or restrictions.
- Incentives to use public transport, increasing modal shares. This can be achieved through infrastructure investment, subsidies, transport integration, pricing strategies that decrease the marginal cost/fixed cost ratios,[34][35] improved timetabling and greater priority for buses to reduce journey time e.g. bus lanes or bus rapid transit .[36][37]
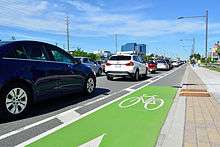
- Cycling promotion through legislation, cycle facilities, subsidies, and awareness campaigns.[38] The Netherlands has been pursuing cycle friendly policies for decades, and around a quarter of their commuting is done by bicycle.[39][40]
- Promotion of more flexible work place practices. For example, a flexible workplaces pilot was undertaken in Brisbane, Australia during 2009 to test the applicability of a voluntary travel behaviour change program to achieve transport system outcomes, particularly as they related to managing congestion, either through mode shift or peak spreading. During the one-month Pilot, amongst almost 900 Brisbane CBD workers across 20 private and public sector organisations, shifts of more than 30% out of the morning and afternoon peak travel was recorded.[41]
- Telecommuting encouraged through legislation and subsidies.[42]
- Online shopping promotion,[43][44] potentially with automated delivery booths helping to solve the last mile problem and reduce shopping trips made by car.[45]
Traffic management
Use of so-called Intelligent transportation system, which guide traffic:
- Traffic reporting, via radio, GPS and mobile apps, to advise road users
- Variable message signs installed along the roadway, to advise road users[46]
- Navigation systems, possibly linked up to automatic traffic reporting
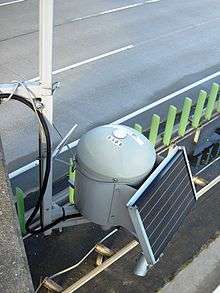
- Traffic counters permanently installed, to provide real-time traffic counts
- Convergence indexing road traffic monitoring, to provide information on the use of highway on-ramps
- Automated highway systems, a future idea which could reduce the safe interval between cars (required for braking in emergencies) and increase highway capacity by as much as 100% while increasing travel speeds
- Parking guidance and information systems providing dynamic advice to motorists about free parking
- Active Traffic Management[47] system opens up UK motorway hard shoulder as an extra traffic lane; it uses CCTV and VMS to control and monitor the traffic's use of the extra lane.
Other associated
- School opening times arranged to avoid rush hour traffic (in some countries, private car school pickup and drop-off traffic are substantial percentages of peak hour traffic).
- Considerate driving behaviour promotion and enforcement. Driving practices such as tailgating and frequent lane changes can reduce a road's capacity and exacerbate jams. In some countries signs are placed on highways to raise awareness, while others have introduced legislation against inconsiderate driving.
- Visual barriers to prevent drivers from slowing down out of curiosity (often called "rubbernecking" in the United States). This often includes accidents, with traffic slowing down even on roadsides physically separated from the crash location. This also tends to occur at construction sites, which is why some countries have introduced rules that motorway construction has to occur behind visual barrier
- Speed limit reductions, as practiced on the M25 motorway in London. With lower speeds allowing cars to drive closer together, this increases the capacity of a road. Note that this measure is only effective if the interval between cars is reduced, not the distance itself. Low intervals are generally only safe at low speeds.
- Lane splitting/filtering, in which some jurisdictions allow motorcycles, scooters and bicycles to travel in the space between cars, buses, and trucks.[48][49]
- Reduction of road freight avoiding problems such as double parking with innovative solutions including cargo bicycles and Gothenburg's Stadsleveransens.[50]
By country
Australia
Traffic during peak hours in major Australian cities, such as Sydney, Melbourne, Brisbane and Perth, is usually very congested and can cause considerable delay for motorists. Australians rely mainly on radio and television to obtain current traffic information. GPS, webcams, and online resources are increasingly being used to monitor and relay traffic conditions to motorists.
Bangladesh
Traffic jams have become intolerable in Dhaka. Some other major reasons are the total absence of a rapid transit system; the lack of an integrated urban planning scheme for over 30 years;[51] poorly maintained road surfaces, with potholes rapidly eroded further by frequent flooding and poor or non-existent drainage;[52] haphazard stopping and parking;[53] poor driving standards;[54] total lack of alternative routes, with several narrow and (nominally) one-way roads.[55]
Brazil
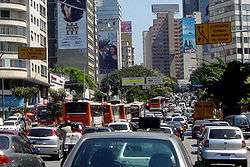
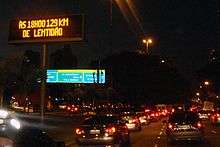
According to Time magazine, São Paulo has the world's worst daily traffic jams.[1] Based on reports from the Companhia de Engenharia de Tráfego, the city's traffic management agency, the historical congestion record was set on May 23, 2014, with 344 kilometres (214 mi) of cumulative queues around the city during the evening rush hour.[56] The previous record occurred on November 14, 2013, with 309 kilometres (192 mi) of cumulative queues.[56]
Despite implementation since 1997 of road space rationing by the last digit of the plate number during rush hours every weekday, traffic in this 20-million-strong city still experiences severe congestion. According to experts, this is due to the accelerated rate of motorization occurring since 2003 and the limited capacity of public transport. In São Paulo, traffic is growing at a rate of 7.5% per year, with almost 1,000 new cars bought in the city every day. The subway has only 61 kilometres (38 mi) of lines, though 35 further kilometers are under construction or planned by 2010. Every day, many citizens spend between three up to four hours behind the wheel. In order to mitigate the aggravating congestion problem, since June 30, 2008 the road space rationing program was expanded to include and restrict trucks and light commercial vehicles.[57][58]
Canada
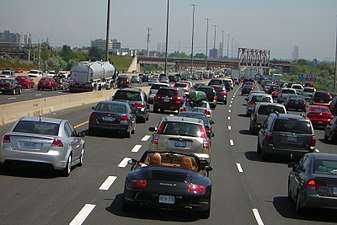
According to the Toronto Board of Trade, in 2010, Toronto is ranked as the most congested city of 19 surveyed cities, with an average commute time of 80 minutes.[61]
China
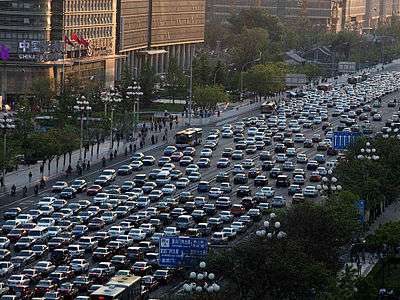
The Chinese city of Beijing started a license plate rationing since the 2008 Summer Olympics whereby each car is banned from the urban core one workday per week, depending on the last digit of its licence plate. As of 2016, 11 major Chinese cities have implemented similar policies.[62] Towards the end of 2010, Beijing announced a series of drastic measures to tackle the city's chronic traffic congestion, such as limiting the number of new plates issued to passenger cars to 20,000 a month, barring vehicles with non-Beijing plates from entering areas within the Fifth Ring Road during rush hours and expanding its subway system.[63] The government aims to cap the number of locally registered cars in Beijing to below 6.3 million by the end of 2020.[64] In addition, more than nine major Chinese cities including Shanghai, Guangzhou and Hangzhou started limiting the number of new plates issued to passenger cars in an attempt to curb the growth of car ownership.[65][66] In response to the increased demand to public transit caused by these policies, aggressive programs to rapidly expand public transport systems in many Chinese cities are currently underway.[67]
A unique Chinese phenomenon of severe traffic congestion occurs during Chunyun Period or Spring Festival travel season.[68] It is a long-held tradition for most Chinese people to reunite with their families during Chinese New Year. People return to their hometown to have a reunion dinner with their families on Chinese New Year. It has been described as the largest annual human migration in the world.[69][70] Since the economic boom and rapid urbanization of China since the late 1970s, many people work and study a considerable distance from their hometowns. Traffic flow is typically directional, with large amounts of the population working in more developed coastal provinces needing travel to their hometowns in the less developed interior. The process reverses near the end of Chunyun. With almost 3 billion trips[71] made in 40 days of the 2016 Chunyun Period, the Chinese intercity transportation network is extremely strained during this period.
The August 2010 China National Highway 110 traffic jam in Hebei province caught media attention for its severity, stretching more than 100 kilometres (62 mi) from August 14 to the 26, including at least 11 days of total gridlock.[72][73][74] The event was caused by a combination of road works and thousands of coal trucks from Inner Mongolia’s coalfields that travel daily to Beijing. The New York Times has called this event the "Great Chinese Gridlock of 2010."[74][75] The congestion is regarded as the worst in history by duration, and is one of the longest in length after the 175 kilometres (109 mi) long Lyon-Paris traffic jam in France in February 16, 1980.
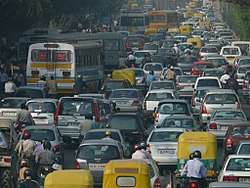
India

The number of vehicles in India is quickly increasing as a growing middle class can now afford to buy cars. India's road conditions have not kept up with the increase in vehicle numbers. As a result, India has launched various rapid transit efforts, such as the Kolkata Metro, in Kolkata, and the Rapid Metro, in Gurgaon.
Various causes for this include:
- Private encroachments
- Commercial / religious establishment's location hampering road expansion, and rampant lobbying for this
- Unscientific road design
- Lack of free ways / exit ways where local roads and main roads intersect
- Lack of demarcated footpaths
- Lack of bus bays
- Lack of cycle tracks
- Lack of coordination among various government departments (e.g. digging of roads by telecom/water department and leaving it open)
Indonesia
According to a 2015 study by motor oil company Castrol, Jakarta is found to be the worst city in the world for traffic congestion. Relying on information from TomTom navigation devices in 78 countries, the index found that drivers are stopping and starting their cars 33,240 times per year on the road. After Jakarta, the worst cities for traffic are Istanbul, Mexico City, Surabaya, and St. Petersburg.[76]
Daily congestion in Jakarta is not a recent problem. The expansion of commercial area shows worsening daily congestion in Jalan Jendral Sudirman, Jalan Thamrin, and Jalan Gajah Mada in mid 1970s.[77]
In 2016, 12 people died as a result of traffic congestion in Java. They were among those stuck in a three-day traffic jam at an intersection in Java called 'Brexit'. The traffic block stretched for 21 km here and thousands of cars clogged the highway. Many people died because of carbon monoxide poisoning, fatigue or heat.[78]
New Zealand
New Zealand has followed strongly car-oriented transport policies since after World War II (especially in Auckland, where one third of the country's population lives, is New Zealand's most traffic congested city, and has been labelled worse than New York for traffic congestion with commuters sitting in traffic congestion for 95 hours per year),[79] and currently has one of the highest car-ownership rates per capita in the world, after the United States.[80] Traffic congestion in New Zealand is increasing with drivers on New Zealand's motorways reported to be struggling to exceed 20 kph on an average commute, sometimes crawling along at 8 kph for more than half an hour.
Philippines
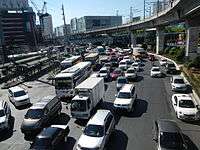
.JPG)
According to a survey by Waze, traffic congestion in Metro Manila is called the "worst" in the world, after Rio de Janeiro, São Paulo, and Jakarta.[81] It is worsened by violations of traffic laws, like illegal parking, loading and unloading, beating the red light, and wrong-way driving.[82] Traffic congestion in Metro Manila is caused by the large number of registered vehicles, lack of roads, and overpopulation, especially on Manila, Pateros and Caloocan.[83] Traffic caused losses of ₱137,500,000,000 on the economy in 2011, and unbuilt roads and railway projects also causes worsening congestion.[84] The Japan International Cooperation Agency (JICA) feared that daily economic losses will reach Php 6,000,000,000 by 2030 if traffic congestion cannot be controlled.[85]
Turkey
In recent years, the Istanbul Metropolitan Municipality has made huge investments on intelligent transportation systems and public transportation. Despite that, traffic is a significant problem in İstanbul. İstanbul has chosen the second most congested[86] and the most sudden-stopping traffic in the world.[87] Travel times in Turkey’s largest city take on average 55 percent longer that they should, even in relatively less busy hours.[88]
United Kingdom
In the United Kingdom the inevitability of congestion in some urban road networks has been officially recognized since the Department for Transport set down policies based on the report Traffic in Towns in 1963:
Even when everything that it is possibly to do by way of building new roads and expanding public transport has been done, there would still be, in the absence of deliberate limitation, more cars trying to move into, or within our cities than could possibly be accommodated.[89]

The Department for Transport sees growing congestion as one of the most serious transport problems facing the UK.[90] On 1 December 2006, Rod Eddington published a UK government-sponsored report into the future of Britain's transport infrastructure. The Eddington Transport Study set out the case for action to improve road and rail networks, as a "crucial enabler of sustained productivity and competitiveness". Eddington has estimated that congestion may cost the economy of England £22 bn a year in lost time by 2025. He warned that roads were in serious danger of becoming so congested that the economy would suffer.[91] At the launch of the report Eddington told journalists and transport industry representatives introducing road pricing to encourage drivers to drive less was an "economic no-brainer". There was, he said "no attractive alternative". It would allegedly cut congestion by half by 2025, and bring benefits to the British economy totalling £28 bn a year.[92]
A congestion charge for driving in central London was introduced in 2003. In 2013, ten years later, Transport for London reported that the scheme resulted in a 10% reduction in traffic volumes from baseline conditions, and an overall reduction of 11% in vehicle kilometres in London. Despite these gains, traffic speeds in central London became progressively slower.
United States
The Texas Transportation Institute estimated that, in 2000, the 75 largest metropolitan areas experienced 3.6 billion vehicle-hours of delay, resulting in 5.7 billion U.S. gallons (21.6 billion liters) in wasted fuel and $67.5 billion in lost productivity, or about 0.7% of the nation's GDP. It also estimated that the annual cost of congestion for each driver was approximately $1,000 in very large cities and $200 in small cities. Traffic congestion is increasing in major cities and delays are becoming more frequent in smaller cities and rural areas.
30% of traffic is cars looking for parking.[93]
According to traffic analysis firm INRIX in 2013,[94] the top 65 worst US traffic congested cities (measured in average hours wasted per vehicle for the year) were:
- Los Angeles, California: 64.4 hours
- Honolulu, Hawaii: 59.5 hours
- San Francisco, California: 56.1 hours
- New York, New York: 52.9 hours
- Bridgeport, Connecticut: 42.1 hours
- Austin, Texas: 41.2 hours
- Houston, Texas: 40.6 hours
- Washington, D.C.: 40.3 hours
- Boston, Massachusetts: 37.9 hours
- Seattle, Washington: 37.1 hours
- San Jose, California: 34.7 hours
- Chicago, Illinois: 34.2 hours
- Dallas, Texas: 33.5 hours
- El Paso, Texas: 32.6 hours
- Denver, Colorado: 31.7 hours
- New Haven, Connecticut: 31.2 hours
- Fort Worth, Texas: 30.6 hours
- Albuquerque, New Mexico: 29.3 hours
- Detroit, Michigan: 28.5 hours
- Colorado Springs, Colorado: 26.8 hours
- St. Louis, Missouri: 25.6 hours
- Indianapolis, Indiana: 24.9 hours
- Baltimore, Maryland: 23.4 hours
- Las Vegas, Nevada: 22.1 hours
- Salt Lake City, Utah: 21.9 hours
- Lubbock, Texas: 21.5 hours
- Provo, Utah: 21.2 hours
- Aurora, Colorado: 20.7 hours
- New Orleans, Louisiana: 20.2 hours
- Arlington, Texas: 19.8 hours
- Hartford, Connecticut: 19.6 hours
- Miami, Florida: 19.5 hours
- Tampa, Florida: 19.4 hours
- Daytona Beach, Florida: 19.2 hours
- Boise, Idaho: 18.7 hours
- Rio Rancho, New Mexico: 18.4 hours
- Wichita, Kansas: 18.1 hours
- Mobile, Alabama: 17.6 hours;
- Fort Collins, Colorado: 16.9 hour
- Kansas City, Missouri: 16.7 hours
- Columbia, Missouri: 16.3 hours
- Abilene, Texas: 16.1 hours
- Sacramento, California: 15.8 hours
- Midland, Texas: 15.4 hours
- Westminster, Colorado: 14.7 hours
- Plano, Texas: 14.5 hours
- Temple, Texas: 14.2 hours
- Loveland, Colorado: 13.8 hours
- Amarillo, Texas: 13.2 hours
- Odessa, Texas: 12.8 hours
- San Antonio, Texas: 12.7 hours
- Galveston, Texas: 12.6 hours
- Golden, Colorado: 12.3 hours
- Greeley, Colorado: 11.8 hours
- Santa Barbara, California: 11.6 hours
- Anchorage, Alaska: 10.9 hours
- Olympia, Washington: 10.7 hours
- Harrisburg, Pennsylvania: 10.6 hours
- Columbus, Ohio: 10.4 hours
- Portland, Oregon: 10.2 hours
- Redding, California: 9.8 hours
- Frederick, Maryland: 9.7 hours
- Castle Rock, Colorado: 9.6 hours
- Frisco, Texas: 9.4 hour
- Trenton, New Jersey: 9.3 hours
The most congested highway in the United States, according to a 2010 study of freight congestion (truck speed and travel time), is Chicago's Interstate 290 at the Circle Interchange. The average truck speed was just 29 mph (47 km/h).[95]
See also
References
- 1 2 Andrew Downie (2008-04-21). "The World's Worst Traffic Jams". Time. Retrieved 2008-06-20.
- ↑ "Congestion: A National Issue". 2008-08-29. Retrieved 2008-09-25.
- ↑ "Science Hobbyist: Traffic Waves".
- ↑ "Transportation Report By USCB".
- ↑ Critical Mass – Ball, Philip, ISBN 0-09-945786-5
- ↑ "Mathematicians Take Aim At 'Phantom' Traffic Jams". ScienceDaily. Retrieved 5 October 2014.
- ↑ "Fundamental Law of Road Congestion: Evidence from U.S. Cities". journalistsresource.org.
- ↑ Duranton, Gilles; Turner, Matthew A. (2011). "The Fundamental Law of Road Congestion: Evidence from U.S. Cities". American Economic Review. 101 (6): 2616–52. doi:10.1257/aer.101.6.2616.
- ↑ Traffic Engineering, Third Edition. Roger P. Roess, Elana S. Prassas, and William R. McShane. ISBN 0-13-142471-8
- ↑ ""Road rage" meaning and origin, Phrases.org.uk". Retrieved 5 October 2014.
- ↑ "Gridlock woes: Traffic congestion by the numbers". Smart Cities Dive. Retrieved 2018-03-28.
- ↑ "Here's How Much Sitting In Traffic Is Costing You". Money. Retrieved 2018-03-28.
- ↑ "Home". newburghgazette.com. Retrieved 2018-03-28.
- ↑ "Here's How Much Traffic Congestion Costs the World's Biggest Cities". 2018-02-11. Retrieved 2018-03-28.
- ↑ Isla, Rouselle (2016-05-26). "Find Out What's The Cost of Traffic In Metro Manila". iMoney.ph. Retrieved 2018-03-28.
- ↑ "Traffic jam: The ugly side of Dhaka's development". The Daily Star. 2018-05-13. Retrieved 2018-05-14.
- ↑ Post, The Jakarta. "Jakarta foots US$5b annual bill for traffic jams: Minister". The Jakarta Post. Retrieved 2018-03-28.
- ↑ "Colossal loss". The Daily Star. 2018-03-25. Retrieved 2018-03-28.
- ↑ "Costs of Congestion". www.metrolinx.com. Retrieved 2018-03-28.
- ↑ "Congestion - Friend or Foe? - W R Blunden 1983". Retrieved 5 October 2014.
- ↑ "Maximum fares for metropolitan and outer metropolitan buses from January 2014 - Draft Report, p. 37, citing work by LECG "Value of Sydney bus externalities and optimal Government subsidy - Final report", September 2009, p. 17" (PDF). Retrieved 2018-07-12.
- ↑ British to help China build 'eco-cities' – The Observer, November 6, 2005
- ↑ "Wired, Pop-Up Cities: China Builds a Bright Green Metropolis, 04.24.07". Retrieved 5 October 2014.
- ↑ Dreaming of a Clean Car? Archived 2008-05-18 at the Wayback Machine. – Kay, Jane Holtz, journalist and author
- ↑ 2005 Mayors Luncheon (from the NAIOP website, Tampa Bay, United States)
- ↑ Hermann Knoflacher (2006). "A new way to organize parking: the key to a successful sustainable transport system for the future". Environment and Urbanization. International Institute for Environment and Development. 18 (2): 387–400. doi:10.1177/0956247806069621.
- ↑ Shoup, Donald C. (2005). The High Cost of Free Parking. American Planning Association. ISBN 1-884829-98-8.
- ↑ Knoflacher, Hermann (January 2001) [2001]. Stehzeuge. Der Stau ist kein Verkehrsproblem (in German). Vienna: Böhlau. ISBN 978-3-205-98988-2.
- ↑ Goddard, Haynes (July 1997). "Using Tradeable Permits to Achieve Sustainability in the World's Large Cities". Environmental and Resource Economics. Springer Netherlands. 10 (1): 63–99. doi:10.1023/A:1026444113237.
- ↑ The high cost of motoring in Singapore – Toh, Rex S., Business Horizons, Mar-April 1994
- ↑ "LEDA Measure: License plate based traffic restrictions, Athens, Greece". LEDA database. Archived from the original on 2008-02-27. Retrieved 2008-04-09.
- 1 2 "Regulatory restrictions". KonSULT, the Knowledgebase on Sustainable Urban Land use and Transport. Institute for Transport Studies, University of Leeds. Archived from the original on 2004-08-25. Retrieved 2008-04-20.
- ↑ Henley, Jon (2005-03-15). "Paris drive to cut traffic in centre by 75%". The Guardian. London: Guardian Media Group.
- ↑ Simon, Hermann; Robert J Dolan. "Price Customization". Marketing Management. American Marketing Association. 7 (3).
- ↑ Link, Heike (March 2004). "PEP-A Yield-Management Scheme for Rail Passenger Fares in Germany". Japan Railway & Transport Review. 38: 54.
- ↑ Andersen, Bjørn (January 1993). "A survey of the Swiss public transport system and policy". Transport Reviews. 13 (1): 61–81. doi:10.1080/01441649308716835.
- ↑ Adrian May (2007-03-16). "The philosophy and practice of Taktfahrplan: a case-study of the East Coast Main Line" (Working Paper). Working Paper 579. Institute of Transport Studies, University of Leeds, Leeds, UK. Retrieved 2008-04-27.
- ↑ Ogilvie, David; Matt Egan; Val Hamilton; Mark Petticrew (2004-09-22). "Promoting walking and cycling as an alternative to using cars: systematic review". British Medical Journal. BMJ Publishing Group. 329 (7469): 763. doi:10.1136/bmj.38216.714560.55. PMC 520994. PMID 15385407.
- ↑ Rietveld, Piet; Vanessa Daniel (August 2004). "Determinants of bicycle use: do municipal policies matter?". Transportation Research Part A: Policy and Practice. Elsevier. 38 (7): 531–550. doi:10.1016/j.tra.2004.05.003.
- ↑ "Cycling in the Netherlands" (PDF). Rijkswaterstaat (Dutch Ministry of Transport, Public Works and Water Management).
- ↑ Marinelli, P.A. Cleary, N. Worthington Eyre, H and Doonan, K. 2010. Flexible Workplaces: Achieving the worker’s paradise and transport planner’s dream in Brisbane, Proceedings of the 33rd Australasian Transport Research Forum, 29 September-1 October 2010, Canberra.
- ↑ Matt Rosenberg (2007-09-26). "Slow But Steady "Telework Revolution" Eyed". Cascadia Prospectus. Retrieved 2007-10-07.
- ↑ "Motoring Towards 2050 – Roads and Reality". RAC foundation. Archived from the original on 2009-01-20.
- ↑ "Smarter Choices – Changing the way we travel". Department for Transport.
- ↑ New & Innovative Concepts for Helping European Transport Sustainability. Niches Policy seminar. Committee of the Regions; Niches. December 2006.
- ↑ "Reducing delay due to traffic congestion". Social Impact Open Repository. Retrieved 2017-09-05.
- ↑ Highways Agency (2007-10-25). "M42 Active Traffic Management Results –First Six Months" (PDF). Department for Transport. Archived from the original (PDF) on 2008-03-06. Retrieved 2007-12-31.
- ↑ "Glossary". National Agenda for Motorcycle Safety. US Department of Transportation National Highway Traffic Safety Administration/Motorcycle Safety Foundation. Retrieved 2010-09-18
- ↑ "Define:Lane Splitting". Motorcycle Glossary.com. Archived from the original on January 6, 2009. Retrieved 2009-01-06
- ↑ "Gridlock and Traffic Congestion in Cities – Is This the Solution?". Go Supply Chain.
- ↑ Corruption in Plan Permission Process in RAJUK: A Study of Violations and Proposals August 2007
- ↑ "The Financial Express | Financial Online Newspaper". Thefinancialexpress-bd.com. Retrieved 2018-07-12.
- ↑ "Haphazard parking causes more traffic jams in Dhaka". Demotix. Archived from the original on 6 October 2014. Retrieved 5 October 2014.
- ↑ Two important behaviour changes for road safety: Tolerance and patience Ridwan Quaium. The Financial Express VOL 20 NO 207 REGD NO DA 1589 | Dhaka, Thursday July 26, 2012
- ↑ Md. Mirazul Islam (2011-08-14). "Traffic jam". The Daily Star. Retrieved 2012-05-05.
- 1 2 EFE (2014-05-23). "São Paulo sofre engarrafamento recorde de 344 quilômetros" [São Paulo suffers record traffic jam of 344 kilometers] (in Portuguese). UOL Economia. Retrieved 2014-05-25.
- ↑ "Kassab restringe carga e descarga em SP e inclui caminhões no rodízio" (in Portuguese). Folha de S.Paulo Online. 2008-04-01. Retrieved 2008-06-20.
- ↑ Folha de S.Paulo (2008-06-18). "Kassab cria rodízio para caminhão no centro" (in Portuguese). INTELOG. Retrieved 2008-06-20.
- ↑ Kalinowski, Tess (7 January 2010). "GTA commuter crawl gets slower". Toronto Star. Retrieved 23 December 2010.
- ↑ Kennedy, Brendan (7 January 2010). "GTA's worst routes: Highway 401". Toronto Star. Retrieved 23 December 2010.
- ↑ John Spears; Tess Kalinowski (30 March 2010). "Toronto commuting times worst of 19 major cities, study says". Toronto Star. Retrieved 23 December 2010.
- ↑ "The great crawl". The Economist. Retrieved 2018-01-07.
- ↑ "To Tackle Traffic Jam, Beijing Sets New Car Plate Quota, Limits Out-of-Towners". ChinaAutoWeb.com.
- ↑ 相镔. "Beijing takes aim at congestion, pollution with new car limits- China.org.cn". www.china.org.cn. Retrieved 2018-06-22.
- ↑ "China's Nanjing city considers limiting issuance of car plates". Reuters. 2016-07-26. Retrieved 2018-01-07.
- ↑ "4 Lessons from Beijing and Shanghai Show How China's Cities Can Curb Car Congestion | World Resources Institute". www.wri.org. Retrieved 2018-01-20.
- ↑ "In response to growth, Chinese cities choose metros". The Transport Politic. 2018-01-17. Retrieved 2018-01-20.
- ↑ "When all of China goes on vacation at once". CNN Travel. 2017-01-13. Retrieved 2018-01-07.
- ↑ "China's holiday rush begins early". 2009. Retrieved 2018-01-07.
- ↑ "Earth's biggest human migration on a map". CNN Travel. 2015-02-18. Retrieved 2018-01-07.
- ↑ "2017年春运发送旅客近30亿人次".
- ↑ Leo Hickman (2010-08-23). "Welcome to the world's worst traffic jam". The Guardian. Retrieved 2010-09-20.
- ↑ "The great crawl of China". The Economist. 2010-08-26. Retrieved 2010-09-20.
- 1 2 Michael Wines (2010-08-27). "China's Growth Leads to Problems Down the Road". New York Times. Retrieved 2010-09-20.
- ↑ Jonathan Watts (2010-08-24). "Gridlock is a way of life for Chinese". The Guardian. Retrieved 2010-09-20.
- ↑ Pantazi, Chloe (February 2, 2015). "The Worst Traffic In The World Is In..." Thrillist. Retrieved June 12, 2016.
- ↑ Merrillees, Scott (2015). Jakarta: Portraits of a Capital 1950-1980. Jakarta: Equinox Publishing. pp. 116–7. ISBN 9786028397308.
- ↑ "Twelve people die in traffic jam in Indonesia at junction called 'Brexit'". Agence France-Presse. 8 July 2016 – via The Guardian.
- ↑ Backtracking Auckland: Bureaucratic rationality and public preferences in transport planning Archived 2008-04-13 at the Wayback Machine. – Mees, Paul; Dodson, Jago; Urban Research Program Issues Paper 5, Griffith University, April 2006
- ↑ Modern Society (from Te Ara: The Encyclopedia of New Zealand. Accessed 2008-04-25.)
- ↑ Tan, Lara (October 2, 2015). "Metro Manila has 'worst traffic on earth', longest commute - Waze". CNN Philippines. Retrieved 17 January 2016.
- ↑ Liquicia, Chi. "Manila traffic: the agony, without the ecstasy". Latitude News. Retrieved 17 January 2016.
- ↑ "10 Alarming Facts about Traffic in Metro Manila that You Should Know". FAQ.ph. Retrieved 17 January 2016.
- ↑ Visconti, Katherine (September 26, 2012). "Traffic and infrastructure delays cost the Philippines". Rappler. Retrieved 17 January 2016.
- ↑ Dela Cruz, Chrisee (August 2, 2016). "DPWH chief Villar: Metro traffic jam 'can be solved in 2-3 years". Rappler. Retrieved August 7, 2016.
- ↑ "Archived copy" (PDF). Archived from the original (PDF) on 2013-12-07. Retrieved 2014-02-05.
- ↑ "'Dur-kalk'ta dünya lideri İstanbul". sabah.com.tr. 2 October 2013. Retrieved 5 October 2014.
- ↑ "Istanbul drowning in traffic chaos, report announces - LOCAL". Retrieved 5 October 2014.
- ↑ Traffic in Towns. Penguin Books in association with HMSO. 1963–1964. Para 30.
- ↑ "Tackling congestion on our roads". Department for Transport. Archived from the original on 2008-04-23.
- ↑ "Delivering choice and reliability". Department for Transport. Archived from the original on 2008-11-22.
- ↑ Rod Eddington (December 2006). "The Eddington Transport Study". UK Treasury. Archived from the original on 2008-03-24.
- ↑ http://shoup.bol.ucla.edu/CruisingForParkingAccess.pdf
- ↑ "Traffic Scorecard". INRIX. Retrieved October 23, 2014.
- ↑ "Table 3-9. Top 25 Freight Highway Locations by Freight Congestion Index Rating: 2010". U.S. Department of Transportation. 2011.
Further reading
- B.S. Kerner, Introduction to Modern Traffic Flow Theory and Control: The Long Road to Three-Phase Traffic Theory, Springer, Berlin, New York 2009
- B.S. Kerner, The Physics of Traffic, Springer, Berlin, New York 2004
- Koslowsky, Meni; Avraham N. Kluger; and Mordechai Reich. Commuting Stress, New York: Plenum, 1995.
- Koslowksky, Meni; Krausz, Moshe. "On the Relationship Between Commuting, Stress Symptoms, and Attitudinal Measures". Journal of Applied Behavioral Sciences. 1993: 485–92.
- Nagel, K.; Schreckenberg, M. (1992). "A Cellular Automaton Model for Freeway Traffic". Journal de Physique I. 2: 2221–2229. doi:10.1051/jp1:1992277.
- Victoria Transport Policy Institute (March 2013), Smart Congestion Relief – Comprehensive Analysis Of Traffic Congestion Costs and Congestion Reduction Benefits
- R. Wiedemann, Simulation des Straßenverkehrsflusses. Schriftenreihe des IfV, 8, 1974. Institut für Verkehrswesen. Universität Karlsruhe (in German).
External links
| Wikimedia Commons has media related to Traffic jam. |