Trafford Metropolitan Borough Council election, 2018
 | |||||||||||||||||||||||||||||||||||||||||||||||||||||||||||||||||||||||||||||
22 of 63 seats (One Third and one by-election) to Trafford Metropolitan Borough Council 32 seats needed for a majority | |||||||||||||||||||||||||||||||||||||||||||||||||||||||||||||||||||||||||||||
|---|---|---|---|---|---|---|---|---|---|---|---|---|---|---|---|---|---|---|---|---|---|---|---|---|---|---|---|---|---|---|---|---|---|---|---|---|---|---|---|---|---|---|---|---|---|---|---|---|---|---|---|---|---|---|---|---|---|---|---|---|---|---|---|---|---|---|---|---|---|---|---|---|---|---|---|---|---|
| |||||||||||||||||||||||||||||||||||||||||||||||||||||||||||||||||||||||||||||
 Map of results of 2018 election | |||||||||||||||||||||||||||||||||||||||||||||||||||||||||||||||||||||||||||||
| |||||||||||||||||||||||||||||||||||||||||||||||||||||||||||||||||||||||||||||
.jpg)
The 2018 Trafford Metropolitan Borough Council election to elect members of Trafford Metropolitan Borough Council in England took place on 3 May 2018.[1] This was on the same day as other local elections.
One third of the council stood for election, with each successful candidate serving a four-year term of office, expiring in 2022. The Conservative Party held overall control of the council going into the election but lost 5 seats, with Labour holding the larger number of councillors, meaning the council is now in no overall control.[1]
After the election, the composition of the council was:
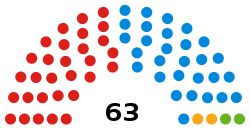
Trafford Council Composition 2018
| Party | Seats | +/- | |
|---|---|---|---|
| Labour | 30 | ||
| Conservative | 29 | ||
| Liberal Democrat | 2 | ||
| Green | 2 | ||
Election Results
Overall election result
Overall result compared with 2016.
| Trafford Metropolitan Borough Council election result, 2018 | |||||||||||||||
|---|---|---|---|---|---|---|---|---|---|---|---|---|---|---|---|
| Party | Candidates | Votes | |||||||||||||
| Stood | Elected | Gained | Unseated | Net | % of total | % | № | Net % | |||||||
| Labour | 22 | 13 | 4 | 0 | 61.9 | 47.2 | 34,523 | ||||||||
| Conservative | 22 | 7 | 1 | 6 | 33.3 | 36.8 | 26,884 | ||||||||
| Liberal Democrat | 22 | 0 | 0 | 1 | 0.0 | 7.3 | 5,318 | ||||||||
| Green | 22 | 2 | 2 | 0 | 4.8 | 6.6 | 4,817 | ||||||||
| UKIP | 13 | 0 | 0 | 0 | 0.0 | 1.4 | 1,011 | ||||||||
| Liberal | 2 | 0 | 0 | 0 | 0.0 | 0.5 | 391 | N/A | |||||||
| Independent | 2 | 0 | 0 | 0 | 0.0 | 0.2 | 165 | ||||||||
Ward Results
Asterisk denotes the sitting councillor.[1]
Altrincham
| Party | Candidate | Votes | % | ± | |
|---|---|---|---|---|---|
| Green | Daniel Jerrome [n 2] | 1,944 | 45.3 | ||
| Green | Geraldine Coggins [n 3] | 1,621 | – | – | |
| Conservative | Constantine Biller | 1,386 | 32.3 | ||
| Conservative | Angela Stone | 1,342 | – | – | |
| Labour | Stephane Savary | 846 | 19.7 | ||
| Labour | Barry Winstanley | 655 | – | – | |
| Liberal Democrat | Julian Newgrosh | 118 | 2.6 | ||
| Liberal Democrat | David Martin | 93 | – | – | |
| Majority | 558 | 13.0 | N/A | ||
| Registered electors | 8,892 | ||||
| Turnout | 46.5 | ||||
| Green gain from Conservative | Swing | ||||
| Green gain from Conservative | Swing | – | |||
Ashton upon Mersey
| Party | Candidate | Votes | % | ± | |
|---|---|---|---|---|---|
| Conservative | John Lamb* | 1,677 | 46.8 | ||
| Labour | Ben Hartley | 1,568 | 43.8 | ||
| Green | Caroline Robertson-Brown | 148 | 4.1 | ||
| Liberal Democrat | Stephen Power | 138 | 3.9 | ||
| UKIP | Kevin Grime | 53 | 1.5 | New | |
| Majority | 109 | 3.0 | |||
| Registered electors | 7,617 | ||||
| Turnout | 3,584 | 47.1 | |||
| Conservative hold | Swing | ||||
Bowdon
| Party | Candidate | Votes | % | ± | |
|---|---|---|---|---|---|
| Conservative | Karen Barclay* | 2,130 | 68.4 | ||
| Labour | Waseem Hassan | 422 | 13.5 | ||
| Liberal Democrat | Ludo Tolhurst-Cleaver | 356 | 11.4 | ||
| Green | Nigel Hennerley | 169 | 5.4 | ||
| UKIP | Jim Cook | 39 | 1.3 | ||
| Majority | 1,708 | 54.9 | |||
| Registered electors | 7,335 | ||||
| Turnout | 3,116 | 42.5 | |||
| Conservative hold | Swing | ||||
Broadheath ward
| Party | Candidate | Votes | % | ± | |
|---|---|---|---|---|---|
| Labour | Amy Whyte* | 2,077 | 49.3 | +3.3 | |
| Conservative | Kate Burke | 1,716 | 40.7 | -0.2 | |
| Liberal Democrat | Chris Marriott | 170 | 4.0 | -2.2 | |
| Green | Daniel Gresty | 160 | 3.8 | +2.0 | |
| UKIP | Mike Bayley-Sanderson | 56 | 1.3 | -0.8 | |
| Independent | Stephen Farndon | 33 | 0.8 | 0 | |
| Majority | 361 | 8.6 | +1.5 | ||
| Turnout | 4,212 | 42.6 | -1.7 | ||
| Labour hold | Swing | ||||
Brooklands ward
| Party | Candidate | Votes | % | ± | |
|---|---|---|---|---|---|
| Labour | Steven Longden | 1,939 | 47.6 | +10.8 | |
| Conservative | Mike Jefferson | 1,755 | 43.1 | -8.7 | |
| Liberal Democrat | Meenakshi Minnis | 170 | 4.2 | -4.2 | |
| Green | Mandy King | 155 | 3.8 | +0.9 | |
| UKIP | Tony Nayler | 55 | 1.4 | +1.4 | |
| Majority | 184 | 4.5 | |||
| Turnout | 4,074 | 52.0 | +7.8 | ||
| Labour gain from Conservative | Swing | ||||
Bucklow-St. Martins ward
| Party | Candidate | Votes | % | ± | |
|---|---|---|---|---|---|
| Labour | Adele New | 1,427 | 70.5 | +5.8 | |
| Conservative | Geoffrey Turner | 424 | 21.0 | -7.1 | |
| UKIP | Norine Napier | 90 | 4.4 | +0.4 | |
| Green | Rodrigo Capucho Paulo | 44 | 2.2 | +0.2 | |
| Liberal Democrat | Simon Wright | 38 | 1.9 | +0.8 | |
| Majority | 1,003 | 49.6 | +13.9 | ||
| Turnout | 2,023 | 28.5 | +6.5 | ||
| Labour hold | Swing | ||||
Clifford ward
| Party | Candidate | Votes | % | ± | |
|---|---|---|---|---|---|
| Labour | Sophie Taylor* | 2,702 | 84.3 | +4.7 | |
| Green | Jess Mayo | 255 | 8.0 | -3.8 | |
| Conservative | Alex Finney | 165 | 5.1 | -1.4 | |
| Liberal Democrat | Pauline Cliff | 82 | 2.6 | +0.5 | |
| Majority | 2,447 | 76.4 | +8.6 | ||
| Turnout | 3,204 | 39.3 | -1.0 | ||
| Labour hold | Swing | ||||
Davyhulme East ward
| Party | Candidate | Votes | % | ± | |
|---|---|---|---|---|---|
| Labour | Jayne Dillon | 2,205 | 57.5 | +19.7 | |
| Conservative | Mike Cornes* | 1,388 | 36.2 | -9.0 | |
| Green | Steven Tennant-Smythe | 100 | 2.6 | -1.5 | |
| Liberal Democrat | Sue Sutherland | 73 | 1.9 | -0.6 | |
| UKIP | Gary Regan | 69 | 1.8 | -8.6 | |
| Majority | 817 | 21.3 | |||
| Turnout | 3,835 | 49.5 | +7.6 | ||
| Labour gain from Conservative | Swing | ||||
Davyhulme West ward
| Party | Candidate | Votes | % | ± | |
|---|---|---|---|---|---|
| Labour | Graham Whitham | 2,230 | 57.5 | +23.3 | |
| Conservative | Christine Turner | 1,403 | 36.2 | -11.7 | |
| UKIP | Paul Regan | 96 | 2.6 | -10.1 | |
| Liberal Democrat | David Kierman | 81 | 2.2 | +0.2 | |
| Green | Rob Raikes | 71 | 1.9 | -1.3 | |
| Majority | 827 | 17 | |||
| Turnout | 3,881 | 50.5 | +9.4 | ||
| Labour gain from Conservative | Swing | ||||
Flixton ward
| Party | Candidate | Votes | % | ± | |
|---|---|---|---|---|---|
| Labour | Simon Thomas | 2,732 | 59.9 | +20.1 | |
| Conservative | Viv Ward* | 1,528 | 33.5 | -7.9 | |
| Green | Christine McLaughlin | 125 | 2.7 | -1.7 | |
| UKIP | Andrew Beaumont | 91 | 2.0 | -9.9 | |
| Liberal Democrat | Ian Sutherland | 84 | 1.8 | -0.7 | |
| Majority | 1,204 | 26.4 | +24.7 | ||
| Turnout | 4,560 | 55.0 | +10.9 | ||
| Labour gain from Conservative | Swing | ||||
Gorse Hill ward
| Party | Candidate | Votes | % | ± | |
|---|---|---|---|---|---|
| Labour | David Acton* | 2,039 | 73.0 | +7.1 | |
| Conservative | Lijo John | 485 | 17.4 | +0.9 | |
| Green | Joe Ryan | 115 | 4.1 | -1.4 | |
| Liberal Democrat | Dawn Carberry-Power | 88 | 3.2 | +0.8 | |
| UKIP | Seamus Martin | 66 | 2.4 | -7.4 | |
| Majority | 1,554 | 55.6 | |||
| Turnout | 2,793 | 33.5 | -1.0 | ||
| Labour hold | Swing | ||||
Hale Barns ward
| Party | Candidate | Votes | % | ± | |
|---|---|---|---|---|---|
| Conservative | Dylan Butt* | 1,932 | 66.8 | -3.1 | |
| Labour | Akilah Akinola | 477 | 16.5 | -1.0 | |
| Liberal Democrat | Maggie Boysen | 258 | 8.9 | +1.2 | |
| Independent | Sandra Taylor | 132 | 4.6 | +4.6 | |
| Green | Deborah Leftwich | 95 | 3.3 | -1.6 | |
| Majority | 1,455 | 50.3 | |||
| Turnout | 2,894 | 39.0 | -1.4 | ||
| Conservative hold | Swing | ||||
Hale Central ward
| Party | Candidate | Votes | % | ± | |
|---|---|---|---|---|---|
| Conservative | Alan Mitchell* | 1,604 | 53.6 | -4.5 | |
| Labour | Jill Axford | 809 | 27.0 | +2.4 | |
| Liberal Democrat | Will Frass | 364 | 12.2 | +2.2 | |
| Green | Stephen Leicester | 166 | 5.5 | -1.7 | |
| Liberal | Wayne Harrison | 49 | 1.6 | +1.6 | |
| Majority | 795 | 26.6 | |||
| Turnout | 2,992 | 40.3 | +1.6 | ||
| Conservative hold | Swing | ||||
Longford ward
| Party | Candidate | Votes | % | ± | |
|---|---|---|---|---|---|
| Labour | David Jarman* | 2,611 | 71.5 | +3.6 | |
| Conservative | Cathy Conchie | 547 | 15.0 | +0.7 | |
| Green | Margaret Westbrook | 238 | 6.5 | -2.7 | |
| Liberal Democrat | Anna Fryer | 194 | 5.3 | +3.0 | |
| UKIP | Pauline Royle | 60 | 1.6 | -4.7 | |
| Majority | 2,064 | 56.5 | |||
| Turnout | 3,650 | 40.1 | 0 | ||
| Labour hold | Swing | ||||
Priory ward
| Party | Candidate | Votes | % | ± | |
|---|---|---|---|---|---|
| Labour Co-op | Jane Baugh* | 2,018 | 60.3 | +5.3 | |
| Conservative | George Barker | 988 | 29.5 | +2.9 | |
| Green | Paul Greer | 170 | 5.1 | -0.1 | |
| Liberal Democrat | Michael MacDonald | 170 | 5.1 | -0.5 | |
| Majority | 1,030 | 30.8 | |||
| Turnout | 3,346 | 40.9 | +1.0 | ||
| Labour Co-op hold | Swing | ||||
Sale Moor ward
| Party | Candidate | Votes | % | ± | |
|---|---|---|---|---|---|
| Labour | Liz Patel | 1,433 | 51.7 | -4.0 | |
| Conservative | Darren Christopher Meacher | 971 | 35.0 | +2.5 | |
| Liberal Democrat | Czarina Kirk | 207 | 7.5 | +2.7 | |
| Green | Jane Leicester | 161 | 5.8 | -1.1 | |
| Majority | 462 | 16.7 | |||
| Turnout | 2,772 | 36.4 | -1.6 | ||
| Labour hold | Swing | ||||
St. Mary's ward
| Party | Candidate | Votes | % | ± | |
|---|---|---|---|---|---|
| Conservative | Rob Chilton* | 2,053 | 60.0 | +2.3 | |
| Labour | Mal Choudhury | 1,054 | 30.8 | -0.5 | |
| Liberal Democrat | Louise Bird | 167 | 4.9 | +0.1 | |
| Green | Nicholas Robertson-Brown | 149 | 4.4 | -1.7 | |
| Majority | 999 | 29.2 | +2.9 | ||
| Turnout | 3,423 | 39.9 | +2.3 | ||
| Conservative hold | Swing | ||||
Stretford ward
| Party | Candidate | Votes | % | ± | |
|---|---|---|---|---|---|
| Labour | Jane Slater | 2,231 | 71.5 | +4.9 | |
| Conservative | Shengke Zhi | 490 | 15.7 | -6.1 | |
| Green | Liz O'Neill | 211 | 6.8 | -1.5 | |
| Liberal Democrat | Simon Lepori | 98 | 3.1 | -0.2 | |
| UKIP | Ian Royle | 92 | 2.9 | +2.9 | |
| Majority | 1,741 | 55.8 | |||
| Turnout | 3,122 | 39.5 | -0.5 | ||
| Labour hold | Swing | ||||
Timperley ward
| Party | Candidate | Votes | % | ± | |
|---|---|---|---|---|---|
| Conservative | Nathan Evans* | 1,694 | 40.4 | +7.1 | |
| Liberal Democrat | William Jones | 1,329 | 31.7 | -20.4 | |
| Labour | Julia Garlick | 718 | 17.1 | +6.7 | |
| Liberal | Neil Taylor | 342 | 8.2 | +8.2 | |
| Green | Jadwiga Leigh | 113 | 2.7 | -1.4 | |
| Majority | 365 | 8.7 | |||
| Turnout | 4,196 | 49.6 | -0.6 | ||
| Conservative hold | Swing | ||||
Urmston ward
| Party | Candidate | Votes | % | ± | |
|---|---|---|---|---|---|
| Labour | Kevin Procter* | 2,243 | 57.8 | +9.9 | |
| Conservative | Michelle McGrath | 1,217 | 31.3 | -5.8 | |
| Green | Timothy Woodward | 155 | 4.0 | +0.2 | |
| UKIP | Krissy Douglas | 138 | 3.6 | -5.3 | |
| Liberal Democrat | Kirsty Cullen | 130 | 3.3 | +0.9 | |
| Majority | 1,026 | 26.4 | |||
| Turnout | 3,883 | 45.3 | -1.4 | ||
| Labour hold | Swing | ||||
Village ward
| Party | Candidate | Votes | % | ± | |
|---|---|---|---|---|---|
| Conservative | Thomas Carey | 1,331 | 40.8 | +8.7 | |
| Liberal Democrat | Tony Fishwick* | 1,003 | 30.8 | -14.5 | |
| Labour | Tony O'Brien | 742 | 22.8 | +4.0 | |
| UKIP | Angela O'Neill | 106 | 3.3 | +3.3 | |
| Green | Matthew Westbrook | 78 | 2.4 | -1.4 | |
| Majority | 328 | 10.1 | |||
| Turnout | 3,260 | 41.2 | -2.2 | ||
| Conservative gain from Liberal Democrat | Swing | ||||
Notes
References
- 1 2 3 Staff writer (4 May 2018). "Local Election 2018 Results". trafford.gov.uk. Trafford MBC. Archived from the original on 5 May 2018. Retrieved 5 May 2018.
- ↑ "Local Election May 2018 results". Trafford Metropolitan Borough Council.
- ↑ "Trafford Metropolitan Borough Council Election 2018 Results". BBC News.
| Mayor | |
|---|---|
| Bolton | |
| Bury | |
| Manchester | |
| Oldham | |
| Rochdale | |
| Salford | |
| Stockport | |
| Tameside | |
| Trafford | |
| Wigan | |
| County Council |
|
| |
This article is issued from
Wikipedia.
The text is licensed under Creative Commons - Attribution - Sharealike.
Additional terms may apply for the media files.