Recognition of same-sex unions in Africa
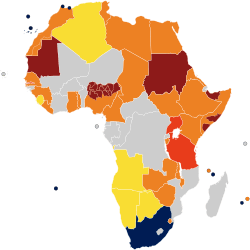
Same-sex sexual activity legal
Same-sex marriage
No recognition of same-sex couples
Same-sex sexual activity illegal
Not Enforced or unclear
Penalty
Life in prison
Death penalty
Debate has occurred throughout Africa over proposals to legalize same-sex marriage as well as civil unions.
Currently, South Africa is the only African country that legally recognizes same-sex marriage.[1]
Current situation
National level
| Status | Country | Legal since | Country population (Last Census count) |
|---|---|---|---|
| Marriage (1 country) |
2006 | 54,956,900 | |
| Subtotal | — | — | 54,956,900 (4.5% of the African population) |
| No recognition (46 countries) * same-sex sexual activity illegal | |||
| — | 40,400,000 | ||
| — | 25,789,024 | ||
| — | 10,872,298 | ||
| — | 2,250,260 | ||
| — | 23,439,189 | ||
| — | 539,560 | ||
| — | 4,594,621 | ||
| — | 13,670,084 | ||
| — | 795,601 | ||
| — | 942,333 | ||
| — | 96,474,100 | ||
| — | 1,221,490 | ||
| — | 4,954,645 | ||
| — | 102,403,196 | ||
| — | 1,979,786 | ||
| — | 2,051,363 | ||
| — | 27,043,093 | ||
| — | 12,395,924 | ||
| — | 1,815,698 | ||
| — | 23,740,424 | ||
| — | 2,203,821 | ||
| — | 4,503,000 | ||
| — | 6,293,253 | ||
| — | 24,894,551 | ||
| — | 18,091,575 | ||
| — | 14,517,176 | ||
| — | 4,301,018 | ||
| — | 1,262,132 | ||
| — | 33,848,242 | ||
| — | 28,829,476 | ||
| — | 2,113,077 | ||
| — | 20,672,987 | ||
| — | 185,989,640 | ||
| — | 5,125,821 | ||
| — | 199,910 | ||
| — | 15,411,614 | ||
| — | 94,228 | ||
| — | 7,075,641 | ||
| — | 14,317,996 | ||
| — | 12,230,730 | ||
| — | 1,343,098 | ||
| — | 55,572,201 | ||
| — | 7,965,055 | ||
| — | 11,304,482 | ||
| — | 16,591,390 | ||
| Subtotal | — | — | 892,132,983 (73.2% of the African population) |
| Constitutional ban on marriage ( 8 countries) * same-sex sexual activity illegal |
— | 20,107,509 | |
| — | 10,524,117 | ||
| — | 78,736,153 | ||
| — | 49,125,325 | ||
| — | 11,262,564 | ||
| — | 39,578,828 | ||
| — | 41,487,965 | ||
| — | 16,150,362 | ||
| Subtotal | — | — | 266,972,823 (21.9% of the African population) |
| Total | — | — | 1,214,062,706 (99.6% of the African population) |
Partially-recognized and unrecognized states
| Status | Country | Since | State population (Last estimate count) |
|---|---|---|---|
| No recognition (2 state) |
— | 100,000 | |
| — | 3,508,180 | ||
| Subtotal | — | — | 3,608,180 (0.3% of the African population) |
| Total | — | — | 3,608,180 (0.3% of the African population) |
Sub-national level
| Status | Country | Jurisdiction | Legal since | Jurisdiction population (Last Census count) |
|---|---|---|---|---|
| Marriage (9 jurisdictions) |
2013 | — | ||
| 2013 | 256,518 | |||
| 2013 | 865,826 | |||
| 2010 | 289,000 | |||
| 2005 | 2,101,924 | |||
| 2005 | 82,376 | |||
| 2005 | 78,476 | |||
| 2014 | 2,500 | |||
| 2017 | 5,633 | |||
| Subtotal | — | — | — | 3,682,253 (0.3% of the African population) |
| Total | — | — | — | 3,682,253 (0.3% of the African population) |
Future legislation
Marriage
![]()
See also
References
This article is issued from
Wikipedia.
The text is licensed under Creative Commons - Attribution - Sharealike.
Additional terms may apply for the media files.