Provencher
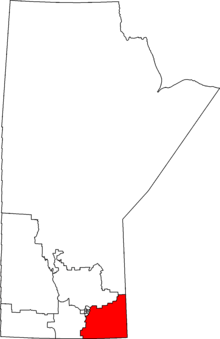 Provencher in relation to other Manitoba federal electoral districts as of the 2013 Representation Order. | |||
| Federal electoral district | |||
| Legislature | House of Commons | ||
| MP |
Conservative | ||
| District created | 1871 | ||
| First contested | 1871 | ||
| Last contested | 2015 | ||
| District webpage | profile, map | ||
| Demographics | |||
| Population (2011)[1] | 88,640 | ||
| Electors (2015) | 63,356 | ||
| Area (km²)[1] | 18,773 | ||
| Pop. density (per km²) | 4.7 | ||
| Census divisions | Division No. 1, Division No. 2, Division No. 3, Division No. 12, Division No. 19 | ||
| Census subdivisions | Alexander, Buffalo Point 36, De Salaberry, Division No. 1, Unorganized, Division No. 19, Unorganized, Emerson, Franklin, Hanover, La Broquerie, Lac du Bonet (RM), Lac du Bonnet (town), Montcalm, Morris (town), Morris (RM), Niverville, Pinawa, Piney, Powerview-Pine Falls, Reynolds, Ritchot, Roseau River 2, Roseau Rapids 2A, Shoal Lake (Part) 40, Springfield, Ste. Anne (RM), Ste. Anne (town), Steinbach, St-Pierre-Jolys, Stuartburn, Taché | ||
Provencher is a federal electoral district in Manitoba, Canada, that has been represented in the House of Commons of Canada since 1871. It is primarily a rural district. Its largest community is the city of Steinbach.
Geography
The district is in the most southeastern part of Manitoba.
Demographics
- According to the Canada 2011 Census
Ethnic groups: 85.3% White, 12.3% Aboriginal
Languages: 67.7% English, 17.3% German, 10.5% French, 1.2% Russian, 1.1% Ukrainian
Religions: 79.6% Christian (35.8% "Other Christian", 23.6% Catholic, 6.3% United Church, 4.8% Lutheran, 2.5% Anglican, 2.2% Baptist), 19.5% None.
Median income: $29,184 (2010)[2]
Average income: $36,186 (2010) [2]
History
The electoral district was created in 1871 after Manitoba joined the Canadian Confederation in 1870. It is notable for being the district that elected Louis Riel to the House of Commons.
The riding elected Liberal Party of Canada MPs from 1904–1957, but for the better part of the last half-century has been one of the more conservative ridings in Manitoba and all of Canada. Nevertheless, the riding has fallen to the Liberals at high-tide elections, such as from 1968–1972 and 1993–2000.
This riding lost territory to Selkirk—Interlake—Eastman and Portage—Lisgar, and gained territory from Selkirk—Interlake during the 2012 electoral redistribution.
Members of Parliament
This riding has elected the following Members of Parliament:
Election results
| Canadian federal election, 2015 | ||||||||
|---|---|---|---|---|---|---|---|---|
| Party | Candidate | Votes | % | ±% | Expenditures | |||
| Conservative | Ted Falk | 25,086 | 56.06 | -14.30 | $116,699.56 | |||
| Liberal | Terry Hayward | 15,509 | 34.66 | +27.93 | $28,135.06 | |||
| New Democratic | Les Lilley | 2,371 | 5.30 | -12.87 | $4,287.04 | |||
| Green | Jeff Wheeldon | 1,779 | 3.98 | +1.01 | $6,485.90 | |||
| Total valid votes/Expense limit | 44,745 | 100.00 | $216,321.86 | |||||
| Total rejected ballots | 169 | 0.38 | ||||||
| Turnout | 44,914 | 69.53 | ||||||
| Eligible voters | 64,598 | |||||||
| Conservative hold | Swing | -21.11 | ||||||
| Source: Elections Canada[3][4] | ||||||||
| Canadian federal by-election, November 25, 2013 | ||||||||
|---|---|---|---|---|---|---|---|---|
| Party | Candidate | Votes | % | ±% | Expenditures | |||
| Conservative | Ted Falk | 13,046 | 58.20 | −12.40 | $ 83,542.19 | |||
| Liberal | Terry Hayward | 6,711 | 29.94 | +23.23 | 66,455.27 | |||
| New Democratic | Natalie Courcelles Beaudry | 1,843 | 8.22 | −9.67 | 17,878.16 | |||
| Green | Janine Gibson | 817 | 3.64 | +0.69 | 1,074.97 | |||
| Total valid votes/Expense limit | 22,417 | 100.0 | – | $ 97,453.98 | ||||
| Total rejected ballots | 136 | 0.60 | +0.17 | |||||
| Turnout | 22,553 | 33.85 | −27.88 | |||||
| Eligible voters | 66,624 | |||||||
| Conservative hold | Swing | −17.86 | ||||||
| By-election due to the resignation of Vic Toews. | ||||||||
Source(s)
"November 25, 2013 By-elections". Elections Canada. November 26, 2013. Retrieved December 14, 2013.
"November 25, 2013 By-election – Financial Reports". Retrieved October 29, 2014. | ||||||||
Minister of Public Safety Vic Toews resigned from cabinet and as an MP, effective July 9, 2013, to spend more time with his family and join the private sector.[5]
| 2011 federal election redistributed results[6] | |||
|---|---|---|---|
| Party | Vote | % | |
| Conservative | 24,628 | 70.36 | |
| New Democratic | 6,358 | 18.16 | |
| Liberal | 2,355 | 6.73 | |
| Green | 1,039 | 2.97 | |
| Others | 623 | 1.78 | |
| Canadian federal election, 2011 | ||||||||
|---|---|---|---|---|---|---|---|---|
| Party | Candidate | Votes | % | ±% | Expenditures | |||
| Conservative | Vic Toews | 27,820 | 70.60 | +5.95 | $70,719.84 | |||
| New Democratic | Al Mackling | 7,051 | 17.89 | +4.17 | $14,274.04 | |||
| Liberal | Terry Hayward | 2,645 | 6.71 | -5.86 | $25,938.56 | |||
| Green | Janine Gibson | 1,164 | 2.95 | -2.84 | $210.00 | |||
| Christian Heritage | David Reimer | 510 | 1.29 | -1.95 | $8,372.94 | |||
| Pirate | Ric Lim[7] | 215 | 0.55 | – | $393.24 | |||
| Total valid votes/Expense limit | 39,405 | 100.0 | – | $ 90,198.71 | ||||
| Total rejected ballots | 169 | 0.43 | -0.00 | |||||
| Turnout | 39,574 | 61.73 | +5.63 | |||||
| Eligible voters | 64,104 | |||||||
| Conservative hold | Swing | +0.89 | ||||||
| Canadian federal election, 2008 | ||||||||
|---|---|---|---|---|---|---|---|---|
| Party | Candidate | Votes | % | ±% | Expenditures | |||
| Conservative | Vic Toews | 23,303 | 64.65 | -1.03 | $67,419 | |||
| New Democratic | Ross Martin | 4,947 | 13.72 | +0.01 | $6,406 | |||
| Liberal | Shirley Hiebert | 4,531 | 12.57 | -3.27 | $16,369 | |||
| Green | Janine Gibson | 2,089 | 5.79 | +1.02 | $1,093 | |||
| Christian Heritage | David Reimer | 1,170 | 3.24 | – | $10,130 | |||
| Total valid votes/Expense limit | 36,040 | 100.0 | – | $87,213 | ||||
| Total rejected ballots | 156 | 0.43 | +0.02 | |||||
| Turnout | 36,196 | 58.01 | -7.04 | |||||
| Canadian federal election, 2006: Provencher | ||||||||
|---|---|---|---|---|---|---|---|---|
| Party | Candidate | Votes | % | ±% | Expenditures | |||
| Conservative | Vic Toews | 25,199 | 65.68 | +2.66 | $40,862.19 | |||
| Liberal | Wes Penner | 6,077 | 15.84 | −9.08 | $75,239.46 | |||
| New Democratic | Patrick O'Connor | 5,259 | 13.71 | +4.70 | $2,266.71 | |||
| Green | Janine Gibson | 1,830 | 4.77 | +1.72 | $87.31 | |||
| Total valid votes | 38,365 | 100.00 | ||||||
| Total rejected ballots | 157 | 0.41 | −0.02 | |||||
| Turnout | 38,522 | 65.05 | +5.38 | |||||
| Electors on the lists | 59,216 | |||||||
| Sources: Official Results, Elections Canada and Financial Returns, Elections Canada. | ||||||||
| Canadian federal election, 2004: Provencher | ||||||||
|---|---|---|---|---|---|---|---|---|
| Party | Candidate | Votes | % | ±% | Expenditures | |||
| Conservative | Vic Toews | 22,694 | 63.02 | +4.99 | $70,851.00 | |||
| Liberal | Peter Epp | 8,975 | 24.92 | −10.94 | $64,895.23 | |||
| New Democratic | Sarah Zaharia | 3,244 | 9.01 | +2.90 | $1,472.79 | |||
| Green | Janine Gibson | 1,100 | 3.05 | – | $480.59 | |||
| Total valid votes | 36,013 | 100.00 | ||||||
| Total rejected ballots | 155 | 0.43 | +0.07 | |||||
| Turnout | 36,168 | 59.67 | −10.36 | |||||
| Electors on the lists | 60,617 | |||||||
| Percentage change figures are factored for redistribution. Conservative Party percentages are contrasted with the combined Canadian Alliance and Progressive Conservative percentages from 2000. | ||||||||
| Sources: Official Results, Elections Canada and Financial Returns, Elections Canada. | ||||||||
Note: Conservative vote is compared to the total of the Canadian Alliance vote and Progressive Conservative vote in 2000 election.
| Canadian federal election, 2000: Provencher | ||||||||
|---|---|---|---|---|---|---|---|---|
| Party | Candidate | Votes | % | ±% | Expenditures | |||
| Alliance | Vic Toews | 21,358 | 52.76 | +17.68 | $65,896.75 | |||
| Liberal | David Iftody | 14,419 | 35.62 | −4.38 | $60,917.43 | |||
| Progressive Conservative | Henry C. Dyck | 2,726 | 6.73 | −9.59 | $7,780.05 | |||
| New Democratic | Peter Hiebert | 1,980 | 4.89 | −3.71 | $210.45 | |||
| Total valid votes | 40,483 | 100.00 | ||||||
| Total rejected ballots | 148 | 0.36 | −0.10 | |||||
| Turnout | 40,631 | 70.03 | +5.09 | |||||
| Electors on the lists | 58,020 | |||||||
| Sources: Official Results, Elections Canada and Financial Returns, Elections Canada. | ||||||||
Note: Canadian Alliance vote is compared to the Reform vote in 1997 election.
| Canadian federal election, 1997: Provencher | ||||||||
|---|---|---|---|---|---|---|---|---|
| Party | Candidate | Votes | % | ±% | Expenditures | |||
| Liberal | David Iftody | 14,595 | 40.00 | −0.82 | $61,072 | |||
| Reform | Larry Tardiff | 12,798 | 35.08 | −2.09 | $42,111 | |||
| Progressive Conservative | Clare Braun | 5,955 | 16.32 | +5.43 | $60,432 | |||
| New Democratic | Martha Wiebe Owen | 3,137 | 8.60 | +1.62 | $1,793 | |||
| Total valid votes | 36,485 | 100.00 | ||||||
| Total rejected ballots | 170 | 0.46 | +0.13 | |||||
| Turnout | 36,655 | 64.94 | −5.61 | |||||
| Electors on the lists | 56,442 | |||||||
| Percentage change figures are factored for redistribution. | ||||||||
| Sources: Official Results, Elections Canada and Financial Returns, Elections Canada. | ||||||||
| Canadian federal election, 1993: Provencher | ||||||||
|---|---|---|---|---|---|---|---|---|
| Party | Candidate | Votes | % | ±% | Expenditures | |||
| Liberal | David Iftody | 16,119 | 44.04 | +11.5 | $42,045 | |||
| Reform | Dean Whiteway | 13,463 | 36.78 | +33.1 | $49,513 | |||
| Progressive Conservative | Kelly Clark | 3,765 | 10.29 | −45.2 | $48,359 | |||
| New Democratic | Martha Wiebe Owen | 1,818 | 4.97 | −2.3 | $7,277 | |||
| National | Wes Penner | 1,212 | 3.3 | $23,719 | ||||
| Natural Law | Corrine Ayotte | 157 | 0.43 | +0.1 | $12 | |||
| Canada Party | Ted Bezan | 69 | 0.19 | – | $0 | |||
| Total valid votes | 36,603 | 100.00 | ||||||
| Total rejected ballots | 126 | 0.34 | +0.0 | |||||
| Turnout | 36,729 | 69.52 | −1.4 | |||||
| Electors on the lists | 52,835 | |||||||
| Source: Thirty-fifth General Election, 1993: Official Voting Results, Published by the Chief Electoral Officer of Canada. Financial figures taken from official contributions and expenses provided by Elections Canada. | ||||||||
| Canadian federal election, 1988: Provencher | ||||||||
|---|---|---|---|---|---|---|---|---|
| Party | Candidate | Votes | % | ±% | ||||
| Progressive Conservative | Jake Epp | 19,000 | 55.5 | −2.7 | ||||
| Liberal | Wes Penner | 11,121 | 32.5 | +12.4 | ||||
| New Democratic | Mary Sabovitch | 2,490 | 7.3 | −6.8 | ||||
| Reform | Lawrence Feilberg | 1,246 | 3.6 | – | ||||
| Confederation of Regions | John Wiebe | 357 | 1.0 | −5.8 | ||||
| Total valid votes | 34,214 | 100.0 | ||||||
| Total rejected ballots | 106 | 0.3 | ||||||
| Turnout | 34,320 | 70.9 | ||||||
| Electors on the lists | 48,385 | |||||||
| Canadian federal election, 1984 | ||||||||
|---|---|---|---|---|---|---|---|---|
| Party | Candidate | Votes | % | ±% | ||||
| Progressive Conservative | Jake Epp | 20,077 | 58.3 | +13.3 | ||||
| New Democratic | Ron Buzahora | 6,941 | 20.1 | -8.3 | ||||
| Liberal | Wally Rempel | 4,859 | 14.1 | -11.2 | ||||
| Confederation of Regions | Ron Bowers | 2,347 | 6.8 | – | ||||
| Libertarian | Donald Ives | 232 | 0.7 | – | ||||
| Total valid votes | 34,456 | 100.0 | ||||||
| Canadian federal election, 1980 | ||||||||
|---|---|---|---|---|---|---|---|---|
| Party | Candidate | Votes | % | ±% | ||||
| Progressive Conservative | Jake Epp | 14,677 | 44.9 | -6.7 | ||||
| New Democratic | Richard Rattai | 9,281 | 28.4 | +2.7 | ||||
| Liberal | Clare Cremer | 8,271 | 25.3 | +2.7 | ||||
| Rhinoceros | Lawrence Feilberg | 433 | 1.3 | – | ||||
| Total valid votes | 32,662 | 100.0 | ||||||
| Canadian federal election, 1979 | ||||||||
|---|---|---|---|---|---|---|---|---|
| Party | Candidate | Votes | % | ±% | ||||
| Progressive Conservative | Jake Epp | 17,030 | 51.7 | -3.1 | ||||
| New Democratic | Richard C. Greenway | 8,473 | 25.7 | +5.7 | ||||
| Liberal | Howard Loewen | 7,459 | 22.6 | -0.1 | ||||
| Total valid votes | 32,962 | 100.0 | ||||||
| Canadian federal election, 1974 | ||||||||
|---|---|---|---|---|---|---|---|---|
| Party | Candidate | Votes | % | ±% | ||||
| Progressive Conservative | Jake Epp | 13,405 | 54.8 | +9.4 | ||||
| Liberal | Tom Copeland | 5,558 | 22.7 | -3.4 | ||||
| New Democratic | Jack Feely | 4,907 | 20.0 | -5.3 | ||||
| Social Credit | Jake Wall | 613 | 2.5 | -0.7 | ||||
| Total valid votes | 24,483 | 100.0 | ||||||
| Canadian federal election, 1972 | ||||||||
|---|---|---|---|---|---|---|---|---|
| Party | Candidate | Votes | % | ±% | ||||
| Progressive Conservative | Jake Epp | 11,262 | 45.3 | +9.4 | ||||
| Liberal | Mark Smerchanski | 6,489 | 26.1 | -15.5 | ||||
| New Democratic | Alf Chorney | 6,304 | 25.4 | +11.2 | ||||
| Social Credit | Jake Wall | 784 | 3.2 | -5.0 | ||||
| Total valid votes | 24,839 | 100.0 | ||||||
| Canadian federal election, 1968 | ||||||||
|---|---|---|---|---|---|---|---|---|
| Party | Candidate | Votes | % | ±% | ||||
| Liberal | Mark Smerchanski | 9,021 | 41.6 | +2.7 | ||||
| Progressive Conservative | Warner Jorgenson | 7,791 | 36.0 | -12.1 | ||||
| New Democratic | Harry Blake-Knox | 3,078 | 14.2 | +10.2 | ||||
| Social Credit | Lorne Reznowski | 1,773 | 8.2 | -0.7 | ||||
| Total valid votes | 21,663 | 100.0 | ||||||
| Canadian federal election, 1965 | ||||||||
|---|---|---|---|---|---|---|---|---|
| Party | Candidate | Votes | % | ±% | ||||
| Progressive Conservative | Warner Jorgenson | 6,470 | 48.1 | +2.0 | ||||
| Liberal | Gordon Barkman | 5,243 | 39.0 | +2.3 | ||||
| Social Credit | Wilbert J. Tinkler | 1,195 | 8.9 | -8.3 | ||||
| New Democratic | Francis Clement Anderson | 542 | 4.0 | – | ||||
| Total valid votes | 13,450 | 100.0 | ||||||
| Canadian federal election, 1963 | ||||||||
|---|---|---|---|---|---|---|---|---|
| Party | Candidate | Votes | % | ±% | ||||
| Progressive Conservative | Warner Jorgenson | 6,729 | 46.1 | +2.6 | ||||
| Liberal | Stan C. Roberts | 5,351 | 36.7 | -0.4 | ||||
| Social Credit | Elie J. Dorge | 2,512 | 17.2 | -0.3 | ||||
| Total valid votes | 14,592 | 100.0 | ||||||
| Canadian federal election, 1962 | ||||||||
|---|---|---|---|---|---|---|---|---|
| Party | Candidate | Votes | % | ±% | ||||
| Progressive Conservative | Warner Jorgenson | 6,214 | 43.5 | -11.0 | ||||
| Liberal | Stan C. Roberts | 5,290 | 37.1 | +2.4 | ||||
| Social Credit | John P. Loewen | 2,504 | 17.5 | +8.6 | ||||
| New Democratic | Peter Kruszelnicki | 263 | 1.8 | 0.0 | ||||
| Total valid votes | 14,271 | 100.0 | ||||||
Note: NDP vote is compared to CCF vote in 1958 election.
| Canadian federal election, 1958 | ||||||||
|---|---|---|---|---|---|---|---|---|
| Party | Candidate | Votes | % | ±% | ||||
| Progressive Conservative | Warner Jorgenson | 8,278 | 54.5 | +19.3 | ||||
| Liberal | René Préfontaine | 5,268 | 34.7 | +1.3 | ||||
| Social Credit | Wilbert James Tinkler | 1,363 | 9.0 | -20.7 | ||||
| Co-operative Commonwealth | Jacob John Siemens | 281 | 1.8 | 0.0 | ||||
| Total valid votes | 15,190 | 100.0 | ||||||
| Canadian federal election, 1957 | ||||||||
|---|---|---|---|---|---|---|---|---|
| Party | Candidate | Votes | % | ±% | ||||
| Progressive Conservative | Warner Jorgenson | 4,739 | 35.2 | +13.8 | ||||
| Liberal | René Jutras | 4,489 | 33.3 | -32.6 | ||||
| Social Credit | Hugh M. Campbell | 3,992 | 29.6 | +17.0 | ||||
| Co-operative Commonwealth | Charles Biesick | 246 | 1.8 | – | ||||
| Total valid votes | 13,466 | 100.0 | ||||||
| Canadian federal election, 1953 | ||||||||
|---|---|---|---|---|---|---|---|---|
| Party | Candidate | Votes | % | ±% | ||||
| Liberal | René Jutras | 6,632 | 66.0 | +2.9 | ||||
| Progressive Conservative | Abram J. Thiessen | 2,151 | 21.4 | – | ||||
| Social Credit | Wilbert Tinkler | 1,269 | 12.6 | – | ||||
| Total valid votes | 10,052 | 100.0 | ||||||
| Canadian federal election, 1949 | ||||||||
|---|---|---|---|---|---|---|---|---|
| Party | Candidate | Votes | % | ±% | ||||
| Liberal | René Jutras | 6,834 | 63.0 | +23.3 | ||||
| Independent | Bruce MacKenzie | 4,008 | 37.0 | – | ||||
| Total valid votes | 10,842 | 100.0 | ||||||
| Canadian federal election, 1945 | ||||||||
|---|---|---|---|---|---|---|---|---|
| Party | Candidate | Votes | % | ±% | ||||
| Liberal | René Jutras | 4,541 | 39.7 | +8.9 | ||||
| Independent | Leo Arthur Slater | 2,220 | 19.4 | -7.8 | ||||
| Social Credit | Paul Prince | 1,940 | 17.0 | +10.1 | ||||
| Co-operative Commonwealth | Alexander Duncan Miller | 1,838 | 16.1 | +9.2 | ||||
| Progressive Conservative | Dalton Madill Boyd | 894 | 7.8 | -4.0 | ||||
| Total valid votes | 11,433 | 100.0 | ||||||
Note: Progressive Conservative vote is compared to "National Government" vote in 1940 election. Social Credit vote is compared to New Democracy vote in 1940 election.
| Canadian federal election, 1940 | ||||||||
|---|---|---|---|---|---|---|---|---|
| Party | Candidate | Votes | % | ±% | ||||
| Liberal | René Jutras | 3,768 | 30.8 | -31.9 | ||||
| Independent | Leo A. Slater | 3,329 | 27.2 | – | ||||
| Independent | Harry Matthew Podolsky | 1,765 | 14.4 | – | ||||
| National Government | William Richard Johnston | 1,441 | 11.8 | -25.5 | ||||
| New Democracy | Albert Banville | 1,099 | 9.0 | – | ||||
| Co-operative Commonwealth | Évariste Rupert Gagnon | 841 | 6.9 | – | ||||
| Total valid votes | 12,243 | 100.0 | ||||||
Note: "National Government" vote is compared to Conservative vote in 1935 election.
| Canadian federal election, 1935 | ||||||||
|---|---|---|---|---|---|---|---|---|
| Party | Candidate | Votes | % | ±% | ||||
| Liberal | Arthur-Lucien Beaubien | 6,308 | 62.7 | +4.8 | ||||
| Conservative | Philippe Bourgeois | 3,751 | 37.3 | +8.4 | ||||
| Total valid votes | 10,059 | 100.0 | ||||||
| Canadian federal election, 1930 | ||||||||
|---|---|---|---|---|---|---|---|---|
| Party | Candidate | Votes | % | |||||
| Liberal–Progressive | Arthur-Lucien Beaubien | 4,562 | 58.0 | |||||
| Conservative | Joseph-Arthur Belanger | 2,274 | 28.9 | |||||
| Independent Conservative | Wasyl Kobzar | 715 | 9.1 | |||||
| Liberal | Alexandre Ayotte | 321 | 4.1 | |||||
| Total valid votes | 7,872 | 100.0 | ||||||
| Canadian federal election, 1926 | ||||||||
|---|---|---|---|---|---|---|---|---|
| Party | Candidate | Votes | ||||||
| Liberal–Progressive | Arthur-Lucien Beaubien | acclaimed | ||||||
| Canadian federal election, 1925 | ||||||||
|---|---|---|---|---|---|---|---|---|
| Party | Candidate | Votes | % | |||||
| Progressive | Arthur-Lucien Beaubien | 2,736 | 50.7 | |||||
| Liberal | Edmond Comeault | 2,656 | 49.3 | |||||
| Total valid votes | 5,392 | 100.0 | ||||||
| Canadian federal election, 1921 | ||||||||
|---|---|---|---|---|---|---|---|---|
| Party | Candidate | Votes | % | |||||
| Liberal | Arthur-Lucien Beaubien | 3,189 | 46.9 | |||||
| Liberal | John P. Molloy | 2,177 | 32.0 | |||||
| Independent | Albert Préfontaine | 1,428 | 21.0 | |||||
| Total valid votes | 6,794 | 100.0 | ||||||
| Canadian federal election, 1917 | ||||||||
|---|---|---|---|---|---|---|---|---|
| Party | Candidate | Votes | % | ±% | ||||
| Opposition (Laurier Liberals) | John Patrick Molloy | 2,035 | 52.4 | -1.0 | ||||
| Government (Unionist) | John Robert Johns | 1,850 | 47.6 | 1.0 | ||||
| Total valid votes | 3,885 | 100.0 | ||||||
Note: Unionist vote is compared to Conservative vote in 1911 election.
| Canadian federal election, 1911 | ||||||||
|---|---|---|---|---|---|---|---|---|
| Party | Candidate | Votes | % | ±% | ||||
| Liberal | John Patrick Molloy | 3,049 | 53.3 | -1.3 | ||||
| Conservative | Joseph Alfred Féréol Bleau | 2,668 | 46.7 | +1.3 | ||||
| Total valid votes | 5,717 | 100.0 | ||||||
| Canadian federal election, 1908 | ||||||||
|---|---|---|---|---|---|---|---|---|
| Party | Candidate | Votes | % | ±% | ||||
| Liberal | John Patrick Molloy | 2,719 | 54.6 | +4.5 | ||||
| Conservative | Alphonse-Alfred-Clément Larivière | 2,259 | 45.4 | -4.5 | ||||
| Total valid votes | 4,978 | 100.0 | ||||||
| Canadian federal election, 1904 | ||||||||
|---|---|---|---|---|---|---|---|---|
| Party | Candidate | Votes | % | ±% | ||||
| Liberal | Joseph-Ernest Cyr | 1,896 | 50.1 | +0.9 | ||||
| Conservative | Alphonse-Alfred-Clément Larivière | 1,886 | 49.9 | -0.9 | ||||
| Total valid votes | 3,782 | 100.0 | ||||||
| Canadian federal election, 1900 | ||||||||
|---|---|---|---|---|---|---|---|---|
| Party | Candidate | Votes | % | ±% | ||||
| Conservative | Alphonse-Alfred-Clément Larivière | 1,528 | 50.7 | -13.8 | ||||
| Liberal | S.A.D. Bertrand | 1,484 | 49.3 | +13.8 | ||||
| Total valid votes | 3,012 | 100.0 | ||||||
| Canadian federal election, 1896 | ||||||||
|---|---|---|---|---|---|---|---|---|
| Party | Candidate | Votes | % | |||||
| Conservative | Alphonse-Alfred-Clément Larivière | 1,476 | 64.6 | |||||
| Liberal | George Walton | 810 | 35.4 | |||||
| Total valid votes | 2,286 | 100.0 | ||||||
| Canadian federal election, 1891 | ||||||||
|---|---|---|---|---|---|---|---|---|
| Party | Candidate | Votes | ||||||
| Conservative | Alphonse-Alfred-Clément Larivière | acclaimed | ||||||
| Canadian federal by-election, 24 January 1889 | ||||||||
|---|---|---|---|---|---|---|---|---|
| Party | Candidate | Votes | % | ±% | ||||
| On Mr. Royal being appointed Lieutenant-Governor of the North West Territories | ||||||||
| Conservative | Alphonse-Alfred-Clément Larivière | 797 | 48.3 | -9.8 | ||||
| Unknown | Richard | 583 | 35.4 | – | ||||
| Unknown | Clarke | 269 | 16.3 | – | ||||
| Total valid votes | 1,649 | 100.0 | ||||||
| Canadian federal election, 1887 | ||||||||
|---|---|---|---|---|---|---|---|---|
| Party | Candidate | Votes | % | |||||
| Conservative | Joseph Royal | 1,081 | 58.1 | |||||
| Independent Liberal | Joseph Ernest Cyr | 778 | 41.9 | |||||
| Total valid votes | 1,859 | 100.0 | ||||||
| Canadian federal election, 1882 | ||||||||
|---|---|---|---|---|---|---|---|---|
| Party | Candidate | Votes | ||||||
| Conservative | Joseph Royal | acclaimed | ||||||
| Canadian federal by-election, 30 December 1879 | ||||||||
|---|---|---|---|---|---|---|---|---|
| Party | Candidate | Votes | % | |||||
| Conservative | Joseph Royal | 652 | 62.6 | |||||
| Unknown | John Molloy | 269 | 25.8 | |||||
| Unknown | S. Hamelin | 121 | 11.6 | |||||
| Total valid votes | 1,042 | 100.0 | ||||||
| Called upon Mr. Dubuc being appointed Puisne Judge of the Court of Queen's Bench for Manitoba. | ||||||||
| Canadian federal election, 1878 | ||||||||
|---|---|---|---|---|---|---|---|---|
| Party | Candidate | Votes | ||||||
| Conservative | Joseph Dubuc | acclaimed | ||||||
| By-election on 31 March 1875
On Mr. Riel being unseated and declared an outlaw, 25 February 1875 | |||||
| Party | Candidate | Votes | |||
|---|---|---|---|---|---|
| Liberal | Andrew Bannatyne | acclaimed | |||
| By-election on 3 September 1874
On Mr. Riel being expelled from the House of Commons, 16 April 1874 | |||||
| Party | Candidate | Votes | |||
|---|---|---|---|---|---|
| Independent | Louis Riel | acclaimed | |||
| Canadian federal election, 1874 | ||||||||
|---|---|---|---|---|---|---|---|---|
| Party | Candidate | Votes | % | |||||
| Independent | Louis Riel | 195 | 73.9 | |||||
| Unknown | J. Hamelin | 69 | 26.1 | |||||
| Total valid votes | 264 | 100.0 | ||||||
| By-election on 13 October 1873
On Sir George-Étienne Cartier's death, 20 May 1873 | |||||
| Party | Candidate | Votes | |||
|---|---|---|---|---|---|
| Independent | Louis Riel | acclaimed | |||
| Canadian federal election, 1872 | ||||||||
|---|---|---|---|---|---|---|---|---|
| Party | Candidate | Votes | ||||||
| Liberal–Conservative | George-Étienne Cartier | acclaimed | ||||||
| Canadian federal by-election, 3 March 1871 | ||||||||
|---|---|---|---|---|---|---|---|---|
| Party | Candidate | Votes | % | |||||
| Conservative | Pierre Delorme | 172 | 85.6 | |||||
| Liberal | William Dease | 29 | 14.4 | |||||
| Total valid votes | 201 | 100.0 | ||||||
| Called as a result of Manitoba joining Confederation, 15 July 1870. | ||||||||
See also
References
- "(Code 46008) Census Profile". 2011 census. Statistics Canada. 2012. Retrieved 2011-03-03.
Notes
- 1 2 Statistics Canada: 2012
- 1 2 http://www12.statcan.gc.ca/nhs-enm/2011/dp-pd/prof/details/page.cfm?Lang=E&Geo1=FED&Code1=46008&Data=Count&SearchText=Provencher&SearchType=Begins&SearchPR=01&A1=All&B1=All&Custom=&TABID=1
- ↑ Elections Canada – Confirmed candidates for Provencher, 30 September 2015
- ↑ Elections Canada – Preliminary Election Expenses Limits for Candidates
- ↑ Mas, Susana. "Vic Toews resigns ahead of cabinet shuffle". CBC News. Retrieved 8 July 2013.
- ↑ Pundits' Guide to Canadian Elections
- ↑ Pirate Party of Canada. "Candidates". Retrieved 26 March 2011.