Souris—Moose Mountain Saskatchewan electoral district Saskatchewan electoral district |
|---|
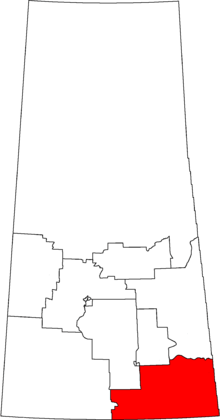 Souris—Moose Mountain in relation to other Saskatchewan federal electoral districts as of the 2013 Representation Order. |
| Federal electoral district |
|---|
| Legislature |
House of Commons |
|---|
| MP |
Robert Kitchen
Conservative |
|---|
| District created |
1987 |
|---|
| First contested |
1988 |
|---|
| Last contested |
2015 |
|---|
| District webpage |
profile, map |
|---|
| Demographics |
|---|
| Population (2011)[1] |
72,058 |
|---|
| Electors (2015) |
51,580 |
|---|
| Area (km²)[2] |
43,184 |
|---|
| Pop. density (per km²) |
1.7 |
|---|
| Census subdivisions |
Estevan, Weyburn, Moosomin, Grenfell, Carlyle, Kipling, Oxbow, Redvers, Carnduff |
|---|
Souris—Moose Mountain is a federal electoral district in Saskatchewan, Canada, that has been represented in the House of Commons of Canada since 1988.
Members of Parliament
Current Member of Parliament
Its Member of Parliament is Robert Gordon Kitchen a medical practitioner in Estevan who was elected as a Member of Parliament in the House of Commons of Canada to represent the federal electoral district of Souris—Moose Mountain at the 2015 Canadian federal election.[2]
Election results
| Canadian federal election, 2015 |
| Party |
Candidate |
Votes | % | ±% | Expenditures |
|
Conservative | Robert Kitchen | 26,315 | 70.14 | -2.72 | $40,077.78 |
|
New Democratic | Vicky O'Dell | 5,131 | 13.68 | -4.81 | $28,983.38 |
|
Liberal | Steve Bebbington | 5,076 | 13.53 | +7.94 | $159.00 |
|
Green | Bob Deptuck | 994 | 2.65 | -0.48 | $0.11 |
| Total valid votes/Expense limit |
37,516 | 100.0 | | $228,560.45 |
| Total rejected ballots |
126 | – | – |
| Turnout |
37,642 | 72.25 | +8.25 |
| Eligible voters |
52,093 |
|
Conservative hold |
Swing |
-3.78
|
| Source: Elections Canada[3][4] |
| Canadian federal election, 2011 |
| Party |
Candidate |
Votes | % | ±% | Expenditures |
|
Conservative | Ed Komarnicki | 21,598 | 74.0 | +3.5 | $45,028 |
|
New Democratic | Allan Arthur | 5,461 | 18.7 | +1.9 | $11,460 |
|
Liberal | Gerald Borrowman | 1,236 | 4.2 | –2.5 | $30,532 |
|
Green | Bob Deptuck | 898 | 3.1 | –2.9 | $483 |
| Total valid votes |
29,193 | 100.0 | | – |
| Total rejected ballots |
77 | 0.3 | 0.0 |
| Turnout |
29,270 | 64.0 | +3 |
| Eligible voters |
46,242 | – | – |
| Canadian federal election, 2008 |
| Party |
Candidate |
Votes | % | ±% | Expenditures |
|
Conservative | Ed Komarnicki | 19,293 | 70.5 | +7.7 | $43,314 |
|
New Democratic | Raquel Fletcher | 4,599 | 16.8 | +2.9 | $6,182 |
|
Liberal | Marlin Belt | 1,834 | 6.7 | -11.8 | – |
|
Green | Bob Deptuck | 1,643 | 6.0 | +1.3 | $2,093 |
| Total valid votes/Expense limit |
27,369 | 100.0 | | $89,152 |
| Total rejected ballots |
90 | 0.3 | 0.0 |
| Turnout |
27,459 | 57 | -8 |
| Canadian federal election, 2006 |
| Party |
Candidate |
Votes | % | ±% | Expenditures |
|
Conservative | Ed Komarnicki | 19,282 | 62.8 | +25.9 | $40,537 |
|
Liberal | Lonny McKague | 5,681 | 18.5 | -1.1 | $42,576 |
|
New Democratic | Michael Haukeness | 4,284 | 14.0 | +0.2 | $6,329 |
|
Green | Mathew Smith | 1,448 | 4.7 | +3.0 | $518 |
| Total valid votes |
30,695 | 100.0 | | – |
| Total rejected ballots |
83 | 0.3 | 0.0 |
| Turnout |
30,778 | 65.3 | +2.3 |
| Canadian federal election, 2004 |
| Party |
Candidate |
Votes | % | ±% | Expenditures |
|
Conservative | Ed Komarnicki | 11,306 | 36.9 | -33.1 | $52,238 |
|
Independent | Grant Devine | 8,399 | 27.4 | – | $69,162 |
|
Liberal | Lonny McKague | 6,001 | 19.6 | +5.2 | $44,913 |
|
New Democratic | Robert Stephen Stringer | 4,202 | 13.7 | -1.9 | $15,033 |
|
Green | Sigfredo Gonzalez | 537 | 1.8 | – | |
|
Christian Heritage | Robert Thomas Jacobson | 191 | 0.6 | – | $194 |
| Total valid votes |
30,636 | 100.0 | | – |
| Total rejected ballots |
83 | 0.3 | -0.1 |
| Turnout |
30,719 | 63.0 | 0.0 |
| Canadian federal election, 2000 |
| Party |
Candidate |
Votes | % | ±% | Expenditures |
|
Alliance | Roy Bailey | 19,278 | 63.3 | +22.1 | $32,614 |
|
New Democratic | Tom Cameron | 4,755 | 15.6 | -3.0 | $12,747 |
|
Liberal | Myles Fuchs | 4,371 | 14.3 | -12.9 | $11,644 |
|
Progressive Conservative | Larry Gabruch | 2,060 | 6.8 | -6.2 | – |
| Total valid votes |
30,464 | 100.0 | | – |
| Total rejected ballots |
98 | 0.3 | -0.1 |
| Turnout |
30,562 | 63.0 | +4.0 |
| Canadian federal election, 1997 |
| Party |
Candidate |
Votes | % | ±% | Expenditures |
|
Reform | Roy Bailey | 13,732 | 41.2 | +10.5 | $24,042 |
|
Liberal | Bernie Collins | 9,077 | 27.2 | -5.0 | $42,840 |
|
New Democratic | Gary Lake | 6,209 | 18.6 | +2.1 | $26,063 |
|
Progressive Conservative | Greg Douglas | 4,333 | 13.0 | -2.0 | $11,530 |
| Total valid votes |
33,351 | 100.0 | | – |
| Total rejected ballots |
128 | 0.4 |
| Turnout |
33,479 | 67.0 |
.png)