Saint Boniface—Saint Vital
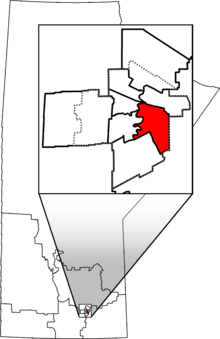 Saint Boniface—Saint Vital in relation to other Manitoba federal electoral districts as of the 2013 Representation Order. Dotted line shows Winnipeg city limits. | |||
| Federal electoral district | |||
| Legislature | House of Commons | ||
| MP |
Liberal | ||
| District created | 1924 | ||
| First contested | 1925 | ||
| Last contested | 2015 | ||
| District webpage | profile, map | ||
| Demographics | |||
| Population (2011)[1] | 84,353 | ||
| Electors (2015) | 64,202 | ||
| Area (km²)[2] | 65 | ||
| Pop. density (per km²) | 1,297.7 | ||
| Census divisions | Winnipeg | ||
| Census subdivisions | Winnipeg | ||
Saint Boniface—Saint Vital (French: Saint-Boniface—Saint-Vital; formerly Saint Boniface) is a federal electoral district in Winnipeg, Manitoba that has been represented in the House of Commons of Canada since 1925.
The district covers roughly the southern portion of the city of Winnipeg, east of the Red River. In particular, it contains the Franco-Manitoban community of Saint Boniface and roughly the northern two-thirds of the community of St. Vital. The riding (as federal electoral districts are called in Canada) has a sizeable French population (16% according to the last census) and was a Liberal Party stronghold for most of its history. However, Conservative Shelly Glover, a Winnipeg police sergeant, won it in 2008 and three years later became the first centre-right MP in the riding's history to be re-elected.
It is the only riding in Western Canada that regularly elects francophone candidates to parliament.
History
In 1996, its English name was changed from "St. Boniface" to "Saint Boniface".
In 2008, Conservative candidate and Winnipeg police officer Shelly Glover, defeated Liberal incumbent Raymond Simard, who had held the seat since a 2002 by-election. She easily defeated Simard in a 2011 rematch, becoming the second centre-right MP to win a second full term in the riding's history.
Saint Boniface was largely superseded by "Saint Boniface—Saint Vital", losing territory to Winnipeg South and Elmwood—Transcona, and gaining territory from Winnipeg South during the 2012 electoral redistribution. The riding reverted to form when Glover retired in 2015, when Liberal candidate Dan Vandal, who represented much of Saint Boniface on Winnipeg City Council, won it resoundingly as part of a Liberal near-sweep of Winnipeg.
Name changes
The federal riding's name has undergone various changes since its creation in 1924.
| Year | English name | French name |
|---|---|---|
| 1924-1947 | St. Boniface | Saint-Boniface |
| 1947-1952 | St. Boniface | St-Boniface |
| 1952-1996 | St. Boniface | Saint-Boniface |
| 1996–2013 | Saint Boniface | Saint-Boniface |
| 2013-present | Saint Boniface—Saint Vital | Saint-Boniface—Saint-Vital |
Members of Parliament
The riding has elected the following Members of Parliament:
| Parliament | Years | Member | Party | |
|---|---|---|---|---|
| St. Boniface Riding created from Springfield |
||||
| 15th | 1925–1926 | John Power Howden | Liberal | |
| 16th | 1926–1930 | |||
| 17th | 1930–1935 | |||
| 18th | 1935–1940 | |||
| 19th | 1940–1945 | |||
| 20th | 1945–1949 | Fernand Viau | ||
| 21st | 1949–1953 | |||
| 22nd | 1953–1957 | |||
| 23rd | 1957–1958 | Louis Deniset | ||
| 24th | 1958–1962 | Laurier Régnier | Progressive Conservative | |
| 25th | 1962–1963 | Roger Teillet | Liberal | |
| 26th | 1963–1965 | |||
| 27th | 1965–1968 | |||
| 28th | 1968–1972 | Joseph-Philippe Guay | ||
| 29th | 1972–1974 | |||
| 30th | 1974–1978 | |||
| 1978–1979 | Jack Hare | Progressive Conservative | ||
| 31st | 1979–1980 | Robert Bockstael | Liberal | |
| 32nd | 1980–1984 | |||
| 33rd | 1984–1988 | Léo Duguay | Progressive Conservative | |
| 34th | 1988–1993 | Ron Duhamel | Liberal | |
| 35th | 1993–1997 | |||
| Saint Boniface | ||||
| 36th | 1997–1999 | Ron Duhamel | Liberal | |
| 37th | 2000–2002 | |||
| 2002–2004 | Raymond Simard | |||
| 38th | 2004–2006 | |||
| 39th | 2006–2008 | |||
| 40th | 2008–2011 | Shelly Glover | Conservative | |
| 41st | 2011–2015 | |||
| Saint Boniface—Saint Vital | ||||
| 42nd | 2015–Present | Dan Vandal | Liberal | |
Election results
| Canadian federal election, 2015 | ||||||||
|---|---|---|---|---|---|---|---|---|
| Party | Candidate | Votes | % | ±% | Expenditures | |||
| Liberal | Dan Vandal | 28,530 | 58.44 | +27.23 | $69,923.02 | |||
| Conservative | François Catellier | 14,005 | 28.69 | -21.44 | $152,734.08 | |||
| New Democratic | Erin Selby | 5,169 | 10.59 | -5.20 | $73,670.05 | |||
| Green | Glenn Zaretski | 1,119 | 2.29 | -0.59 | $485.69 | |||
| Total valid votes/Expense limit | 48,823 | 100.00 | $200,203.09 | |||||
| Total rejected ballots | 152 | 0.31 | – | |||||
| Turnout | 48,975 | 74.63 | – | |||||
| Eligible voters | 65,626 | |||||||
| Liberal gain from Conservative | Swing | +24.34 | ||||||
| Source: Elections Canada[3][4] | ||||||||
| 2011 federal election redistributed results[5] | |||
|---|---|---|---|
| Party | Vote | % | |
| Conservative | 20,261 | 50.13 | |
| Liberal | 12,611 | 31.20 | |
| New Democratic | 6,382 | 15.79 | |
| Green | 1,165 | 2.88 | |
| Canadian federal election, 2011 | ||||||||
|---|---|---|---|---|---|---|---|---|
| Party | Candidate | Votes | % | ±% | Expenditures | |||
| Conservative | Shelly Glover | 21,737 | 50.3 | +4.0 | $84,354.60 | |||
| Liberal | Raymond Simard | 13,314 | 30.8 | -4.3 | $82,059.23 | |||
| New Democratic | Patrice Miniely | 6,935 | 16.0 | +2.9 | $1,082.97 | |||
| Green | Marc Payette | 1,245 | 2.9 | -2.1 | $950.00 | |||
| Total valid votes/Expense limit | 43,231 | 100.0 | – | |||||
| Total rejected ballots | 181 | 0.4 | +0.1 | |||||
| Turnout | 43,412 | 67.18 | +2.86 | |||||
| Eligible voters | 64,620 | – | – | |||||
| Canadian federal election, 2008 | ||||||||
|---|---|---|---|---|---|---|---|---|
| Party | Candidate | Votes | % | ±% | Expenditures | |||
| Conservative | Shelly Glover | 19,440 | 46.3 | +11.3 | $71,480 | |||
| Liberal | Raymond Simard | 14,728 | 35.1 | -3.5 | $78,353 | |||
| New Democratic | Matt Schaubroeck | 5,502 | 13.1 | -8.8 | $12,641 | |||
| Green | Marc Payette | 2,104 | 5.0 | +1.2 | $8,506 | |||
| Christian Heritage | Justin Gregoire | 195 | 0.5 | -0.2 | $12 | |||
| Total valid votes/Expense limit | 41,969 | 100.0 | $79,503 | |||||
| Total rejected ballots | 133 | 0.3 | -0.1 | |||||
| Turnout | 42,102 | 64.32 | -1.6 | |||||
| Canadian federal election, 2006 | ||||||||
|---|---|---|---|---|---|---|---|---|
| Party | Candidate | Votes | % | ±% | Expenditures | |||
| Liberal | Raymond Simard | 16,417 | 38.6 | -8.0 | $72,056 | |||
| Conservative | Ken Cooper | 14,893 | 35.0 | 4.0 | $57,276 | |||
| New Democratic | Mathieu Allard | 9,311 | 21.9 | +3.9 | $23,405 | |||
| Green | Marc Payette | 1,640 | 3.9 | +1.5 | $4,830 | |||
| Christian Heritage | Jane MacDiarmid | 285 | 0.7 | -0.3 | $503 | |||
| Total valid votes | 42,546 | 100.0 | – | |||||
| Total rejected ballots | 163 | 0.4 | 0.0 | |||||
| Turnout | 42,709 | 66.9 | +6.2 | |||||
| Canadian federal election, 2004 | ||||||||
|---|---|---|---|---|---|---|---|---|
| Party | Candidate | Votes | % | ±% | Expenditures | |||
| Liberal | Raymond Simard | 17,989 | 46.6 | +3.8 | $64,019 | |||
| Conservative | Ken Cooper | 11,956 | 31.0 | -8.1 | $71,843 | |||
| New Democratic | Mathieu Allard | 6,954 | 18.0 | +3.0 | $9,928 | |||
| Green | Daniel Backé | 925 | 2.4 | – | $202 | |||
| Christian Heritage | Jeannine Moquin-Perry | 378 | 1.0 | 0.0 | $7,690 | |||
| Marijuana | Chris Buors | 317 | 0.8 | -1.3 | – | |||
| Communist | Gérard Guay | 77 | 0.2 | – | $654 | |||
| Total valid votes | 38,596 | 100.0 | – | |||||
| Total rejected ballots | 130 | 0.3 | ||||||
| Turnout | 38,726 | 60.7 | ||||||
| Canadian federal by-election, 13 May 2002 | ||||||||
|---|---|---|---|---|---|---|---|---|
| Party | Candidate | Votes | % | ±% | ||||
| On Mr. Duhamel being called to the Senate, 15 January 2002 | ||||||||
| Liberal | Raymond Simard | 8,862 | 42.8 | -9.3 | ||||
| Alliance | Denis Simard | 4,497 | 21.7 | -1.4 | ||||
| Progressive Conservative | Mike Reilly | 3,583 | 17.3 | 5.7 | ||||
| New Democratic | John Parry | 3,106 | 15.0 | +2.0 | ||||
| Marijuana | Chris Buors | 435 | 2.1 | |||||
| Christian Heritage | Jean-Paul Kabashiki | 210 | 1.0 | |||||
| Total valid votes | 20,693 | 100.0 | ||||||
| Canadian federal election, 2000 | ||||||||
|---|---|---|---|---|---|---|---|---|
| Party | Candidate | Votes | % | ±% | ||||
| Liberal | Ronald J. Duhamel | 20,173 | 52.2 | +1.0 | ||||
| Alliance | Joyce M. Chilton | 8,962 | 23.2 | +5.2 | ||||
| New Democratic | John Parry | 5,026 | 13.0 | -5.0 | ||||
| Progressive Conservative | Mike Reilly | 4,505 | 11.7 | -0.7 | ||||
| Total valid votes | 38,666 | 100.0 | ||||||
| Canadian federal election, 1997 | ||||||||
|---|---|---|---|---|---|---|---|---|
| Party | Candidate | Votes | % | ±% | ||||
| Liberal | Ronald J. Duhamel | 18,948 | 51.2 | -12.2 | ||||
| New Democratic | Peter Carney | 6,663 | 18.0 | +10.9 | ||||
| Reform | Denis Simard | 6,658 | 18.0 | +1.2 | ||||
| Progressive Conservative | Jennifer Clark | 4,555 | 12.3 | +5.1 | ||||
| Marxist–Leninist | Rubin Kantorovich | 171 | 0.5 | +0.3 | ||||
| Total valid votes | 36,995 | 100.0 | ||||||
| Canadian federal election, 1993 | ||||||||
|---|---|---|---|---|---|---|---|---|
| Party | Candidate | Votes | % | ±% | ||||
| Liberal | Ronald J. Duhamel | 30,041 | 63.4 | +11.9 | ||||
| Reform | Alison Anderson | 7,959 | 16.8 | +14.1 | ||||
| Progressive Conservative | Barbara Thompson | 3,404 | 7.2 | -26.5 | ||||
| New Democratic | Pauline Dupont | 3,354 | 7.1 | -3.6 | ||||
| National | Marcelle Marion | 2,008 | 4.2 | |||||
| Canada Party | Don Dumesnil | 329 | 0.7 | |||||
| Natural Law | Ginette Robert | 250 | 0.5 | |||||
| Marxist–Leninist | Sharon Segal | 59 | 0.1 | |||||
| Total valid votes | 47,404 | 100.0 | ||||||
| Canadian federal election, 1988 | ||||||||
|---|---|---|---|---|---|---|---|---|
| Party | Candidate | Votes | % | ±% | ||||
| Liberal | Ronald J. Duhamel | 24,117 | 51.5 | +17.5 | ||||
| Progressive Conservative | Léo Duguay | 15,747 | 33.6 | -6.1 | ||||
| New Democratic | Alan Turner | 5,012 | 10.7 | -12.2 | ||||
| Reform | Gordon G. Duncan | 1,281 | 2.7 | |||||
| Libertarian | Guy Beaudry | 425 | 0.9 | |||||
| Independent | Lyle H. Cruickshank | 190 | 0.4 | |||||
| Independent | Rubin Kantorovich | 43 | 0.1 | |||||
| Total valid votes | 46,815 | 100.0 | ||||||
| Canadian federal election, 1984 | ||||||||
|---|---|---|---|---|---|---|---|---|
| Party | Candidate | Votes | % | ±% | ||||
| Progressive Conservative | Léo Duguay | 19,548 | 39.7 | +10.3 | ||||
| Liberal | Robert Bockstael | 16,763 | 34.0 | -11.2 | ||||
| New Democratic | Armand T. Bédard | 11,279 | 22.9 | -2.3 | ||||
| Confederation of Regions | Dennis A. Epps | 1,649 | 3.3 | |||||
| Total valid votes | 49,239 | 100.0 | ||||||
| Canadian federal election, 1980 | ||||||||
|---|---|---|---|---|---|---|---|---|
| Party | Candidate | Votes | % | ±% | ||||
| Liberal | Robert Bockstael | 20,076 | 45.2 | +4.4 | ||||
| Progressive Conservative | Tom Denton | 13,044 | 29.4 | -5.8 | ||||
| New Democratic | Marc Boily | 11,191 | 25.2 | +1.5 | ||||
| Marxist–Leninist | Sharon Segal | 57 | 0.1 | 0.0 | ||||
| Total valid votes | 44,368 | 100.0 | ||||||
| Canadian federal election, 1979 | ||||||||
|---|---|---|---|---|---|---|---|---|
| Party | Candidate | Votes | % | ±% | ||||
| Liberal | Robert Bockstael | 19,752 | 40.9 | +9.2 | ||||
| Progressive Conservative | Jack Hare | 16,987 | 35.2 | -7.4 | ||||
| New Democratic | Grant Wichenko | 11,455 | 23.7 | +1.7 | ||||
| Marxist–Leninist | Manuel Gitterman | 60 | 0.1 | |||||
| Independent | Russ Maley | 56 | 0.1 | |||||
| Total valid votes | 48,310 | 100.0 | ||||||
| Canadian federal by-election, 16 October 1978 | ||||||||
|---|---|---|---|---|---|---|---|---|
| Party | Candidate | Votes | % | ±% | ||||
| On Mr. Guay's resignation, 23 March 1978 | ||||||||
| Progressive Conservative | Jack Hare | 18,552 | 42.6 | +6.4 | ||||
| Liberal | Robert Bockstael | 13,804 | 31.7 | -10.9 | ||||
| New Democratic | Grant Wichenko | 9,570 | 22.0 | +1.8 | ||||
| Social Credit | Lorne Reznowski | 1,204 | 2.8 | +1.7 | ||||
| Independent | Donald Bryan Oliver | 281 | 0.6 | |||||
| Independent | William Hawryluk | 161 | 0.4 | |||||
| Total valid votes | 43,572 | 100.0 | ||||||
| Canadian federal election, 1974 | ||||||||
|---|---|---|---|---|---|---|---|---|
| Party | Candidate | Votes | % | ±% | ||||
| Liberal | Joseph-P. Guay | 21,853 | 42.6 | -1.9 | ||||
| Progressive Conservative | Jack Hare | 18,604 | 36.2 | +10.1 | ||||
| New Democratic | Jim Garwood | 10,364 | 20.2 | -7.5 | ||||
| Social Credit | Thomas L. Cruickshank | 536 | 1.0 | -0.2 | ||||
| Total valid votes | 51,357 | 100.0 | ||||||
| Canadian federal election, 1972 | ||||||||
|---|---|---|---|---|---|---|---|---|
| Party | Candidate | Votes | % | ±% | ||||
| Liberal | Joseph-P. Guay | 22,200 | 44.4 | -7.3 | ||||
| New Democratic | Joseph F. Sherwood | 13,857 | 27.7 | +0.6 | ||||
| Progressive Conservative | Peter Hillcoff | 13,033 | 26.1 | +7.2 | ||||
| Social Credit | Gilles J. Ouellet | 643 | 1.3 | -0.9 | ||||
| Independent | Russ Maley | 241 | 0.5 | |||||
| Total valid votes | 49,974 | 100.0 | ||||||
| Canadian federal election, 1968 | ||||||||
|---|---|---|---|---|---|---|---|---|
| Party | Candidate | Votes | % | ±% | ||||
| Liberal | Joseph-P. Guay | 22,032 | 51.7 | +9.9 | ||||
| New Democratic | Harry Shafransky | 11,566 | 27.2 | +0.4 | ||||
| Progressive Conservative | Vaughan L. Baird | 8,048 | 18.9 | -12.6 | ||||
| Social Credit | Georges Forest | 949 | 2.2 | |||||
| Total valid votes | 42,595 | 100.0 | ||||||
| Canadian federal election, 1965 | ||||||||
|---|---|---|---|---|---|---|---|---|
| Party | Candidate | Votes | % | ±% | ||||
| Liberal | Roger Teillet | 13,961 | 41.8 | +1.1 | ||||
| Progressive Conservative | Harry Deleeuw | 10,499 | 31.5 | +2.3 | ||||
| New Democratic | Harry Shafransky | 8,923 | 26.7 | +8.2 | ||||
| Total valid votes | 33,383 | 100.0 | ||||||
| Canadian federal election, 1963 | ||||||||
|---|---|---|---|---|---|---|---|---|
| Party | Candidate | Votes | % | ±% | ||||
| Liberal | Roger Teillet | 13,547 | 40.7 | +2.7 | ||||
| Progressive Conservative | Laurier Régnier | 9,716 | 29.2 | -0.6 | ||||
| New Democratic | Graham Campbell | 6,184 | 18.6 | -5.0 | ||||
| Social Credit | Georges-J. Forest | 3,859 | 11.6 | +2.9 | ||||
| Total valid votes | 33,306 | 100.0 | ||||||
| Canadian federal election, 1962 | ||||||||
|---|---|---|---|---|---|---|---|---|
| Party | Candidate | Votes | % | ±% | ||||
| Liberal | Roger Teillet | 12,084 | 37.9 | +5.0 | ||||
| Progressive Conservative | Laurier Régnier | 9,483 | 29.8 | -14.2 | ||||
| New Democratic | Graham Campbell | 7,508 | 23.6 | +3.6 | ||||
| Social Credit | Joseph-E St Hilaire | 2,773 | 8.7 | +5.7 | ||||
| Total valid votes | 31,848 | 100.0 | ||||||
| Canadian federal election, 1958 | ||||||||
|---|---|---|---|---|---|---|---|---|
| Party | Candidate | Votes | % | ±% | ||||
| Progressive Conservative | Laurier Régnier | 12,688 | 44.0 | +19.8 | ||||
| Liberal | Louis Deniset | 9,500 | 33.0 | +1.8 | ||||
| Co-operative Commonwealth | Nicholas Manchur | 5,759 | 20.0 | -4.9 | ||||
| Social Credit | Lockie A. Miles | 881 | 3.1 | -12.4 | ||||
| Total valid votes | 28,828 | 100.0 | ||||||
| Canadian federal election, 1957 | ||||||||
|---|---|---|---|---|---|---|---|---|
| Party | Candidate | Votes | % | ±% | ||||
| Liberal | Louis Deniset | 7,777 | 31.1 | -12.1 | ||||
| Co-operative Commonwealth | Nicholas Manchur | 6,216 | 24.9 | -5.0 | ||||
| Progressive Conservative | Laurier Régnier | 6,040 | 24.2 | -2.7 | ||||
| Social Credit | Dollard Lafrenière | 3,872 | 15.5 | |||||
| Independent Liberal | Fernand Viau | 1,074 | 4.3 | |||||
| Total valid votes | 24,979 | 100.0 | ||||||
| Canadian federal election, 1953 | ||||||||
|---|---|---|---|---|---|---|---|---|
| Party | Candidate | Votes | % | ±% | ||||
| Liberal | Fernand Viau | 8,051 | 43.3 | -14.1 | ||||
| Co-operative Commonwealth | Leonard S. Evans | 5,568 | 29.9 | +0.9 | ||||
| Progressive Conservative | George Campbell MacLean | 4,994 | 26.8 | +13.2 | ||||
| Total valid votes | 18,613 | 100.0 | ||||||
| Canadian federal election, 1949 | ||||||||
|---|---|---|---|---|---|---|---|---|
| Party | Candidate | Votes | % | ±% | ||||
| Liberal | Fernand Viau | 10,766 | 57.3 | +20.4 | ||||
| Co-operative Commonwealth | Andrew Russell Paulley | 5,455 | 29.0 | -0.4 | ||||
| Progressive Conservative | Louis Léger | 2,557 | 13.6 | -7.3 | ||||
| Total valid votes | 18,778 | 100.0 | ||||||
| Canadian federal election, 1945 | ||||||||
|---|---|---|---|---|---|---|---|---|
| Party | Candidate | Votes | % | ±% | ||||
| Liberal | Fernand Viau | 6,055 | 37.0 | -14.8 | ||||
| Co-operative Commonwealth | Évariste-Rupert Gagnon | 4,823 | 29.4 | +18.1 | ||||
| Progressive Conservative | George Campbell MacLean | 3,421 | 20.9 | -2.5 | ||||
| Social Credit | Charles Anderson Bailey | 1,369 | 8.4 | -3.7 | ||||
| Labor–Progressive | Jules Jerome Pynoo | 710 | 4.3 | |||||
| Total valid votes | 16,378 | 100.0 | ||||||
| Canadian federal election, 1940 | ||||||||
|---|---|---|---|---|---|---|---|---|
| Party | Candidate | Votes | % | ±% | ||||
| Liberal | John Power Howden | 7,926 | 51.8 | -5.0 | ||||
| National Government | George Campbell MacLean | 3,578 | 23.4 | +6.2 | ||||
| Social Credit | Philippe Guay | 1,839 | 12.0 | +7.2 | ||||
| Co-operative Commonwealth | George Henry Barefoot | 1,739 | 11.4 | -6.4 | ||||
| Independent | Morris Jacob | 216 | 1.4 | |||||
| Total valid votes | 15,298 | 100.0 | ||||||
| Canadian federal election, 1935 | ||||||||
|---|---|---|---|---|---|---|---|---|
| Party | Candidate | Votes | % | ±% | ||||
| Liberal | John Power Howden | 7,353 | 56.8 | +5.1 | ||||
| Co-operative Commonwealth | Edwin Arnold Hansford | 2,304 | 17.8 | +3.5 | ||||
| Conservative | Joseph-Placide Bertrand | 2,222 | 17.2 | -16.8 | ||||
| Social Credit | Victor James Gray | 624 | 4.8 | |||||
| Reconstruction | Thomas Boniface Molloy | 438 | 3.4 | |||||
| Total valid votes | 12,941 | 100.0 | ||||||
| Canadian federal election, 1930 | ||||||||
|---|---|---|---|---|---|---|---|---|
| Party | Candidate | Votes | % | ±% | ||||
| Liberal | John Power Howden | 7,045 | 51.7 | +0.7 | ||||
| Conservative | Edgar Honwell Cook | 4,630 | 34.0 | +6.0 | ||||
| Labour | Edwin Arnold Hansford | 1,943 | 14.3 | -6.7 | ||||
| Total valid votes | 13,618 | 100.0 | ||||||
| Canadian federal election, 1926 | ||||||||
|---|---|---|---|---|---|---|---|---|
| Party | Candidate | Votes | % | ±% | ||||
| Liberal | John Power Howden | 5,903 | 51.0 | +3.6 | ||||
| Conservative | Joseph Bernier | 3,235 | 28.0 | +3.9 | ||||
| Labour | Allan Meikle | 2,427 | 21.0 | -7.6 | ||||
| Total valid votes | 11,565 | 100.0 | ||||||
| Canadian federal election, 1925 | ||||||||
|---|---|---|---|---|---|---|---|---|
| Party | Candidate | Votes | % | |||||
| Liberal | John Power Howden | 4,819 | 47.4 | |||||
| Independent Labour | Allan Meikle | 2,901 | 28.5 | |||||
| Conservative | George Campbell MacLean | 2,442 | 24.0 | |||||
| Total valid votes | 10,162 | 100.0 | ||||||
See also
- St. Boniface (provincial electoral district)
- List of Canadian federal electoral districts
- Past Canadian electoral districts
References
- "(Code 35104) Census Profile". 2011 census. Statistics Canada. 2012. Retrieved 2011-03-03.
Notes
External links
- Riding history for St. Boniface (1924–1947) from the Library of Parliament
- Riding history for St. Boniface (1947–1952) from the Library of Parliament
- Riding history for St. Boniface (1952–1996) from the Library of Parliament
- Riding history for Saint Boniface (1996 - ) from the Library of Parliament
- 2011 results from Elections Canada
- Expenditures - 2008
- Detailed riding map of Saint Boniface from Elections Canada