Yorkton—Melville
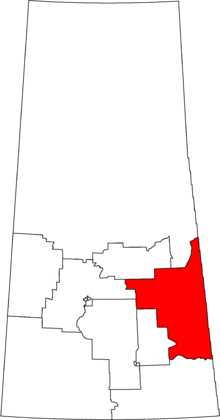 Yorkton—Melville in relation to other Saskatchewan federal electoral districts as of the 2013 Representation Order. | |||
| Coordinates: | 51°55′44″N 102°45′04″W / 51.929°N 102.751°WCoordinates: 51°55′44″N 102°45′04″W / 51.929°N 102.751°W | ||
| Federal electoral district | |||
| Legislature | House of Commons | ||
| MP |
Conservative | ||
| District created | 1966 | ||
| First contested | 1968 | ||
| Last contested | 2015 | ||
| District webpage | profile, map | ||
| Demographics | |||
| Population (2011)[1] | 71,270 | ||
| Electors (2015) | 53,446 | ||
| Area (km²)[2] | 43,272 | ||
| Pop. density (per km²) | 1.6 | ||
| Census subdivisions | Yorkton, Melville, Esterhazy, Canora, Tisdale, Hudson Bay | ||
Yorkton—Melville is a federal electoral district in Saskatchewan, Canada, that has been represented in the House of Commons of Canada since 1968.
Geography
The district is in east-central Saskatchewan.
History
The electoral district was created in 1966 from Yorkton, Melville and Mackenzie ridings.
In 2006, 30.2% of the population of the Yorkton—Melville constituency were of Ukrainian ethnic origin, the highest such percentage in Canada.[3] Also during the 2006 election, the Yorkton—Melville riding had the highest percentage of eligible voters over the age of 65, and highest average age of all the then-308 federal electoral districts.
This riding lost a fraction of territory to Regina—Qu'Appelle and gained territory from Saskatoon—Humboldt and a fraction from Desnethé—Missinippi—Churchill River during the 2012 electoral redistribution.
Members of Parliament
| Parliament | Years | Member | Party | |
|---|---|---|---|---|
| Yorkton—Melville Riding created from Yorkton, Melville and Mackenzie |
||||
| 28th | 1968–1972 | Lorne Nystrom | New Democratic | |
| 29th | 1972–1974 | |||
| 30th | 1974–1979 | |||
| 31st | 1979–1980 | |||
| 32nd | 1980–1984 | |||
| 33rd | 1984–1988 | |||
| 34th | 1988–1993 | |||
| 35th | 1993–1997 | Garry Breitkreuz | Reform | |
| 36th | 1997–2000 | |||
| 2000–2000 | Alliance | |||
| 37th | 2000–2003 | |||
| 2003–2004 | Conservative | |||
| 38th | 2004–2006 | |||
| 39th | 2006–2008 | |||
| 40th | 2008–2011 | |||
| 41st | 2011–2015 | |||
| 42nd | 2015–Present | Cathay Wagantall | ||
Election results
| Canadian federal election, 2015 | ||||||||
|---|---|---|---|---|---|---|---|---|
| Party | Candidate | Votes | % | ±% | Expenditures | |||
| Conservative | Cathay Wagantall | 21,683 | 59.22 | -9.66 | $57,632.77 | |||
| New Democratic | Doug Ottenbreit | 7,396 | 20.20 | -1.76 | $21,043.83 | |||
| Liberal | Brooke Taylor Malinoski | 6,504 | 17.76 | +11.15 | $3,627.04 | |||
| Green | Elaine Marie Hughes | 1,030 | 2.81 | +0.43 | $130.31 | |||
| Total valid votes/Expense limit | 36,613 | 100.0 | $229,969.51 | |||||
| Total rejected ballots | 95 | – | – | |||||
| Turnout | 36,708 | 68.36 | +4.96 | |||||
| Eligible voters | 53,694 | |||||||
| Source: Elections Canada[4][5] | ||||||||
| 2011 federal election redistributed results[6] | |||
|---|---|---|---|
| Party | Vote | % | |
| Conservative | 23,607 | 68.88 | |
| New Democratic | 7,526 | 21.96 | |
| Liberal | 2,266 | 6.61 | |
| Green | 817 | 2.38 | |
| Independent | 58 | 0.17 | |
| Canadian federal election, 2011 | ||||||||
|---|---|---|---|---|---|---|---|---|
| Party | Candidate | Votes | % | ±% | Expenditures | |||
| Conservative | Garry Breitkreuz | 21,906 | 68.9 | +0.9 | $68,801 | |||
| New Democratic | Doug Ottenbreit | 6,931 | 21.8 | +1.0 | $13,345 | |||
| Liberal | Kash Andreychuk | 2,167 | 6.8 | +1.4 | $40,387 | |||
| Green | Elaine Hughes | 774 | 2.4 | -3.3 | $540 | |||
| Total valid votes/Expense limit | 31,778 | 100.0 | $92,190 | |||||
| Total rejected ballots | 90 | 0.3 | -0.1 | |||||
| Turnout | 31,868 | 63.4 | +6 | |||||
| Eligible voters | 50,254 | – | – | |||||
| Canadian federal election, 2008 | ||||||||
|---|---|---|---|---|---|---|---|---|
| Party | Candidate | Votes | % | ±% | Expenditures | |||
| Conservative | Garry Breitkreuz | 19,824 | 68.0 | +4.6 | $65,139 | |||
| New Democratic | Doug Ottenbreit | 6,076 | 20.8 | +2.0 | $12,454 | |||
| Green | Jen Antony | 1,664 | 5.7 | +2.9 | $3,767 | |||
| Liberal | Bryan H. Bell | 1,578 | 5.4 | -8.5 | – | |||
| Total valid votes/Expense limit | 29,142 | 100.0 | $89,452 | |||||
| Total rejected ballots | 107 | 0.4 | +0.2 | |||||
| Turnout | 29,249 | 57 | -7 | |||||
| Canadian federal election, 2006 | ||||||||
|---|---|---|---|---|---|---|---|---|
| Party | Candidate | Votes | % | ±% | Expenditures | |||
| Conservative | Garry Breitkreuz | 20,736 | 63.5 | +0.6 | $55,627 | |||
| New Democratic | Jason Dennison | 6,165 | 18.9 | +4.1 | $19,488 | |||
| Liberal | Mervin Cushman | 4,558 | 14.0 | -0.8 | $18,223 | |||
| Green | Keith Neu | 923 | 2.8 | +1.2 | $641 | |||
| Independent | Carl Barabonoff | 287 | 0.9 | – | $739 | |||
| Total valid votes | 32,669 | 100.0 | – | |||||
| Total rejected ballots | 80 | 0.2 | -0.1 | |||||
| Turnout | 32,749 | 64.3 | +4.1 | |||||
| Canadian federal election, 2004 | ||||||||
|---|---|---|---|---|---|---|---|---|
| Party | Candidate | Votes | % | ±% | Expenditures | |||
| Conservative | Garry Breitkreuz | 19,940 | 62.9 | -5.0 | $61,866 | |||
| New Democratic | Don Olson | 5,890 | 18.6 | +2.8 | $18,736 | |||
| Liberal | Ted Quewezance | 4,697 | 14.8 | -1.4 | $32,905 | |||
| Green | Ralph Pilchner | 630 | 1.98 | +2.0 | – | |||
| Independent | David Sawkiw | 524 | 1.7 | – | $6,330 | |||
| Total valid votes | 31,681 | 100.0 | – | |||||
| Total rejected ballots | 113 | 0.4 | 0.0 | |||||
| Turnout | 31,794 | 60.2 | -3.4 | |||||
Note: Conservative vote is compared to the total of the Canadian Alliance vote and Progressive Conservative vote in 2000 election.
| Canadian federal election, 2000 | ||||||||
|---|---|---|---|---|---|---|---|---|
| Party | Candidate | Votes | % | ±% | Expenditures | |||
| Alliance | Garry Breitkreuz* | 19,978 | 63.0 | +12.9 | $52,574 | |||
| Liberal | Ken Pilon | 5,153 | 16.2 | -2.6 | $24,027 | |||
| New Democratic | Peter Champagne | 5,007 | 15.8 | -9.2 | $9,235 | |||
| Progressive Conservative | Brent Haas | 1,583 | 5.0 | -1.1 | $543 | |||
| Total valid votes | 31,721 | 100.0 | – | |||||
| Total rejected ballots | 103 | 0.3 | 0.0 | |||||
| Turnout | 31,824 | 63.6 | -3.3 | |||||
Note: Canadian Alliance vote is compared to the Reform vote in 1997 election.
| Canadian federal election, 1997 | ||||||||
|---|---|---|---|---|---|---|---|---|
| Party | Candidate | Votes | % | ±% | Expenditures | |||
| Reform | Garry Breitkreuz* | 17,216 | 50.1 | +17.4 | $53,836 | |||
| New Democratic | Evan Carlson | 8,583 | 25.0 | -4.4 | $43,899 | |||
| Liberal | Lloyd Sandercock | 6,481 | 18.9 | -10.6 | $39,999 | |||
| Progressive Conservative | Ivan Daunt | 2,101 | 6.1 | -2.6 | $6,357 | |||
| Total valid votes | 34,381 | 100.0 | – | |||||
| Total rejected ballots | 116 | 0.3 | ||||||
| Turnout | 34,497 | 66.9 | ||||||
| Canadian federal election, 1993 | ||||||||
|---|---|---|---|---|---|---|---|---|
| Party | Candidate | Votes | % | ±% | ||||
| Reform | Garry Breitkreuz | 10,605 | 32.7 | – | ||||
| Liberal | Jim Walters | 9,531 | 29.4 | +15.8 | ||||
| New Democratic | Lorne Nystrom* | 9,487 | 29.2 | -21.9 | ||||
| Progressive Conservative | Bob Reitenbach | 2,825 | 8.7 | -25.9 | ||||
| Total valid votes | 32,448 | 100.0 | ||||||
* Denotes incumbent.
| Canadian federal election, 1988 | ||||||||
|---|---|---|---|---|---|---|---|---|
| Party | Candidate | Votes | % | ±% | ||||
| New Democratic | Lorne Nystrom* | 18,523 | 51.1 | -0.2 | ||||
| Progressive Conservative | Virginia Battiste | 12,543 | 34.6 | +1.2 | ||||
| Liberal | J. Robert Autumn | 5,149 | 14.2 | +0.1 | ||||
| Total valid votes | 36,215 | 100.0 | ||||||
| Canadian federal election, 1984 | ||||||||
|---|---|---|---|---|---|---|---|---|
| Party | Candidate | Votes | % | ±% | ||||
| New Democratic | Lorne Nystrom* | 18,116 | 51.3 | +5.6 | ||||
| Progressive Conservative | Ken Wasylysen | 11,800 | 33.4 | -3.9 | ||||
| Liberal | Arliss Dellow | 4,996 | 14.1 | -2.8 | ||||
| Confederation of Regions | Bill Kruczko | 400 | 1.1 | – | ||||
| Total valid votes | 35,312 | 100.0 | ||||||
| Canadian federal election, 1980 | ||||||||
|---|---|---|---|---|---|---|---|---|
| Party | Candidate | Votes | % | ±% | ||||
| New Democratic | Lorne Nystrom* | 15,240 | 45.7 | -1.8 | ||||
| Progressive Conservative | Ben Hudye | 12,450 | 37.3 | +4.9 | ||||
| Liberal | Gordon Hollinger | 5,664 | 17.0 | +1.3 | ||||
| Total valid votes | 33,354 | 100.0 | ||||||
| Canadian federal election, 1979 | ||||||||
|---|---|---|---|---|---|---|---|---|
| Party | Candidate | Votes | % | ±% | ||||
| New Democratic | Lorne Nystrom | 16,677 | 47.5 | +1.9 | ||||
| Progressive Conservative | John Miller | 11,381 | 32.4 | +10.7 | ||||
| Liberal | Phil Kotyk | 5,501 | 15.7 | -15.4 | ||||
| Independent | Ben Hudye | 1,566 | 4.5 | – | ||||
| Total valid votes | 35,125 | 100.0 | ||||||
| Canadian federal election, 1974 | ||||||||
|---|---|---|---|---|---|---|---|---|
| Party | Candidate | Votes | % | ±% | ||||
| New Democratic | Lorne Nystrom | 14,586 | 45.6 | -2.1 | ||||
| Liberal | Stan Kyba | 9,946 | 31.1 | +2.5 | ||||
| Progressive Conservative | Marvin Wentzell | 6,963 | 21.8 | -0.7 | ||||
| Social Credit | Harry Hoedel | 338 | 1.1 | -0.2 | ||||
| Communist | George Shlakoff | 179 | 0.6 | – | ||||
| Total valid votes | 32,012 | 100.0 | ||||||
| Canadian federal election, 1972 | ||||||||
|---|---|---|---|---|---|---|---|---|
| Party | Candidate | Votes | % | ±% | ||||
| New Democratic | Lorne Nystrom | 15,998 | 47.7 | +8.8 | ||||
| Liberal | Stephanie Potoski | 9,574 | 28.5 | -1.1 | ||||
| Progressive Conservative | Don Armour | 7,542 | 22.5 | -9.0 | ||||
| Social Credit | Harry Hoedel | 425 | 1.3 | – | ||||
| Total valid votes | 33,539 | 100.0 | ||||||
| Canadian federal election, 1968 | ||||||||
|---|---|---|---|---|---|---|---|---|
| Party | Candidate | Votes | % | |||||
| New Democratic | Lorne Nystrom | 13,212 | 38.9 | |||||
| Progressive Conservative | James N. Ormiston | 10,699 | 31.5 | |||||
| Liberal | Peter J. Konkin | 10,068 | 29.6 | |||||
| Total valid votes | 33,979 | 100.0 | ||||||
See also
References
- "(Code 47014) Census Profile". 2011 census. Statistics Canada. 2012. Retrieved 2011-03-03.
- Riding history for Yorkton—Melville (1966– ) from the Library of Parliament
- Expenditures - 2008
- Expenditures - 2004
- Expenditures - 2000
- Expenditures - 1997
Notes
- ↑ Statistics Canada: 2012
- ↑ Statistics Canada: 2012
- ↑ "2Profile of Ethnic Origin and Visible Minorities for Canada, Provinces, Territories and Federal Electoral Districts (2003 Representation Order), 2006 Census". 2.statcan.gc.ca. Retrieved 2012-12-02.
- ↑ Elections Canada – Confirmed candidates for Yorkton—Melville, 30 September 2015
- ↑ Elections Canada – Preliminary Election Expenses Limits for Candidates
- ↑ Pundits' Guide to Canadian Elections
.png)