Calgary Confederation
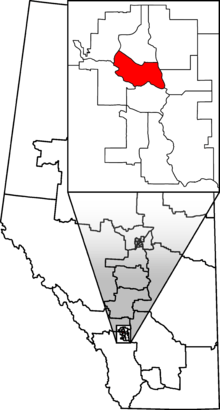 Calgary Confederation in relation to other Alberta federal electoral districts as of the 2013 Representation Order. | |||
| Federal electoral district | |||
| Legislature | House of Commons | ||
| MP |
Conservative | ||
| District created | 2013 | ||
| First contested | 2015 | ||
| District webpage | profile, map | ||
| Demographics | |||
| Population (2011)[1] | 111,785 | ||
| Electors (2015) | 88,854 | ||
| Area (km²)[1] | 54 | ||
| Pop. density (per km²) | 2,070.1 | ||
| Census divisions | Division No. 6 | ||
| Census subdivisions | Calgary | ||
Calgary Confederation is a federal electoral district in Alberta, Canada, that has been represented in the House of Commons of Canada since 2015. It was created in 2012 from the electoral districts of Calgary Centre-North (70%), Calgary West (23%) and Calgary—Nose Hill (8%).[2]
Members of Parliament
This riding has elected the following members of the House of Commons of Canada:
| Parliament | Years | Member | Party | |
|---|---|---|---|---|
| Calgary Confederation Riding created from Calgary Centre-North, Calgary West and Calgary—Nose Hill |
||||
| 42nd | 2015–Present | Len Webber | Conservative | |
Election results
| Canadian federal election, 2015 | ||||||||
|---|---|---|---|---|---|---|---|---|
| Party | Candidate | Votes | % | ±% | Expenditures | |||
| Conservative | Len Webber | 30,669 | 45.91 | –6.52 | $153,636.85 | |||
| Liberal | Matt Grant | 29,083 | 43.53 | +25.89 | $159,579.52 | |||
| New Democratic | Kirk Heuser | 4,770 | 7.14 | –8.69 | $57,375.70 | |||
| Green | Natalie Odd | 2,146 | 3.21 | –10.49 | $21,308.54 | |||
| Marxist–Leninist | Kevan Hunter | 140 | 0.21 | -0.19 | – | |||
| Total valid votes/Expense limit | 66,808 | 100.00 | $228,532.64 | |||||
| Total rejected ballots | 216 | 0.32 | – | |||||
| Turnout | 67,024 | 75.43 | – | |||||
| Eligible voters | 88,854 | |||||||
| Conservative hold | Swing | –16.21 | ||||||
| Source: Elections Canada[3][4] | ||||||||
| 2011 federal election redistributed results[5] | |||
|---|---|---|---|
| Party | Vote | % | |
| Conservative | 26,619 | 52.43 | |
| Liberal | 8,957 | 17.64 | |
| New Democratic | 8,036 | 15.83 | |
| Green | 6,956 | 13.70 | |
| Marxist–Leninist | 202 | 0.40 | |
References
- 1 2 Statistics Canada: 2011
- ↑ Report – Alberta
- ↑ "October 19, 2015 Election Results — Calgary Confederation (Validated results)". Elections Canada. 22 October 2015. Retrieved 4 November 2015.
- ↑ Elections Canada – Preliminary Election Expenses Limits for Candidates Archived 2016-03-04 at the Wayback Machine.
- ↑ Pundits' Guide to Canadian Elections
.png)
.png)
This article is issued from
Wikipedia.
The text is licensed under Creative Commons - Attribution - Sharealike.
Additional terms may apply for the media files.