Portage—Lisgar Manitoba electoral district Manitoba electoral district |
|---|
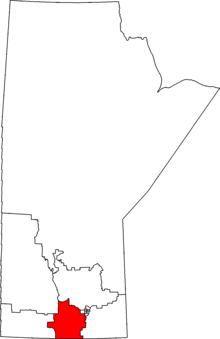 Portage—Lisgar in relation to other Manitoba federal electoral districts as of the 2013 Representation Order. |
| Federal electoral district |
|---|
| Legislature |
House of Commons |
|---|
| MP |
Candice Bergen
Conservative |
|---|
| District created |
1996 |
|---|
| First contested |
1997 |
|---|
| Last contested |
2015 |
|---|
| District webpage |
profile, map |
|---|
| Demographics |
|---|
| Population (2011)[1] |
91,019 |
|---|
| Electors (2015) |
61,350 |
|---|
| Area (km²)[2] |
12,665 |
|---|
| Pop. density (per km²) |
7.2 |
|---|
| Census subdivisions |
Portage la Prairie, Winkler, Morden, Stanley, Macdonald, Rhineland, Altona, Cartier, Carman |
|---|
Portage—Lisgar is a federal electoral district in Manitoba, Canada, that has been represented in the House of Commons of Canada since 1997.
Demographics
| Population, 2001 |
92,863 |
| Electors |
60,246 |
| Area (km²) |
14236.32 |
| Population density (people per km²) |
|
Portage—Lisgar is the riding with the highest percentage of native German speakers (23.6% of the population) in all of Canada.[3] Only Inuktitut (Nunavut: 66.8%) and Panjabi (Punjabi) (Newton—North Delta, in British Columbia: 33.4%) exceed this concentration of native speakers of a non-official language in a single riding.
Election results
| Canadian federal election, 2015 |
| Party |
Candidate |
Votes | % | ±% | Expenditures |
|
Conservative | Candice Bergen | 25,060 | 60.84 | -14.95 | $91,365.21 |
|
Liberal | Ken Werbiski | 10,621 | 25.79 | +19.81 | $12,481.25 |
|
New Democratic | Dean Harder | 2,554 | 6.20 | -4.01 | $7,315.22 |
|
Green | Bev Eert | 1,637 | 3.97 | -1.67 | $7,832.39 |
|
Christian Heritage | Jerome Dondo | 1,315 | 3.19 | +.89 | $20,134.89 |
| Total valid votes/Expense limit |
41,187 | 100.00 | | $208,924.52 |
| Total rejected ballots |
159 | 0.38 | – |
| Turnout |
41,346 | 66.52 | – |
| Eligible voters |
62,153 |
|
Conservative hold |
Swing |
-17.38
|
| Source: Elections Canada[4][5] |
| Canadian federal election, 2008 |
| Party |
Candidate |
Votes | % | ±% | Expenditures |
|
Conservative | Candice Hoeppner | 22,036 | 68.3 | -1.5 | $57,186 |
|
Liberal | Ted Klassen | 4,374 | 13.6 | +2.2 | $19,807 |
|
Green | Charlie Howatt | 2,606 | 8.1 | +3.0 | $3,649 |
|
New Democratic | Mohamed Alli | 2,353 | 7.3 | -4.1 | $2,873 |
|
Christian Heritage | Len Lodder | 911 | 2.8 | +0.1 | $8,429 |
| Total valid votes/Expense limit |
32,280 | 100.0 | | $83,296 |
| Total rejected ballots |
116 | 0.4 | 0.0 |
| Turnout |
32,396 | 53.8 | – |
| Canadian federal election, 2006 |
| Party |
Candidate |
Votes | % | ±% | Expenditures |
|
Conservative | Brian Pallister | 25,719 | 69.8 | +3.9 | $44,321 |
|
Liberal | Garry McLean | 4,199 | 11.4 | -6.3 | $13,875 |
|
New Democratic | Daren Van Den Bussche | 4,072 | 11.0 | +1.7 | $2,450 |
|
Green | Charlie Howatt | 1,880 | 5.1 | +2.6 | $4,073 |
|
Christian Heritage | David Reimer | 987 | 2.7 | -1.5 | $9,372 |
| Total valid votes |
36,857 | 100.00 | | – |
| Total rejected ballots |
123 | 0.3 | -0.1 |
| Turnout |
36,980 | 62 | – |
| Canadian federal election, 2004 |
| Party |
Candidate |
Votes | % | ±% | Expenditures |
|
Conservative | Brian Pallister | 22,939 | 65.9 | +0.1 | $55,524 |
|
Liberal | Don Kuhl | 6,174 | 17.7 | -0.1 | $70,474 |
|
New Democratic | Daren Van Den Bussche | 3,251 | 9.3 | +3.3 | $13,159 |
|
Christian Heritage | David Reimer | 1,458 | 4.2 | – | $10,620 |
|
Green | Marc Payette | 856 | 2.5 | – | $649 |
|
Communist | Allister Cucksey | 117 | 0.3 | – | $741 |
| Total valid votes |
34,795 | 100.0 | | – |
| Total rejected ballots |
146 | 0.4 | +0.1 |
| Turnout |
34,941 | 57.4 | -4.2 |
| Canadian federal election, 2000 |
| Party |
Candidate |
Votes | % | ±% | Expenditures |
|
Alliance | Brian Pallister | 17,318 | 50.3 | +10.1 | $44,417 |
|
Liberal | Gerry J.E. Gebler | 6,133 | 17.8 | +3.2 | $44,267 |
|
Progressive Conservative | Morley McDonald | 5,339 | 15.5 | -20.4 | $16,872 |
|
Independent | Jake Hoeppner | 3,558 | 10.3 | – | $40,395 |
|
New Democratic | Diane Beresford | 2,073 | 6.0 | -1.2 | $3,880 |
| Total valid votes |
34,421 | 100.0 | | – |
| Total rejected ballots |
101 | 0.3 | -0.2 |
| Turnout |
34,522 | 61.6 | +0.9 |
| Canadian federal election, 1997 |
| Party |
Candidate |
Votes | % | ±% | Expenditures |
|
Reform | Jake Hoeppner | 13,532 | 40.2 | – | $55,221 |
|
Progressive Conservative | Brian Pallister | 12,083 | 35.9 | – | $52,473 |
|
Liberal | Heather Mack | 4,913 | 14.6 | – | $14,412 |
|
New Democratic | Glen Hallick | 2,420 | 7.2 | – | $9,391 |
|
Christian Heritage | Martin Dewit | 517 | 1.5 | – | $2,674 |
|
Canadian Action | Roy Lyall | 159 | 0.5 | – | $1,210 |
| Total valid votes |
33,624 | 100.0 | | – |
| Total rejected ballots |
149 | 0.4 | – |
| Turnout |
33,773 | 60.6 | – |