Battlefords—Lloydminster
Battlefords—Lloydminster is a federal electoral district in Saskatchewan, Canada, that has been represented in the House of Commons of Canada since 1997.
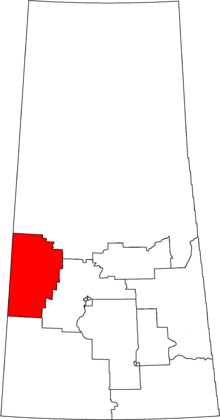
Geography
The district is in Central-Western Saskatchewan. It includes the communities of North Battleford, Battleford and Unity; as well as the Saskatchewan portion of Lloydminster.
Demographics
- According to the Canada 2011 Census[3][4]
Ethnic groups: 74.7% White, 22.2% Indigenous, 1.6% Filipino, 1.5% Other
Languages: 87.4% English, 4.5% Cree, 2.5% German, 1.4% French, 1.0% Tagalog, 3.2% Other
Religions: 71.4% Christian, 3.6% Traditional (Aboriginal) Spirituality, 0.8% Other, 24.2% None
Median income: $29,976 (2010)
Average income: $37,724 (2010)
History
The electoral district was created in 1996 from Kindersley—Lloydminster and The Battlefords—Meadow Lake ridings.
This riding lost territory to Cypress Hills—Grasslands and gained a fraction of territory from Saskatoon—Rosetown—Biggar during the 2012 electoral redistribution.
Members of Parliament
This riding has elected the following member of the House of Commons of Canada:
| Battlefords—Lloydminster | ||||
|---|---|---|---|---|
| Parliament | Years | Member | Party | |
| Riding created from Kindersley—Lloydminster and The Battlefords—Meadow Lake |
||||
| 36th | 1997–2000 | Gerry Ritz | Reform | |
| 2000–2000 | Alliance | |||
| 37th | 2000–2003 | |||
| 2003–2004 | Conservative | |||
| 38th | 2004–2006 | |||
| 39th | 2006–2008 | |||
| 40th | 2008–2011 | |||
| 41st | 2011–2015 | |||
| 42nd | 2015–2017 | |||
| 2017–Present | Rosemarie Falk | |||
Election results
On November 5, 2017, Prime Minister Justin Trudeau announced a by-election will be held on December 11, 2017.[5]
| Canadian federal by-election, December 11, 2017 Resignation of Gerry Ritz | ||||||||
|---|---|---|---|---|---|---|---|---|
| Party | Candidate | Votes | % | ±% | ||||
| Conservative | Rosemarie Falk | 8,965 | 69.56 | +8.55 | ||||
| New Democratic | Matt Fedler | 1,698 | 13.17 | -4.44 | ||||
| Liberal | Larry Ingram | 1,345 | 10.44 | -6.04 | ||||
| Independent | Ken Finlayson | 681 | 5.28 | |||||
| Green | Yvonne Potter-Pihach | 200 | 1.55 | -0.16 | ||||
| Total valid votes/Expense limit | 12,889 | 100.00 | ||||||
| Total rejected ballots | ||||||||
| Turnout | 12,889 | 27.05 | -39.46 | |||||
| Eligible voters | 47,651 | |||||||
| Conservative hold | Swing | +6.49 | ||||||
| Canadian federal election, 2015 | ||||||||
|---|---|---|---|---|---|---|---|---|
| Party | Candidate | Votes | % | ±% | Expenditures | |||
| Conservative | Gerry Ritz | 20,547 | 61.01 | -4.94 | $70,973.30 | |||
| New Democratic | Glenn Tait | 5,930 | 17.61 | -10.45 | $6,284.73 | |||
| Liberal | Larry Ingram | 5,550 | 16.48 | +13.10 | $17,912.01 | |||
| Independent | Doug Anguish | 1,076 | 3.19 | n/a | – | |||
| Green | Mikaela Tenkink | 575 | 1.71 | -0.90 | $56.97 | |||
| Total valid votes/Expense limit | 33,678 | 99.45 | $214,778.83 | |||||
| Total rejected ballots | 186 | 0.55 | – | |||||
| Turnout | 33,864 | 66.51 | – | |||||
| Eligible voters | 50,917 | |||||||
| Conservative hold | Swing | +2.76 | ||||||
| Source: Elections Canada[6][7] | ||||||||
| 2011 federal election redistributed results[8] | |||
|---|---|---|---|
| Party | Vote | % | |
| Conservative | 17,168 | 65.95 | |
| New Democratic | 7,304 | 28.06 | |
| Liberal | 881 | 3.38 | |
| Green | 680 | 2.61 | |
| Canadian federal election, 2011 | ||||||||
|---|---|---|---|---|---|---|---|---|
| Party | Candidate | Votes | % | ±% | Expenditures | |||
| Conservative | (x) Gerry Ritz | 19,203 | 66.9 | +6.8 | $57,125 | |||
| New Democratic | Glenn Tait | 7,767 | 27.1 | +1.8 | $57,552 | |||
| Liberal | Jordan LaPlante | 950 | 3.3 | -4.9 | $4,043 | |||
| Green | Norbert Kratchmer | 785 | 2.7 | -2.3 | $345 | |||
| Total valid votes/Expense limit | 28,705 | 100.0 | – | |||||
| Total rejected ballots | 109 | 0.4 | 0.0 | |||||
| Turnout | 28,814 | 58.2 | +7 | |||||
| Eligible voters | 49,530 | – | – | |||||
| Canadian federal election, 2008 | ||||||||
|---|---|---|---|---|---|---|---|---|
| Party | Candidate | Votes | % | ±% | Expenditures[9] | |||
| Conservative | (x) Gerry Ritz | 15,621 | 60.1 | +6.1 | $60,942 | |||
| New Democratic | Bob Woloshyn | 6,572 | 25.3 | +9.6 | $52,759 | |||
| Liberal | Greg Nyholt | 2,140 | 8.2 | -4.6 | – | |||
| Green | Norbert Kratchmer | 1,287 | 5.0 | +2.9 | $4,638 | |||
| Christian Heritage | Harold Stephan | 368 | 1.4 | +0.4 | $6 | |||
| Total valid votes/Expense limit | 25,988 | 100.0 | $87,340 | |||||
| Total rejected ballots | 96 | 0.4 | +0.1 | |||||
| Turnout | 26,084 | 51 | -9 | |||||
| Canadian federal election, 2006 | ||||||||
|---|---|---|---|---|---|---|---|---|
| Party | Candidate | Votes | % | ±% | Expenditures | |||
| Conservative | (x) Gerry Ritz | 16,491 | 54.1 | -4.2 | $54,526 | |||
| New Democratic | Elgin Wyatt | 4,829 | 15.7 | -4.6 | $20,468 | |||
| Independent | Jim Pankiw | 4,396 | 14.4 | – | $77,133 | |||
| Liberal | Dominic LaPlante | 3,901 | 12.8 | -4.6 | – | |||
| Green | Norbert Kratchmer | 637 | 2.1 | -0.8 | $145 | |||
| Christian Heritage | Harold Stephan | 306 | 1.0 | -0.2 | $562 | |||
| Total valid votes | 30,560 | 100.0 | – | |||||
| Total rejected ballots | 89 | 0.3 | -0.1 | |||||
| Turnout | 30,649 | 60 | +8 | |||||
| Canadian federal election, 2004 | ||||||||
|---|---|---|---|---|---|---|---|---|
| Party | Candidate | Votes | % | ±% | Expenditures | |||
| Conservative | (x) Gerry Ritz | 15,441 | 58.3 | -7.0 | $45,813 | |||
| New Democratic | Shawn McKee | 5,367 | 20.2 | +2.9 | $41,961 | |||
| Liberal | Del Price | 4,617 | 17.4 | +0.1 | $32,265 | |||
| Green | Kelsey Pearson | 766 | 2.9 | – | ||||
| Christian Heritage | Diane Stephan | 316 | 1.2 | – | ||||
| Total valid votes | 26,507 | 100.0 | – | |||||
| Total rejected ballots | 94 | 0.4 | ||||||
| Turnout | 26,601 | 52 | -8.3 | |||||
| Canadian federal election, 2000 | ||||||||
|---|---|---|---|---|---|---|---|---|
| Party | Candidate | Votes | % | ±% | Expenditures | |||
| Alliance | (x) Gerry Ritz | 17,691 | 60.2 | +17.5 | $43,761 | |||
| New Democratic | Elgin Wayne Wyatt | 5,107 | 17.4 | -10.4 | $22,558 | |||
| Liberal | Peter Frey | 5,098 | 17.4 | -2.7 | $15,510 | |||
| Progressive Conservative | Harry Zamonsky | 1,474 | 5.0 | -4.4 | $3,102 | |||
| Total valid votes | 29,370 | 100.0 | – | |||||
| Total rejected ballots | 107 | 0.4 | ||||||
| Turnout | 29,477 | 60 | -3.3 | |||||
| Canadian federal election, 1997 | ||||||||
|---|---|---|---|---|---|---|---|---|
| Party | Candidate | Votes | % | ±% | Expenditures | |||
| Reform | Gerry Ritz | 13,125 | 42.7 | – | $37,206 | |||
| New Democratic | (x) Len Taylor | 8,535 | 27.8 | – | $49,152 | |||
| Liberal | Glenn Hornick | 6,155 | 20.0 | – | $43,136 | |||
| Progressive Conservative | Ken Ritter | 2,888 | 9.4 | – | $22,635 | |||
| Total valid votes | 30,703 | 100.0 | – | |||||
| Total rejected ballots | 91 | 0.3 | ||||||
| Turnout | 30,794 | 63 | ||||||
See also
References
- "(Code 47001) Census Profile". 2011 census. Statistics Canada. 2012. Retrieved 2011-03-03.
Notes
- ↑ Statistics Canada: 2017
- ↑ Statistics Canada: 2017
- ↑ http://www12.statcan.gc.ca/nhs-enm/2011/dp-pd/prof/details/page.cfm?Lang=E&Geo1=FED2013&Code1=47001&Data=Count&SearchText=battlefords&SearchType=Begins&SearchPR=01&A1=All&B1=All&Custom=&TABID=1
- ↑ http://www12.statcan.gc.ca/nhs-enm/2011/dp-pd/prof/details/page.cfm?Lang=E&Geo1=FED2013&Code1=47001&Data=Count&SearchText=battlefords&SearchType=Begins&SearchPR=01&A1=All&B1=All&Custom=&TABID=1
- ↑ "Prime Minister of Canada announces by-elections". Prime Minister's Office. November 5, 2017.
- ↑ Elections Canada – Confirmed candidates for Battlefords—Lloydminster, 30 September 2015
- ↑ Elections Canada – Preliminary Election Expenses Limits for Candidates Archived 15 August 2015 at the Wayback Machine.
- ↑ Pundits' Guide to Canadian Elections
- ↑ http://www.cbc.ca/news/canadavotes/map/2008/fullscreen.html#228
.png)