Portuguese local elections, 1976
|
| ||||||||||||||||||||||||||||||||||||||||||||||||||
| ||||||||||||||||||||||||||||||||||||||||||||||||||
All 304 Portuguese municipalities and 4,260 Portuguese Parishes All 1,908 local government councils | ||||||||||||||||||||||||||||||||||||||||||||||||||
|---|---|---|---|---|---|---|---|---|---|---|---|---|---|---|---|---|---|---|---|---|---|---|---|---|---|---|---|---|---|---|---|---|---|---|---|---|---|---|---|---|---|---|---|---|---|---|---|---|---|---|
| Turnout | 64.7% | |||||||||||||||||||||||||||||||||||||||||||||||||
| ||||||||||||||||||||||||||||||||||||||||||||||||||
.jpg)
.jpg)
.jpg)

| This article is part of the series: |
| Politics and government of Portugal |
|---|
 |
| Portugal |
The Portuguese local elections of 1976 took place on 12 December. They were the first local elections in Portugal. The democratic revolution of 1974 introduced the concept of democratic local power, that should be exerted by the citizens in their towns and cities.
The elections were meant to elect for the first time the administration of the about 300 municipalities of the country and of the about 4000 parishes that composed those 300 municipalities. They consisted of three elections in each of the municipalities; the election for the municipal chamber, the election for the municipal assembly and the lower-level election for the parish assembly.
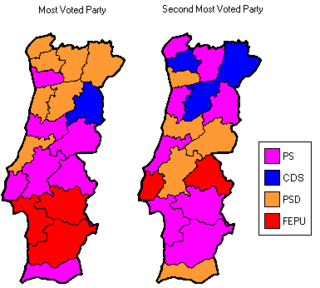
The Socialist Party gathered the majority of the voting and mandates, beating the Social Democratic Party, although both parties tied in number of elected mayors, 115. The Communists led coalition, the Electoral Front United People, dominated the election in the South of the country. The right-wing Democratic Social Center achieved its best result ever in local elections.
Turnout in these elections was quite low, as 64.7% of the electorate cast a ballot, compared with the 83.5% turnout rate of the 1976 general elections in April.
Parties
The main political forces involved in the election:
- Democratic and Social Center (CDS)
- Electoral Front United People (FEPU)
- Groups for the Dinamization of the People's Unity (GDUPs)
- Socialist Party (PS)
- Social Democratic Party (PSD)
National summary of votes and seats
Municipal Councils
| Parties | Votes | % | Candidacies | Councillors | Mayors | ||||
|---|---|---|---|---|---|---|---|---|---|
| # | # | ||||||||
| Socialist | 1,377,684 | 33.01 | 691 | 115 | |||||
| Social Democratic | 1,014,092 | 24.30 | 624 | 115 | |||||
| Electoral Front United People | 720,499 | 17.26 | 268 | 37 | |||||
| Democratic and Social Centre | 693,766 | 16.62 | 317 | 36 | |||||
| GDUPs | 103,784 | 2.49 | 5 | 0 | |||||
| Portuguese Workers' Communist | 27,505 | 0.59 | 0 | 0 | |||||
| PCP(m-l) | 15,267 | 0.37 | 0 | 0 | |||||
| People's Monarchist | 7,528 | 0.18 | 3 | 1 | |||||
| Internationalist Communist League | 3,464 | 0.08 | 0 | 0 | |||||
| Workers' Revolutionary | 273 | 0.00 | 0 | 0 | |||||
| United People Alliance | 123 | 0.00 | 0 | 0 | |||||
| Total valid | 3,995,905 | 96.40 | — | 1,908 | 304 | ||||
| Blank ballots | 89,073 | 2.13 | |||||||
| Invalid ballots | 88,783 | 2.13 | |||||||
| Total (turnout 64.66%) | 4,173,761 | 100.00 | |||||||
Municipal Assemblies
| Parties | Votes | % | Candidacies | Mandates | |||||
|---|---|---|---|---|---|---|---|---|---|
| # | |||||||||
| Socialist | 1,392,181 | 33.39 | 1,698 | ||||||
| Social Democratic | 1,022,168 | 24.52 | 1,658 | ||||||
| Electoral Front United People | 756,856 | 18.15 | 679 | ||||||
| Democratic and Social Centre | 685,574 | 16.44 | 1,053 | ||||||
| GDUPs | 100,872 | 2.42 | 43 | ||||||
| PCP(m-l) | 5,363 | 0.13 | 2 | ||||||
| Portuguese Workers' Communist | 5,214 | 0.13 | 0 | ||||||
| People's Monarchist | 3,695 | 0.09 | 2 | ||||||
| Workers' Revolutionary | 2,634 | 0.06 | 0 | ||||||
| Christian Democratic | 970 | 0.02 | 0 | ||||||
| Total valid | 3,975,596 | 95.36 | — | 5,135 | |||||
| Blank ballots | 104,185 | 2.50 | |||||||
| Invalid ballots | 89,241 | 2.26 | |||||||
| Total (turnout 64.60%) | 4,169,022 | 100.00 | |||||||
Parish Assemblies
| Parties | Votes | % | Candidacies | Mandates | Presidents | ||||
|---|---|---|---|---|---|---|---|---|---|
| # | # | ||||||||
| Socialist | 1,339,460 | 32.69 | 8,345 | ||||||
| Social Democratic | 996,972 | 24.33 | 9,076 | ||||||
| Electoral Front United People | 629,812 | 15.37 | 2,291 | ||||||
| Democratic and Social Centre | 617,690 | 15.07 | 5,077 | ||||||
| Independents | 162,367 | 3.96 | 1,230 | ||||||
| GDUPs | 93,967 | 2.29 | 99 | ||||||
| Portuguese Workers' Communist | 13,721 | 0.33 | 2 | ||||||
| People's Monarchist | 1,788 | 0.04 | 12 | ||||||
| PCP(m-l) | 1,666 | 0.04 | 3 | ||||||
| Internationalist Communist League | 71 | 0.00 | 0 | ||||||
| Total valid | 3,915,120 | 95.55 | — | 26,135 | ' | ||||
| Blank ballots | 88,985 | 2.17 | |||||||
| Invalid ballots | 93,461 | 2.28 | |||||||
| Total (turnout 65.60%) | 4,097,566 | 100.00 | |||||||
End notes
- The source of the voting data is the Portuguese Electoral Commission
Further Notes:
- Electoral Front United People (FEPU) was composed by the Portuguese Communist Party (PCP), the Portuguese Democratic Movement (MDP/CDE) and the People's Socialist Front (FSP).
- The number of candidacies expresses the number of municipalities or parishes in which the party or coalition presented lists.
- The number of mandates expresses the number of municipal deputies in the Municipal Assembly election and the number of parish deputies in the Parish Assembly election.
- The turnout varies because one may choose not to vote for all the organs.
References
- "CNE Resultados". Comissão Nacional de Eleições. Retrieved 17 January 2006.
- "Centro de Estudos do Pensamento Político". Retrieved 17 January 2006.
| Presidential elections | |
|---|---|
| Parliamentary elections |
|
| Local elections | |
| European elections | |
| Referendums | |
| |