List of countries by greenhouse gas emissions per capita
This is a list of countries by total greenhouse gas (GHG) emissions per capita by year. It is based on data for carbon dioxide, methane, nitrous oxide, perfluorocarbon, hydrofluorocarbon, and sulfur hexafluoride emissions compiled by the World Resources Institute, divided by the population estimate by the United Nations (for July 1) of the same year.[1] The emissions data do not include land-use change and forestry.
List of countries by emissions
| Country | 1990 | 1995 | 2000 | 2005 | 2010 | 2013 |
|---|---|---|---|---|---|---|
| 37.32 | 73.13 | 65.64 | 76.41 | 62.47 | 54.41 | |
| 48.33 | 46.38 | 46.49 | 44.83 | 46.88 | 46.84 | |
| 16.4 | 16.8 | 19.05 | 24.3 | 28.65 | 45.6 | |
| 29.75 | 37.3 | 41.58 | 52.1 | 39.13 | 36.82 | |
| 29.05 | 29.84 | 28.55 | 28.11 | 28.29 | 28.15 | |
| 22.0 | 22.92 | 27.97 | 25.84 | 27.82 | 27.43 | |
| 27.27 | 29.64 | 29.19 | 27.78 | 24.4 | 25.4 | |
| 28.06 | 27.28 | 30.84 | 27.6 | 25.39 | 25.06 | |
| 40.13 | 38.81 | 34.89 | 32.13 | 23.73 | 24.59 | |
| 21.16 | 19.43 | 18.66 | 20.91 | 22.63 | 21.47 | |
| 20.22 | 20.69 | 22.12 | 21.94 | 20.47 | 20.94 | |
| 13.39 | 14.51 | 18.13 | 19.44 | 20.93 | ||
| 21.14 | 27.86 | 23.82 | 20.72 | |||
| 23.23 | 23.26 | 23.86 | 22.92 | 20.97 | 19.9 | |
| 0.52 | 2.7 | 13.89 | 25.83 | 21.33 | 19.15 | |
| 12.31 | 11.22 | 12.42 | 16.4 | 19.11 | 19.15 | |
| 16.29 | 16.63 | 17.28 | 17.82 | 18.39 | 18.89 | |
| 11.49 | 13.29 | 13.39 | 14.67 | 17.69 | 18.26 | |
| 14.43 | 10.37 | 13.73 | 17.28 | 18.23 | ||
| 14.4 | 13.53 | 15.77 | 17.3 | 17.66 | ||
| 6.98 | 6.74 | 10.3 | 11.64 | 17.03 | ||
| 19.01 | 18.27 | 18.4 | 18.77 | 16.86 | 16.62 | |
| 14.45 | 13.92 | 14.7 | 15.21 | 15.31 | ||
| 12.81 | 11.28 | 11.48 | 10.13 | 10.91 | 13.47 | |
| 6.77 | 9.45 | 10.77 | 11.24 | 13.02 | 13.43 | |
| 15.04 | 15.76 | 17.39 | 16.77 | 13.57 | 12.65 | |
| 11.01 | 10.38 | 11.69 | 12.17 | 12.64 | 12.53 | |
| 14.75 | 14.62 | 13.9 | 13.26 | 14.2 | 11.69 | |
| 9.4 | 10.9 | 11.82 | 11.34 | 11.74 | 11.46 | |
| 14.05 | 13.76 | 13.47 | 12.39 | 11.42 | ||
| 6.31 | 6.53 | 7.08 | 8.77 | 10.69 | 11.22 | |
| 13.18 | 13.93 | 12.85 | 12.4 | 12.01 | 11.09 | |
| 14.59 | 12.9 | 11.89 | 11.36 | 11.03 | 11.0 | |
| 12.21 | 11.98 | 11.8 | 11.28 | 10.78 | 10.94 | |
| 9.4 | 9.91 | 10.04 | 10.16 | 9.54 | 10.55 | |
| 5.72 | 6.79 | 7.91 | 9.33 | 9.94 | 10.2 | |
| 13.26 | 12.16 | 11.44 | 10.17 | |||
| 8.38 | 9.15 | 8.83 | 9.6 | 9.71 | 9.98 | |
| 10.28 | 11.82 | 11.88 | 9.48 | 9.84 | 9.88 | |
| 8.23 | 7.84 | 8.63 | 9.66 | 9.55 | ||
| 8.18 | 7.77 | 7.71 | 9.23 | 9.5 | 9.49 | |
| 11.23 | 10.7 | 9.4 | 9.6 | 9.82 | 9.43 | |
| 12.97 | 14.24 | 12.48 | 11.59 | 11.03 | 9.38 | |
| 4.46 | 5.9 | 6.69 | 8.08 | 9.03 | 9.26 | |
| 10.69 | 10.59 | 10.48 | 10.41 | 10.09 | 9.18 | |
| 9.71 | 9.55 | 9.59 | 10.79 | 9.85 | 9.15 | |
| 8.31 | 6.69 | 6.32 | 6.03 | 7.58 | 9.04 | |
| 12.06 | 10.27 | 11.15 | 10.43 | 8.9 | 8.96 | |
| 8.62 | 8.73 | 8.7 | 8.85 | 9.08 | 8.85 | |
| 8.92 | 9.01 | 9.67 | 9.3 | 8.72 | ||
| 2.69 | 3.39 | 3.49 | 5.5 | 7.43 | 8.49 | |
| 12.9 | 11.63 | 11.0 | 10.53 | 9.03 | 8.45 | |
| 8.92 | 6.48 | 7.87 | 6.42 | 7.52 | 8.4 | |
| 10.41 | 8.25 | 8.54 | 8.13 | 8.33 | ||
| 4.77 | 5.47 | 5.95 | 6.57 | 7.01 | 8.04 | |
| 1.81 | 5.34 | 6.0 | 7.36 | 7.89 | ||
| 7.12 | 7.25 | 7.49 | 7.73 | 7.77 | 7.86 | |
| 9.39 | 9.71 | 10.53 | 10.73 | 9.0 | 7.68 | |
| 2.94 | 3.38 | 7.86 | 8.45 | 8.28 | 7.65 | |
| 11.24 | 8.28 | 7.16 | 8.03 | 8.0 | 7.55 | |
| 7.9 | 8.4 | 7.85 | 7.55 | 7.52 | ||
| 9.36 | 8.48 | 8.68 | 7.9 | 7.43 | ||
| 7.5 | 6.79 | 6.61 | 6.36 | 7.43 | ||
| 8.6 | 8.69 | 9.17 | 9.49 | 8.02 | 7.05 | |
| 7.0 | 7.01 | 6.24 | 7.77 | 7.48 | 7.04 | |
| 8.65 | 8.39 | 8.37 | 8.13 | 7.34 | 6.9 | |
| 6.54 | 6.62 | |||||
| 6.91 | 7.54 | 8.99 | 9.62 | 7.27 | 6.57 | |
| 6.07 | 5.55 | 6.51 | 6.65 | 6.45 | ||
| 5.74 | 6.85 | 6.5 | 6.5 | 6.5 | 6.44 | |
| 7.77 | 7.33 | 7.16 | 7.21 | 6.77 | 6.34 | |
| World | 5.62 | 5.4 | 5.41 | 5.85 | 6.15 | 6.27 |
| 5.43 | 4.66 | 5.47 | 6.29 | 6.2 | ||
| 7.27 | 7.75 | 5.67 | 5.63 | 5.9 | 6.18 | |
| 9.12 | 8.45 | 8.25 | 5.58 | 9.32 | 6.07 | |
| 3.91 | 4.02 | 4.57 | 5.33 | 5.81 | 6.07 | |
| 6.59 | 7.3 | 8.19 | 8.53 | 7.92 | 6.06 | |
| 4.29 | 4.43 | 4.2 | 5.06 | 6.32 | 5.99 | |
| 5.0 | 5.1 | 5.74 | 6.28 | 6.19 | 5.98 | |
| 3.53 | 3.95 | 4.47 | 4.69 | 5.35 | 5.93 | |
| 5.67 | 6.61 | 7.6 | 7.76 | 6.14 | 5.89 | |
| 5.25 | 5.71 | 5.08 | 4.92 | 5.56 | 5.81 | |
| 8.5 | 7.05 | 7.02 | 7.28 | 6.36 | 5.78 | |
| 4.64 | 5.41 | 6.4 | 5.99 | 5.49 | ||
| 10.12 | 7.31 | 5.84 | 6.29 | 5.67 | 5.46 | |
| 2.69 | 3.8 | 3.85 | 4.67 | 5.1 | 5.42 | |
| 5.81 | 5.4 | |||||
| 3.71 | 4.18 | 4.8 | 4.66 | 5.18 | 5.39 | |
| 3.29 | 4.37 | 4.4 | 4.11 | 4.79 | 5.35 | |
| 7.9 | 8.18 | 7.53 | 7.0 | 6.25 | 5.29 | |
| 2.75 | 5.39 | 5.53 | 4.86 | 5.5 | 5.11 | |
| 3.73 | 3.92 | 4.12 | 4.43 | 4.73 | 5.03 | |
| 3.5 | 3.42 | 3.75 | 4.04 | 4.58 | 4.88 | |
| 5.17 | 5.41 | 5.31 | 5.05 | 5.21 | 4.87 | |
| 14.23 | 11.02 | 8.86 | 6.71 | 4.94 | 4.53 | |
| 2.02 | 2.29 | 3.31 | 3.71 | 4.33 | 4.52 | |
| 3.04 | 3.49 | 3.38 | 3.78 | 4.38 | 4.5 | |
| 2.93 | 3.37 | 3.37 | 3.83 | 4.24 | 4.45 | |
| 3.83 | 3.9 | 4.38 | 4.57 | 4.27 | ||
| 5.02 | 3.43 | 3.89 | 3.54 | 4.33 | 4.08 | |
| 6.99 | 6.67 | 4.77 | 4.21 | 3.74 | 4.05 | |
| 4.08 | 4.13 | 4.14 | 4.13 | 4.26 | 4.02 | |
| 2.4 | 2.56 | 2.62 | 2.85 | 3.07 | 3.92 | |
| 6.43 | 5.91 | 5.4 | 4.77 | 4.13 | 3.85 | |
| 2.85 | 3.12 | 2.89 | 3.21 | 3.6 | 3.72 | |
| 4.87 | 4.85 | 3.82 | 4.28 | 3.66 | 3.66 | |
| 2.88 | 2.78 | 2.61 | 2.91 | 3.66 | ||
| 3.4 | 3.5 | 3.27 | 3.21 | 3.3 | 3.37 | |
| 2.44 | 2.66 | 3.01 | 3.13 | 3.45 | 3.33 | |
| 3.67 | 4.04 | 4.4 | 4.53 | 3.17 | 3.33 | |
| 4.35 | 4.64 | 4.46 | 4.87 | 4.31 | 3.32 | |
| 5.18 | 4.2 | 3.36 | 3.58 | 3.31 | 3.31 | |
| 2.36 | 2.52 | 2.89 | 3.04 | 3.36 | 3.24 | |
| 2.12 | 2.63 | 3.21 | 3.03 | 3.28 | 3.23 | |
| 2.38 | 2.53 | 2.32 | 2.9 | 3.04 | 3.13 | |
| 2.15 | 2.13 | 2.41 | 2.96 | 3.18 | 3.03 | |
| 1.94 | 1.82 | 2.3 | 2.46 | 2.97 | ||
| 2.1 | 2.43 | 2.55 | 2.69 | 2.87 | 2.95 | |
| 2.68 | 2.77 | 2.52 | 2.71 | 2.83 | 2.93 | |
| 0.84 | 1.19 | 1.83 | 2.1 | 2.69 | 2.86 | |
| 3.56 | 2.15 | 2.36 | 2.68 | 2.83 | 2.85 | |
| 3.08 | 2.81 | 3.06 | 2.94 | 2.9 | 2.84 | |
| 1.94 | 2.07 | 2.27 | 2.34 | 2.77 | 2.82 | |
| 4.12 | 2.6 | 2.91 | 3.02 | 2.82 | ||
| 1.03 | 1.25 | 1.63 | 2.16 | 2.8 | 2.81 | |
| 2.06 | 1.85 | 1.97 | 2.16 | 2.73 | ||
| 2.17 | 2.13 | 2.28 | 2.39 | 2.54 | 2.67 | |
| 3.04 | 3.07 | 2.85 | 2.5 | 2.79 | 2.66 | |
| 7.68 | 4.92 | 4.12 | 4.27 | 3.83 | 2.55 | |
| 1.41 | 1.9 | 2.09 | 2.64 | 2.65 | 2.53 | |
| 2.12 | 2.15 | 2.13 | 2.49 | 2.36 | 2.44 | |
| 2.26 | 1.94 | 2.33 | 2.43 | 2.42 | 2.37 | |
| 1.53 | 1.64 | 1.76 | 2.07 | 2.23 | 2.33 | |
| 1.37 | 1.48 | 1.59 | 1.72 | 2.11 | 2.28 | |
| 2.31 | 2.07 | 2.63 | 2.39 | 2.3 | 2.25 | |
| 2.6 | 2.37 | 2.43 | 2.87 | 2.28 | 2.17 | |
| 2.09 | 2.68 | 2.31 | 2.22 | 2.08 | 2.16 | |
| 1.18 | 1.11 | 1.16 | 1.74 | 2.04 | 1.99 | |
| 1.37 | 1.52 | 1.6 | 1.78 | 1.84 | 1.92 | |
| 1.36 | 1.68 | 1.72 | 1.55 | 1.46 | 1.91 | |
| 1.3 | 1.38 | 1.64 | 1.8 | 1.79 | 1.87 | |
| 1.28 | 1.68 | 1.76 | 2.02 | 1.96 | 1.85 | |
| 3.25 | 2.62 | 2.47 | 1.93 | 1.81 | 1.82 | |
| 1.75 | 1.69 | 1.84 | 1.88 | 1.89 | 1.8 | |
| 1.74 | 1.67 | 1.49 | 1.63 | 1.83 | 1.8 | |
| 1.43 | 1.54 | 1.6 | 1.72 | 1.8 | 1.8 | |
| 1.81 | 1.67 | 1.72 | 1.79 | 1.82 | 1.77 | |
| 2.11 | 2.04 | 1.94 | 2.05 | 1.79 | 1.77 | |
| 1.44 | 1.41 | 1.44 | 1.54 | 1.66 | 1.77 | |
| 1.45 | 1.68 | 1.73 | 1.67 | 1.65 | 1.74 | |
| 1.23 | 1.41 | 1.63 | 1.71 | 1.64 | 1.71 | |
| 1.52 | 1.52 | 1.51 | 1.49 | 1.51 | 1.55 | |
| 1.64 | 1.56 | 1.39 | 1.55 | 1.46 | 1.54 | |
| 1.07 | 1.69 | 1.41 | 1.88 | 1.67 | 1.46 | |
| 1.91 | 1.84 | 1.44 | 1.44 | 1.37 | 1.46 | |
| 1.35 | 1.4 | 1.43 | 1.44 | 1.49 | 1.44 | |
| 1.96 | 1.95 | 1.63 | 1.44 | 1.44 | ||
| 1.25 | 1.19 | 1.21 | 1.27 | 1.41 | 1.43 | |
| 1.24 | 0.84 | 0.82 | 0.76 | 1.06 | 1.4 | |
| 0.99 | 1.0 | 1.15 | 1.33 | 1.41 | 1.39 | |
| 1.25 | 1.29 | 1.27 | 1.42 | 1.38 | 1.38 | |
| 1.54 | 1.29 | 1.14 | 1.13 | 1.41 | 1.34 | |
| 1.11 | 1.09 | 1.16 | 1.31 | 1.3 | ||
| 1.07 | 1.11 | 1.16 | 1.12 | 1.22 | 1.29 | |
| 1.28 | 0.98 | 1.04 | 1.1 | 1.25 | ||
| 1.01 | 0.88 | 1.01 | 1.16 | 1.21 | 1.22 | |
| 1.22 | 1.18 | 1.13 | 1.04 | 1.18 | 1.17 | |
| 0.85 | 0.85 | 0.96 | 1.03 | 1.04 | 1.17 | |
| 0.63 | 0.73 | 0.79 | 1.1 | 1.43 | 1.15 | |
| 1.99 | 1.77 | 1.53 | 1.36 | 1.24 | 1.15 | |
| 1.38 | 1.23 | 1.03 | 1.09 | 1.09 | 1.04 | |
| 0.8 | 0.81 | 0.81 | 0.85 | 1.0 | 1.04 | |
| 0.83 | 0.85 | 0.77 | 0.9 | 0.96 | 1.01 | |
| 1.11 | 1.03 | 0.99 | 0.98 | 1.01 | 0.99 | |
| 0.89 | 0.87 | 0.73 | 0.8 | 0.83 | 0.97 | |
| 0.93 | 0.75 | 0.94 | 0.97 | 1.01 | 0.93 | |
| 0.82 | 0.78 | 0.73 | 0.8 | 0.92 | 0.89 | |
| 0.49 | 0.47 | 0.59 | 0.88 | 0.81 | 0.77 | |
| 0.66 | 0.65 | 0.76 | 0.81 | 0.78 | 0.77 | |
| 0.95 | 0.64 | 0.58 | 0.53 | 0.59 | 0.61 | |
| 0.52 | 0.63 | 0.54 | 0.56 | 0.61 | 0.6 | |
| 0.98 | 0.78 | 0.65 | 0.65 | 0.59 | 0.55 | |
| 0.56 | 0.53 | 0.52 | 0.47 | 0.5 | 0.54 | |
| 0.57 | 0.45 | 0.41 | 0.48 | 0.48 | 0.5 | |
| 0.42 | 0.42 | 0.35 | 0.26 | 0.29 | 0.32 |
Gallery
Per capita GHG emissions in 2005, including land-use change

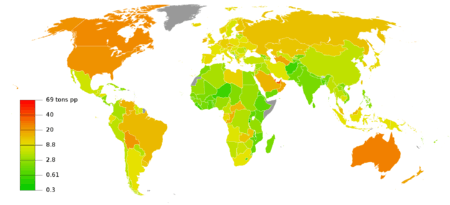
Per capita GHG emissions in 2000, not including land-use change
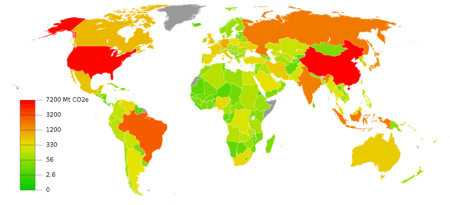
GHG emissions by country in 2005, including land-use change
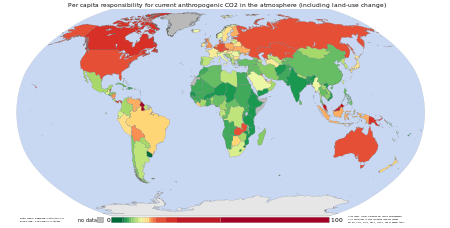
Per capita responsibility for current atmospheric carbon dioxide level, including land-use change
See also
References
- ↑ "Climate Analysis Indicators Tool (CAIT) Version 2.0. (Washington, DC: World Resources Institute, 2014)". World Resources Institute. Retrieved 2017-06-12.
This article is issued from
Wikipedia.
The text is licensed under Creative Commons - Attribution - Sharealike.
Additional terms may apply for the media files.