Landsat program
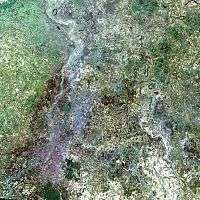
The Landsat program is the longest-running enterprise for acquisition of satellite imagery of Earth. On July 23, 1972 the Earth Resources Technology Satellite was launched. This was eventually renamed to Landsat.[1] The most recent, Landsat 8, was launched on February 11, 2013. The instruments on the Landsat satellites have acquired millions of images. The images, archived in the United States and at Landsat receiving stations around the world, are a unique resource for global change research and applications in agriculture, cartography, geology, forestry, regional planning, surveillance and education, and can be viewed through the U.S. Geological Survey (USGS) 'EarthExplorer' website. Landsat 7 data has eight spectral bands with spatial resolutions ranging from 15 to 60 meters; the temporal resolution is 16 days.[2] Landsat images are usually divided into scenes for easy downloading. Each Landsat scene is about 115 miles long and 115 miles wide (or 100 nautical miles long and 100 nautical miles wide, or 185 kilometers long and 185 kilometers wide).
History
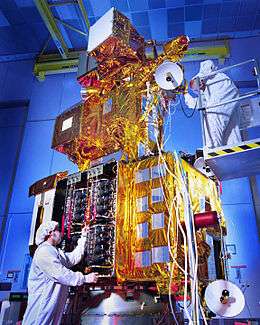
Hughes Santa Barbara Research Center initiated, designed, and fabricated the first three Multispectral Scanners (MSS) in 1969. The first prototype MSS was completed within nine months, in the fall of 1970. It was tested by scanning Half Dome at Yosemite National Park.
The program was initially called the Earth Resources Technology Satellites Program, which was used from 1966 to 1975. In 1975, the name was changed to Landsat. In 1979, President of the United States Jimmy Carter's Presidential Directive 54[3][4] transferred Landsat operations from NASA to NOAA, recommended development of a long term operational system with four additional satellites beyond Landsat 3, and recommended transition to private sector operation of Landsat. This occurred in 1985 when the Earth Observation Satellite Company (EOSAT), a partnership of Hughes Aircraft and RCA, was selected by NOAA to operate the Landsat system with a ten-year contract. EOSAT operated Landsat 4 and Landsat 5, had exclusive rights to market Landsat data, and was to build Landsats 6 and 7.
In 1989, this transition had not been fully completed when NOAA's funding for the Landsat program was due to run out (NOAA had not requested any funding, and Congress had appropriated only six months of funding for the fiscal year)[5] and NOAA directed that Landsats 4 and 5 be shut down.[6] The head of the newly formed National Space Council, Vice President Dan Quayle, noted the situation and arranged emergency funding that allowed the program to continue with the data archives intact. [5][6][7][8]
Again in 1990 and 1991, Congress provided only half of the year's funding to NOAA, requesting that agencies that used Landsat data provide the funding for the other six months of the upcoming year.[5] In 1992, various efforts were made to procure funding for follow on Landsats and continued operations, but by the end of the year EOSAT ceased processing Landsat data. Landsat 6 was finally launched on October 5, 1993, but was lost in a launch failure. Processing of Landsat 4 and 5 data was resumed by EOSAT in 1994. NASA finally launched Landsat 7 on April 15, 1999.
The value of the Landsat program was recognized by Congress in October 1992 when it passed the Land Remote Sensing Policy Act (Public Law 102-555) authorizing the procurement of Landsat 7 and assuring the continued availability of Landsat digital data and images, at the lowest possible cost, to traditional and new users of the data.
Satellite chronology
| Instrument | Picture | Launched | Terminated | Duration | Notes |
|---|---|---|---|---|---|
| Landsat 1 |  | July 23, 1972 | January 6, 1978 | 5 years, 6 months and 14 days | Originally named Earth Resources Technology Satellite 1. Landsat 1 carried two vital instruments; a camera built by the Radio Corporation of America (RCA) known as the Return Beam Vidicon (RVB). As well as a Multi spectral Scanner (MSS) built by the Hughes Aircraft Company. |
| Landsat 2 | | January 22, 1975 | February 25, 1982 | 7 years, 1 month and 3 days | Nearly identical copy of Landsat 1. Payload consisting of a Return Beam Vidicon (RBV) and a Multi spectral Scanner (MSS). The specifications of these instruments were identical to Landsat 1. |
| Landsat 3 | 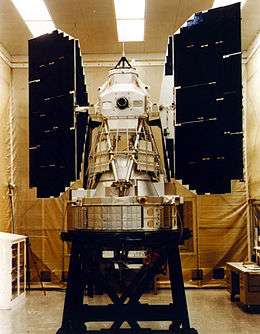 | March 5, 1978 | March 31, 1983 | 5 years and 26 days | Nearly identical copy of Landsat 1 and Landsat 2. Payload consisting of a Return Beam Vidicon (RBV) as well as a Multi spectral Scanner (MSS). Included with the MSS was a short-lived thermal band. MSS data was considered more scientifically applicable than the RBV which was rarely used for engineering evaluation purposes. |
| Landsat 4 | 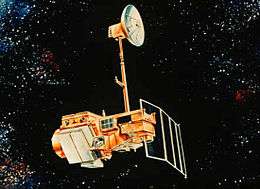 | July 16, 1982 | December 14, 1993 | 11 years, 4 months and 28 days | Landsat 4 carried an updated Multi Spectral Scanner (MSS) used on previous Landsat missions, as well as a Thematic Mapper. |
| Landsat 5 | | March 1, 1984 | June 5, 2013[9] | 29 years, 3 months and 4 days | Nearly identical copy of Landsat 4. Longest Earth-observing satellite mission in history. Designed and built at the same time as Landsat 4, this satellite carried the same payload consisting of a Multi Spectral Scanner (MSS) as well as a Thematic Mapper. |
| Landsat 6 | October 5, 1993 | October 5, 1993 | 0 days | Failed to reach orbit. Landsat 6 was an upgraded version of its predecessors. Carrying the same Multi spectral Scanner (MSS) but also carrying an Enhanced Thematic Mapper, which added a 15m-resolution panchromatic band. | |
| Landsat 7 | | April 15, 1999 | Still active | 19 years, 6 months and 5 days | Operating with scan line corrector disabled since May 2003.[10] The main component on Landsat 7 was the Enhanced Thematic Mapper Plus (ETM+). Still consisting of the 15m-resolution panchromatic band, but also includes a full aperture calibration. This allows for 5% absolute radiometric calibration.[11] |
| Landsat 8 | 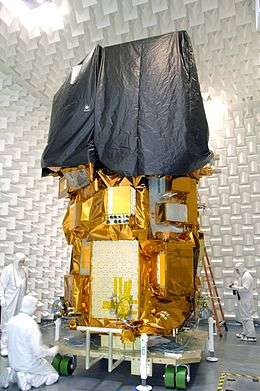 | February 11, 2013 | Still active | 5 years, 8 months and 9 days | Originally named Landsat Data Continuity Mission from launch until May 30, 2013, when NASA operations were turned over to USGS.[12] Landsat 8 has two sensors with its payload, the Operational Land Imager (OLI) and the Thermal InfraRed Sensor (TIRS).[13] |
| Landsat 9 | December 2020 (expected) | Landsat 9 will be a rebuild of its predecessor Landsat 8.[14] |
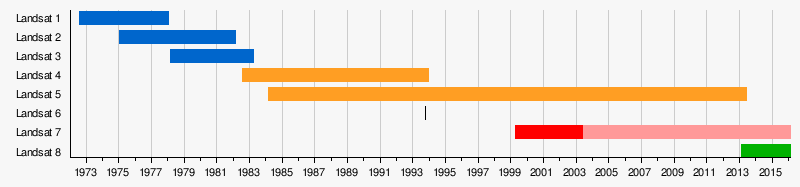
- Timeline
Technical details
Landsat missions 1 through 5 carried the Landsat Multispectral Scanner (MSS), while missions 4 and 5 used the Landsat Thematic Mapper (TM) scanner. The Multispectral Scanner had a 230 mm (9 in) fused silica dinner-plate mirror epoxy bonded to three invar tangent bars mounted to base of a Ni/Au brazed Invar frame in a Serrurier truss that was arranged with four "Hobbs-Links" (conceived by Dr. Gregg Hobbs), crossing at mid-truss. This construct ensured the secondary mirror would simply oscillate about the primary optic axis to maintain focus despite vibration inherent from the 360 mm (14 in) beryllium scan mirror. This engineering solution allowed the United States to develop LANDSAT at least five years ahead of the French SPOT, which first used CCD arrays to stare without need for a scanner. However, LANDSAT data prices climbed from $250 per computer compatible data tape and $10 for black-and-white print to $4,400 for data tape and $2,700 for black-and-white print by 1984, making SPOT data a much more affordable option for satellite imaging data. This was a direct result of the commercialization efforts begun under the Carter administration,[4] though finally completed under the Reagan administration.[15]
The MSS FPA, or Focal Plane Array consisted of 24 square optical fibers extruded down to 0.005 mm (0.0002 in) square fiber tips in a 4x6 array to be scanned across the Nimbus spacecraft path in a ±6 degree scan as the satellite was in a 1.5 hour polar orbit, hence it was launched from Vandenberg Air Force Base. The fiber optic bundle was embedded in a fiber optic plate to be terminated at a relay optic device that transmitted fiber end signal on into six photodiodes and 18 photomultiplier tubes that were arrayed across a 7.6 mm (0.30 in) thick aluminum tool plate, with sensor weight balanced vs the 230 mm telescope on opposite side. This main plate was assembled on a frame, then attached to the silver-loaded magnesium housing with helicoil fasteners.
Key to the success of the multi spectral scanner was the scan monitor mounted on the underbelly of the magnesium housing. It consisted of a diode light source and a sensor mounted at the ends of four flat mirrors that were tilted so that it took 14 bounces for a beam to reflect the length of the three mirrors from source to sender. The beam struck the beryllium scan mirror eight times as it reflected eight times off the flat mirrors. The beam only sensed three positions, being both ends of scan and the mid scan, but by interpolating between these positions that was all that was required to determine where the multi spectral scanner was pointed. Using the scan monitor information the scanning data could be calibrated to display correctly on a map.
Uses of Landsat imagery
One of the great advantages of remote sensing is that it provides data at a broader and more global level that is otherwise impossible to gather when using conventional equipment. However, there is a tradeoff between the local detail of the measurements and the scale of the area being measured compared to using other remote sensing methods such as aerial imagery.
Remote sensing provides information about geographic spaces, like ecosystems that allows scientists to predict the distribution of species, as well as detecting both natural occurring and anthropogenic generated changes in a greater scale than traditional data provided by field work. It also presents data more accurately than models that are derived from field work. The different bands in Landsat, with diverse spectral range provide highly differentiated applications. There are big and diverse applications of Landsat imagery and satellite date in general, ranging from ecology to geopolitical matters. Land cover determination has become a very common use of Landsat Imagery and remotely sensing generated images all around the world.
Natural resources management
Agroindustry
In 1975, one potential application for the new satellite-generated imagery was to find high yield fishery areas. Through the Landsat Menhaden and Thread Investigation, some satellite data of the eastern portion of the Mississippi sound and another area off the coast of the Louisiana coast data was run through classification algorithms to rate the areas as high and low probability fishing zones, these algorithms yielded a classification that was proven with in-situ measurements – to be over 80% accurate and found that water color, as seen from space, and turbidity significantly correlate with the distribution of Menhaden – while surface temperature and salinity do not appear to be significant factors. Water color – measured with the multispectral scanners four spectral bands, was used to infer chlorophylls, turbidity, and possibly fish distribution.[16]
Forestry
An ecological study used at 16 ortho-rectified Landsat images to generate a land cover map of Mozambique's mangrove forest. The main objective was to measure the mangrove cover and above ground biomass on this zone that until now could only be estimated, the cover was found with 93% accuracy to be 2909 square kilometers (27% lower than previous estimates). Additionally, the study helped confirm that geological setting has a greater influence on biomass distribution than latitude alone-the Mangrove area is spread across 16 degrees of latitude but it the biomass volume of it was affected more strongly by geographic conditions.[17]
Climate change and environmental disasters
The shrinking of the Aral Sea
The shrinking of the Aral Sea has been described as "One of the planet's worst environmental disasters". Landsat Imagery has been used as a record to quantify the amount of water loss and the changes to the shoreline. Satellite visual images have a greater impact on people than just words, and this shows the importance of Landsat imagery and satellite images in general.[18]
Yellowstone park historic fires
The Yellowstone fires of 1988 were the worst in the recorded history of the national park. They lasted from June 14 to September 11, when rain and snow helped halt the spread of the fires. The area affected by the fire was estimated to be 3,213 square kilometers – 36% of the park. Landsat Imagery was used for the area estimation, and it also helped determine the reasons why the fire spread so quickly.
Historic drought and a significant number of lightning strikes were some of the factors that created conditions for the massive fire, but anthropogenic actions amplified the disaster. On images generated previous to the fire, there is an evident difference between lands that display preservation practices and the lands that display clear cut activities for timber production. These two type of lands reacted differently to the stress of fires, and it is believed that that was an important factor on the behavior of the wildfire. Landsat Imagery, and satellite imagery in general, have contributed to understanding fire science; fire danger, wildfire behavior and the effects of wildfire on certain areas. It has helped understanding of how different features and vegetation fuel fires, change temperature, and affect the spreading speed.
Glacier retreat
The serial nature of Landsat missions and the fact that is the longest-running satellite program gives it a unique perspective to generate information of earth. Glacier retreat in a big scale can be traced back to previous Landsat missions, and this information can be used to generate climate change knowledge. The Columbia glacier retreat for example, can be observed in false-composite images since Landsat 4 in 1986.
Landsat imagery gives a time-lapse like series of images of development. Human development specifically, can be measured by the size a city grows over time. Further than just population estimates and energy consumption, Landsat imagery gives an insight of the type of urban development, and study aspects of social and political change through visible change. In Beijing for example, a series of ring roads started to develop in 1980s following the economic reform of 1970, and the change in development rate and construction rate was accelerated on these time periods.
Discovery of new species
In 2005, Landsat imagery assisted in the discovery of new species. Conservation scientist Julian Bayliss wanted to find areas that could potentially become conservation forests using Landsat generated satellite images. Bayliss saw a patch in Mozambique that until then had no detailed information. On a reconnaissance trip, on he found great diversity of wildlife as well three new species of butterflies and a new snake species. Following his discovery, he continued to study this forest and was able to map and determine the forest extent.[19]
Future
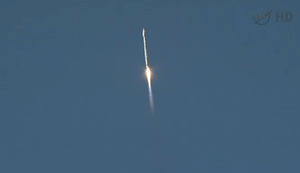
Landsat 8, launched 11 February 2013, is the most recent satellite in the Landsat series. It was launched on an Atlas V 401 from Vandenberg Air Force Base by the Launch Services Program. It will continue to obtain valuable data and imagery to be used in agriculture, education, business, science, and government. The new satellite was assembled in Arizona by Orbital Sciences Corporation.
Preliminary planning has begun for Landsat 9, though its future remains uncertain.[20] Over the course of FY2014 financial planning "appropriators chided NASA for unrealistic expectations that a Landsat 9 would cost $1 billion, and capped spending at $650 million" according to a report by the Congressional Research Service. Senate appropriators have advised NASA to plan for a launch no later than 2020.[4] In April 2015, NASA and the USGS announced that work on Landsat 9 had commenced, with funding allocated for the satellite in the president's FY2016 budget, for a planned launch in 2023.[21] Funding for the development of a low-cost thermal infrared (TIR) free-flying satellite for launch in 2019 was also proposed, to ensure data continuity by flying in formation with Landsat 8.[21]
See also
- Earth observation satellite
- Geographic information system
- Orthophoto, corrected for uniform scale like a map
- Remote sensing
References
- ↑ Short, N.M. "The LANDSAT Tutorial Workbook: Basics of Satellite Remote Sensing". NASA Reference Publication 1078. NASA. Retrieved 20 September 2011.
- ↑ The Landsat Program - Technical Details Archived 2010-05-01 at the Wayback Machine.
- ↑ "Presidential Directive 54" (PDF). jimmycarterlibrary.gov. The White House. November 16, 1979. Archived from the original (PDF) on January 30, 2017. Retrieved April 18, 2017.
- 1 2 3 Folger, Peter (October 27, 2014). "Landsat: Overview and Issues for Congress" (PDF). fas.org. Congressional Research Service. Retrieved April 18, 2017.
- 1 2 3 Greenberg, Joel S.; Hertzfeld, Henry (1992). Space Economics. AIAA (American Institute of Aeronautics & Ast). p. 372. ISBN 1-56347-042-X.
- 1 2 United Press International (1989-03-03). "Govt. pulls the plug on two satellites, threatening jobs". Ellensburg Daily Record. Retrieved 2010-05-19.
- ↑ Associated Press (1989-03-07). "Quayle backs satellite program". The Lewiston Journal. Retrieved 2010-05-19.
- ↑ John Noble Wilford (1989-03-17). "U.S. Halts Plan to Turn Off the Landsat Satellites". The New York Times. Retrieved 2010-05-19.
- ↑ "Historic Landsat 5 Mission Ends « Landsat Science".
- ↑ "Landsat Science".
- ↑ "Landsat 7 « Landsat Science". landsat.gsfc.nasa.gov. Retrieved 2017-03-19.
- ↑ "Landsat 8 Data Now Available!". May 30, 2013. USGS. Retrieved May 30, 2013.
- ↑ "Landsat 8 « Landsat Science". landsat.gsfc.nasa.gov. Retrieved 2017-03-19.
- ↑ "Landsat 9". NASA Landsat Science. Retrieved 21 December 2016.
- ↑ "Failure Of Landsat 6 Leaves Many Researchers In Limbo - The Scientist Magazine®".
- ↑ Kemmerer, Andrew (March 2017). "Finding Fish With Satellites" (PDF). NOAA website.
- ↑ Fatoyinbo, Temilola (March 2017). "Landscape-scale extent, height, biomass, and carbon estimation of Mozambique's mangrove forest with Landsat ETM+ and Shuttle Radar Topography Mission elevation data". AGU publications. Archived from the original on 2016-12-03.
- ↑ Mason, Betsy (March 2017). "Landsat's Most Historically Significant Images of Earth From Space". Wired dsite.
- ↑ https://landsat.gsfc.nasa.gov/landsat-imagery-leads-to-discovery-of-new-species/
- ↑ "– Uncertain Funding Jeopardizes U.S. Land Imaging Satellites - ENS".
- 1 2 Northon, Karen (16 April 2015). "NASA, USGS Begin Work on Landsat 9".
External links
| Wikimedia Commons has media related to |
- Landsat USGS homepage
- Landsat NASA homepage
- Works by Landsat at Project Gutenberg
- Landsat imagery from GLOVIS and Global Land Cover Facility
- Landsat mosaic imagery from the WELD project.