Demographics of Austria
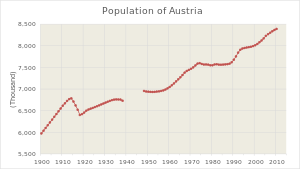
| Historical population | ||
|---|---|---|
| Year | Pop. | ±% |
| 1780 | 2,970,000 | — |
| 1790 | 3,046,000 | +2.6% |
| 1800 | 3,064,000 | +0.6% |
| 1810 | 3,054,000 | −0.3% |
| 1821 | 3,202,000 | +4.8% |
| 1830 | 3,476,000 | +8.6% |
| 1840 | 3,649,000 | +5.0% |
| 1850 | 3,879,000 | +6.3% |
| 1857 | 4,075,000 | +5.1% |
| 1869 | 4,497,880 | +10.4% |
| 1880 | 4,963,528 | +10.4% |
| 1890 | 5,417,360 | +9.1% |
| 1900 | 6,003,845 | +10.8% |
| 1910 | 6,648,310 | +10.7% |
| 1923 | 6,534,742 | −1.7% |
| 1934 | 6,760,044 | +3.4% |
| 1939 | 6,652,567 | −1.6% |
| 1951 | 6,933,905 | +4.2% |
| 1961 | 7,073,807 | +2.0% |
| 1971 | 7,491,526 | +5.9% |
| 1981 | 7,555,338 | +0.9% |
| 1991 | 7,795,786 | +3.2% |
| 2001 | 8,032,587 | +3.0% |
| 2011 | 8,401,940 | +4.6% |
| 2018 | 8,823,054 | +5.0% |
| Source: [1] | ||
This article is about the demographic features of the population of Austria, including population density, ethnicity, education level, health of the populace, economic status, religious affiliations and other aspects of the population.
Austrians are a homogeneous people, although four decades of strong immigration from other parts of Europe have significantly changed the composition of the population of Austria.
According to the 2001 population census, 88.6% are native German speakers (96% Austro-Bavarian dialects and 4% Alemanic dialects) while the remaining 11.4% speak several minority languages. The non-German speakers of Austria can be divided into two groups: traditional minorities, who are related to territories formerly part of the Habsburg Monarchy, and new minorities, resulting from recent immigration.
Total Fertility Rate from 1870 to 1899
The total fertility rate is the number of children born per woman. It is based on fairly good data for the entire period in the present-day Hungary. Sources: Our World In Data and Gapminder Foundation.[2]
| Years | 1870 | 1871 | 1872 | 1873 | 1874 | 1875 | 1876 | 1877 | 1878 | 1879 | 1880[2] |
|---|---|---|---|---|---|---|---|---|---|---|---|
| Total Fertility Rate in Austria | 4.69 | 4.65 | 4.75 | 4.83 | 4.8 | 4.81 | 4.92 | 4.72 | 4.61 | 4.61 | 4.62 |
| Years | 1881 | 1882 | 1883 | 1884 | 1885 | 1886 | 1887 | 1888 | 1889 | 1890[2] |
|---|---|---|---|---|---|---|---|---|---|---|
| Total Fertility Rate in Austria | 4.55 | 4.56 | 4.51 | 4.58 | 4.49 | 4.51 | 4.49 | 4.43 | 4.44 | 4.24 |
| Years | 1891 | 1892 | 1893 | 1894 | 1895 | 1896 | 1897 | 1898 | 1899[2] |
|---|---|---|---|---|---|---|---|---|---|
| Total Fertility Rate in Austria | 4.48 | 4.31 | 4.36 | 4.34 | 4.4 | 4.4 | 4.33 | 4.35 | 4.35 |
Vital statistics since 1900
Data according to Statistik Austria.[3]
| Average population | Live births | Deaths | Natural change | Crude birth rate (per 1000) | Crude death rate (per 1000) | Natural change (per 1000) | Total fertility rate[fn 1] | Infant mortality rate (per 1000 births) | Life expectancy males | Life expectancy females | Net reproduction rate | |
|---|---|---|---|---|---|---|---|---|---|---|---|---|
| 1900 | 5 973 000 | 187 094 | 138 509 | 48 585 | 31.3 | 23.2 | 8.1 | 4.33 | ||||
| 1901 | 6 035 000 | 189 539 | 134 234 | 55 305 | 31.4 | 22.2 | 9.2 | 4.34 | ||||
| 1902 | 6 099 000 | 191 926 | 134 479 | 57 447 | 31.5 | 22.0 | 9.4 | 4.35 | ||||
| 1903 | 6 164 000 | 184 244 | 133 435 | 50 809 | 29.9 | 21.6 | 8.2 | 4.13 | ||||
| 1904 | 6 228 000 | 187 963 | 131 309 | 56 654 | 30.2 | 21.1 | 9.1 | 4.17 | ||||
| 1905 | 6 292 000 | 181 685 | 142 673 | 39 012 | 28.9 | 22.7 | 6.2 | 3.99 | ||||
| 1906 | 6 357 000 | 184 477 | 129 084 | 55 393 | 29.0 | 20.3 | 8.7 | 4.01 | ||||
| 1907 | 6 421 000 | 181 026 | 132 006 | 49 020 | 28.2 | 20.6 | 7.6 | 3.89 | ||||
| 1908 | 6 485 000 | 184 477 | 136 434 | 48 043 | 28.4 | 21.0 | 7.4 | 3.83 | ||||
| 1909 | 6 550 000 | 180 106 | 134 152 | 45 954 | 27.5 | 20.5 | 7.0 | 3.80 | ||||
| 1910 | 6 614 000 | 176 588 | 127 243 | 49 345 | 26.7 | 19.2 | 7.5 | 3.69 | ||||
| 1911 | 6 669 000 | 168 916 | 132 615 | 36 301 | 25.3 | 19.9 | 5.4 | 3.50 | ||||
| 1912 | 6 724 000 | 170 555 | 122 759 | 47 796 | 25.4 | 18.3 | 7.1 | 3.50 | ||||
| 1913 | 6 767 000 | 163 354 | 124 388 | 38 966 | 24.1 | 18.4 | 5.8 | 3.33 | ||||
| 1914 | 6 680 000 | 161 692 | 124 560 | 37 132 | 24.2 | 18.6 | 5.6 | 3.20 | ||||
| 1915 | 6 690 000 | 125 680 | 144 259 | -18 579 | 18.8 | 21.6 | -2.8 | 3.07 | ||||
| 1916 | 6 660 000 | 98 895 | 139 324 | -40 429 | 14.8 | 20.9 | -6.1 | 2.94 | ||||
| 1917 | 6 610 000 | 92 289 | 150 346 | -58 057 | 14.0 | 22.7 | -8.8 | 2.81 | ||||
| 1918 | 6 543 000 | 92 560 | 172 573 | -80 013 | 14.1 | 26.4 | -12.2 | 2.68 | ||||
| 1919 | 6 420 000 | 118 518 | 130 658 | -12 140 | 18.5 | 20.4 | -1.9 | 2.55 | ||||
| 1920 | 6 455 000 | 146 644 | 122 775 | 23 869 | 22.7 | 19.0 | 3.7 | 3.14 | ||||
| 1921 | 6 504 000 | 151 138 | 110 451 | 40 687 | 23.2 | 17.0 | 6.3 | 3.21 | ||||
| 1922 | 6 528 000 | 150 958 | 113 467 | 37 491 | 23.1 | 17.4 | 5.7 | 3.19 | ||||
| 1923 | 6 543 000 | 146 885 | 99 924 | 46 961 | 22.4 | 15.3 | 7.2 | 3.10 | ||||
| 1924 | 6 562 000 | 142 141 | 98 055 | 44 086 | 21.7 | 14.9 | 6.7 | 2.99 | ||||
| 1925 | 6 582 000 | 135 841 | 94 988 | 40 853 | 20.6 | 14.4 | 6.2 | 2.85 | ||||
| 1926 | 6 603 000 | 127 250 | 98 905 | 28 345 | 19.3 | 15.0 | 4.3 | 2.66 | ||||
| 1927 | 6 623 000 | 118 669 | 99 080 | 19 589 | 17.9 | 15.0 | 3.0 | 2.47 | ||||
| 1928 | 6 643 000 | 116 729 | 95 959 | 20 770 | 17.6 | 14.4 | 3.1 | 2.43 | ||||
| 1929 | 6 664 000 | 112 047 | 97 300 | 14 747 | 16.8 | 14.6 | 2.2 | 2.32 | ||||
| 1930 | 6 684 000 | 112 330 | 90 315 | 22 015 | 16.8 | 13.5 | 3.3 | 2.32 | ||||
| 1931 | 6 705 000 | 106 324 | 93 895 | 12 429 | 15.9 | 14.0 | 1.9 | 2.19 | ||||
| 1932 | 6 725 000 | 102 277 | 93 599 | 8 678 | 15.2 | 13.9 | 1.3 | 2.10 | ||||
| 1933 | 6 746 000 | 96 369 | 88 977 | 7 392 | 14.3 | 13.2 | 1.1 | 1.97 | ||||
| 1934 | 6 755 000 | 91 567 | 85 685 | 5 882 | 13.6 | 12.7 | 0.9 | 1.87 | ||||
| 1935 | 6 761 000 | 88 689 | 92 524 | -3 835 | 13.1 | 13.7 | -0.6 | 1.81 | ||||
| 1936 | 6 758 000 | 88 264 | 89 078 | - 814 | 13.1 | 13.2 | -0.1 | 1.80 | ||||
| 1937 | 6 755 000 | 86 351 | 90 035 | -3 684 | 12.8 | 13.3 | -0.5 | 1.54 | ||||
| 1938 | 6 753 000 | 93 812 | 94 755 | - 943 | 13.9 | 14.0 | -0.1 | 1.92 | ||||
| 1939 | 6 658 000 | 137 825 | 101 709 | 36 116 | 20.7 | 15.3 | 5.4 | 2.86 | ||||
| 1940 | 6 705 000 | 145 926 | 99 475 | 46 451 | 21.8 | 14.8 | 6.9 | 2.70 | ||||
| 1941 | 6 731 000 | 135 398 | 94 121 | 41 277 | 20.1 | 14.0 | 6.1 | 2.53 | ||||
| 1942 | 6 799 000 | 116 172 | 90 510 | 25 662 | 17.1 | 13.3 | 3.8 | 2.37 | ||||
| 1943 | 6 815 000 | 122 443 | 94 269 | 28 174 | 18.0 | 13.8 | 4.1 | 2.21 | ||||
| 1944 | 6 837 000 | 126 938 | 109 622 | 17 316 | 18.6 | 16.0 | 2.5 | 2.04 | ||||
| 1945 | 6 793 000 | 101 369 | 173 767 | -72 398 | 14.9 | 25.6 | -10.7 | 1.88 | ||||
| 1946 | 7 000 000 | 111 302 | 94 077 | 17 225 | 15.9 | 13.4 | 2.5 | 2.01 | 81.4 | |||
| 1947 | 6 971 000 | 128 953 | 90 027 | 38 926 | 18.5 | 12.9 | 5.6 | 2.35 | 78.3 | |||
| 1948 | 6 953 000 | 123 221 | 84 213 | 39 008 | 17.7 | 12.1 | 5.6 | 2.25 | 76.2 | |||
| 1949 | 6 942 000 | 113 375 | 89 247 | 24 128 | 16.3 | 12.9 | 3.5 | 2.07 | 75.2 | |||
| 1950 | 6 935 000 | 107 854 | 85 710 | 22 144 | 15.6 | 12.4 | 3.2 | 2.09 | 66.1 | |||
| 1951 | 6 934 000 | 102 764 | 88 253 | 14 511 | 14.8 | 12.7 | 2.1 | 2.02 | 61.3 | |||
| 1952 | 6 928 000 | 103 012 | 83 372 | 19 640 | 14.9 | 12.0 | 2.8 | 2.06 | 51.9 | |||
| 1953 | 6 932 000 | 102 867 | 83 399 | 19 468 | 14.8 | 12.0 | 2.8 | 2.09 | 49.9 | |||
| 1954 | 6 940 000 | 103 985 | 84 632 | 19 353 | 15.0 | 12.2 | 2.8 | 2.15 | 48.3 | |||
| 1955 | 6 947 000 | 108 575 | 84 995 | 23 580 | 15.6 | 12.2 | 3.4 | 2.29 | 45.6 | |||
| 1956 | 6 952 000 | 115 827 | 86 824 | 29 003 | 16.7 | 12.5 | 4.2 | 2.48 | 43.3 | |||
| 1957 | 6 966 000 | 118 712 | 89 298 | 29 414 | 17.0 | 12.8 | 4.2 | 2.57 | 44.2 | |||
| 1958 | 6 987 000 | 119 755 | 85 980 | 33 775 | 17.1 | 12.3 | 4.8 | 2.60 | 40.7 | |||
| 1959 | 7 014 000 | 124 377 | 87 970 | 36 407 | 17.7 | 12.5 | 5.2 | 2.69 | 39.8 | |||
| 1960 | 7 048 000 | 125 945 | 89 603 | 36 342 | 17.9 | 12.7 | 5.2 | 2.70 | 37.5 | |||
| 1961 | 7 087 000 | 131 563 | 85 673 | 45 890 | 18.6 | 12.1 | 6.5 | 2.79 | 32.7 | 1.29 | ||
| 1962 | 7 130 000 | 133 253 | 90 854 | 42 399 | 18.7 | 12.7 | 5.9 | 2.80 | 32.8 | 1.30 | ||
| 1963 | 7 176 000 | 134 809 | 91 579 | 43 230 | 18.8 | 12.8 | 6.0 | 2.82 | 31.3 | 1.31 | ||
| 1964 | 7 224 000 | 133 841 | 89 081 | 44 760 | 18.6 | 12.3 | 6.2 | 2.80 | 29.2 | 1.30 | ||
| 1965 | 7 271 000 | 129 924 | 94 273 | 35 651 | 17.9 | 13.0 | 4.9 | 2.71 | 28.3 | 1.26 | ||
| 1966 | 7 322 000 | 128 577 | 91 440 | 37 137 | 17.6 | 12.5 | 5.1 | 2.66 | 28.1 | 1.24 | ||
| 1967 | 7 377 000 | 127 404 | 95 438 | 31 966 | 17.4 | 13.0 | 4.4 | 2.62 | 26.4 | 1.23 | ||
| 1968 | 7 415 000 | 126 115 | 96 014 | 30 101 | 17.1 | 13.0 | 4.1 | 2.59 | 25.5 | 1.21 | ||
| 1969 | 7 441 000 | 121 377 | 98 715 | 22 662 | 16.4 | 13.4 | 3.1 | 2.50 | 25.4 | 1.17 | ||
| 1970 | 7 467 000 | 112 301 | 98 819 | 13 482 | 15.1 | 13.3 | 1.8 | 2.29 | 25.9 | 66.5 | 73.4 | 1.07 |
| 1971 | 7 500 000 | 108 510 | 97 334 | 11 176 | 14.6 | 13.1 | 1.5 | 2.20 | 26.1 | 66.6 | 73.7 | 1.03 |
| 1972 | 7 544 000 | 104 033 | 95 323 | 8 710 | 13.9 | 12.7 | 1.2 | 2.09 | 25.2 | 66.9 | 74.0 | 0.98 |
| 1973 | 7 586 000 | 98 041 | 92 768 | 5 273 | 13.0 | 12.3 | 0.7 | 1.94 | 23.8 | 67.5 | 74.6 | 0.91 |
| 1974 | 7 599 000 | 97 430 | 94 324 | 3 106 | 12.9 | 12.5 | 0.4 | 1.91 | 23.5 | 67.5 | 74.7 | 0.90 |
| 1975 | 7 579 000 | 93 757 | 96 041 | -2 284 | 12.4 | 12.7 | -0.3 | 1.83 | 20.5 | 67.7 | 74.7 | 0.86 |
| 1976 | 7 566 000 | 87 446 | 95 140 | -7 694 | 11.6 | 12.6 | -1.0 | 1.69 | 18.2 | 68.2 | 75.1 | 0.80 |
| 1977 | 7 568 000 | 85 595 | 92 402 | -6 807 | 11.3 | 12.2 | -0.9 | 1.63 | 16.8 | 68.5 | 75.5 | 0.77 |
| 1978 | 7 562 000 | 85 402 | 94 617 | -9 215 | 11.3 | 12.5 | -1.2 | 1.61 | 15.0 | 68.5 | 75.7 | 0.76 |
| 1979 | 7 549 000 | 86 388 | 92 012 | -5 624 | 11.4 | 12.2 | -0.7 | 1.60 | 14.7 | 68.8 | 76.0 | 0.76 |
| 1980 | 7 549 000 | 90 872 | 92 442 | -1 570 | 12.0 | 12.2 | -0.2 | 1.65 | 14.3 | 69.0 | 76.1 | 0.78 |
| 1981 | 7 569 000 | 93 867 | 92 585 | 1 282 | 12.4 | 12.2 | 0.2 | 1.67 | 12.7 | 69.3 | 76.4 | 0.80 |
| 1982 | 7 574 000 | 94 840 | 91 339 | 3 501 | 12.5 | 12.1 | 0.5 | 1.66 | 12.8 | 69.4 | 76.6 | 0.79 |
| 1983 | 7 562 000 | 90 118 | 93 041 | -2 923 | 11.9 | 12.3 | -0.4 | 1.56 | 11.9 | 69.5 | 76.6 | 0.74 |
| 1984 | 7 561 000 | 89 234 | 88 466 | 768 | 11.8 | 11.7 | 0.1 | 1.52 | 11.4 | 70.0 | 77.2 | 0.73 |
| 1985 | 7 565 000 | 87 440 | 89 578 | -2 138 | 11.6 | 11.8 | -0.3 | 1.47 | 11.2 | 70.4 | 77.3 | 0.70 |
| 1986 | 7 570 000 | 86 964 | 87 071 | - 107 | 11.5 | 11.5 | -0.0 | 1.45 | 10.3 | 70.9 | 77.7 | 0.69 |
| 1987 | 7 575 000 | 86 503 | 84 907 | 1 596 | 11.4 | 11.2 | 0.2 | 1.43 | 9.8 | 71.4 | 78.1 | 0.68 |
| 1988 | 7 585 000 | 88 052 | 83 263 | 4 789 | 11.6 | 11.0 | 0.6 | 1.45 | 8.1 | 71.9 | 78.6 | 0.69 |
| 1989 | 7 620 000 | 88 759 | 83 407 | 5 352 | 11.6 | 10.9 | 0.7 | 1.44 | 8.3 | 71.9 | 78.7 | 0.69 |
| 1990 | 7 678 000 | 90 454 | 82 952 | 7 502 | 11.8 | 10.8 | 1.0 | 1.46 | 7.8 | 72.2 | 78.9 | 0.70 |
| 1991 | 7 755 000 | 94 629 | 83 428 | 11 201 | 12.2 | 10.8 | 1.4 | 1.51 | 7.5 | 72.3 | 79.0 | 0.72 |
| 1992 | 7 841 000 | 95 302 | 83 162 | 12 140 | 12.2 | 10.6 | 1.5 | 1.51 | 7.5 | 72.5 | 79.2 | 0.72 |
| 1993 | 7 906 000 | 95 227 | 82 517 | 12 710 | 12.0 | 10.4 | 1.6 | 1.50 | 6.5 | 72.8 | 79.4 | 0.72 |
| 1994 | 7 936 000 | 92 415 | 80 684 | 11 731 | 11.6 | 10.2 | 1.5 | 1.47 | 6.3 | 73.1 | 79.7 | 0.70 |
| 1995 | 7 948 000 | 88 669 | 81 171 | 7 498 | 11.2 | 10.2 | 0.9 | 1.42 | 5.4 | 73.3 | 80.0 | 0.68 |
| 1996 | 7 959 000 | 88 809 | 80 790 | 8 019 | 11.2 | 10.2 | 1.0 | 1.45 | 5.1 | 73.7 | 80.1 | 0.69 |
| 1997 | 7 968 000 | 84 045 | 79 432 | 4 613 | 10.5 | 10.0 | 0.6 | 1.39 | 4.7 | 74.0 | 80.6 | 0.67 |
| 1998 | 7 977 000 | 81 233 | 78 339 | 2 894 | 10.2 | 9.8 | 0.4 | 1.37 | 4.9 | 74.5 | 80.8 | 0.66 |
| 1999 | 7 992 000 | 78 138 | 78 200 | - 62 | 9.8 | 9.8 | 0.0 | 1.34 | 4.4 | 74.8 | 80.9 | 0.64 |
| 2000 | 8 012 000 | 78 268 | 76 780 | 1 488 | 9.8 | 9.6 | 0.2 | 1.36 | 4.8 | 75.1 | 81.1 | 0.66 |
| 2001 | 8 042 000 | 75 458 | 74 767 | 691 | 9.4 | 9.3 | 0.1 | 1.33 | 3.7 | 75.6 | 81.6 | 0.64 |
| 2002 | 8 082 000 | 78 399 | 76 131 | 2 268 | 9.7 | 9.4 | 0.3 | 1.39 | 4.3 | 75.8 | 81.7 | 0.67 |
| 2003 | 8 121 000 | 76 944 | 77 209 | - 265 | 9.5 | 9.5 | -0.0 | 1.38 | 4.0 | 75.9 | 81.5 | 0.66 |
| 2004 | 8 172 000 | 78 968 | 74 292 | 4 676 | 9.7 | 9.1 | 0.6 | 1.42 | 4.0 | 76.4 | 82.1 | 0.68 |
| 2005 | 8 228 000 | 78 190 | 75 189 | 3 001 | 9.5 | 9.1 | 0.4 | 1.41 | 3.7 | 76.6 | 82.2 | 0.68 |
| 2006 | 8 269 000 | 77 914 | 74 295 | 3 619 | 9.4 | 9.0 | 0.4 | 1.41 | 4.0 | 77.1 | 82.7 | 0.68 |
| 2007 | 8 301 000 | 76 250 | 74 625 | 1 625 | 9.2 | 9.0 | 0.2 | 1.39 | 3.8 | 77.3 | 82.8 | 0.67 |
| 2008 | 8 337 000 | 77 752 | 75 083 | 2 669 | 9.3 | 9.0 | 0.3 | 1.42 | 3.3 | 77.6 | 83.0 | 0.68 |
| 2009 | 8 363 000 | 76 344 | 77 381 | -1 037 | 9.1 | 9.3 | -0.2 | 1.40 | 3.7 | 77.4 | 82.9 | 0.67 |
| 2010 | 8 388 000 | 78 742 | 77 199 | 1 543 | 9.4 | 9.2 | 0.2 | 1.44 | 3.8 | 77.7 | 83.2 | 0.69 |
| 2011 | 8 421 000 | 78 109 | 76 479 | 1 630 | 9.3 | 9.1 | 0.2 | 1.43 | 3.8 | 78.1 | 83.4 | 0.69 |
| 2012 | 8 464 000 | 78 952 | 79 436 | -484 | 9.3 | 9.4 | -0.1 | 1.44 | 3.2 | 78.3 | 83.3 | |
| 2013 | 8 518 000 | 79 330 | 79 526 | -196 | 9.3 | 9.3 | -0.0 | 1.44 | 3.1 | 78.45 | 83.56 | |
| 2014 | 8 584 000 | 81 722 | 78 252 | 3 470 | 9.6 | 9.1 | 0.5 | 1.46 | 3.0 | 78.91 | 83.74 | |
| 2015 | 8 700 000 | 84 381 | 83 073 | 1 308 | 9.7 | 9.5 | 0.2 | 1.49 | 3.1 | 78.63 | 83.59 | |
| 2016 | 8 773 000 | 87 675 | 80 669 | 7 006 | 10.0 | 9.2 | 0.8 | 1.53 | 3.1 | 79.14 | 83.95 | |
| 2017 | 8 822 000 | 87 633 | 83 270 | 4 363 | 10.0 | 9.5 | 0.5 | 1.52 | 2.9 | 79.3 | 83.9 |
- In 2016, 43,190 out of the 87,675 newborns had a Catholic mother (father: 38,884), 12,794 Muslim mother (father: 12,996) and 2,841 had a Protestant mother (father: 2,398).
- In 2015, 41,783 out of the 84,381 newborns had a Catholic mother (father: 37,036), 10,760 Muslim mother (father: 10,972) and 2,595 had a Protestant mother (father: 2,212).
Current natural increase
- Number of births January–June 2016 =

- Number of births January–September 2017 =

- Number of deaths January–June 2015 =

- Number of deaths January–September 2017 =
- Natural population growth January–June 2015 =
- Natural population growth January–September 2017 =
Other demographic statistics
There are 185,000 Turks, including Turkish Kurds, in Austria today, accounting for 2.2% of the population. This is the third largest ethnic minority after Serbs and Federal Germans (2.7%).[5]
There are three "traditional" ethnic minorities within Austria that have found themselves within Austria as a result of European boundary changes over the years. They are Carthinian Slovenes, Croats and Hungarians.[5]
Modern immigration has resulted in the creation of a number of sizeable new ethic groups in Austria. Notably more than 300,000 people came to Austria from the former Yugoslavia during and after the wars there, as well as more than 300,000 from Turkey.[5]
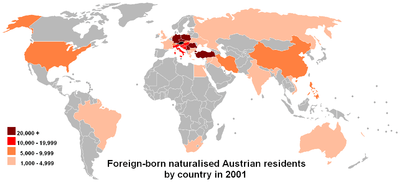
The number of people living in Austria but born elsewhere increased by 35% over the past decade. Austria estimates that 81% of its population had no migration background, while about 19% had at least one parent of migrant background. There are estimated to be 415,000 descendants of foreign-born immigrants in the country.[5]
The majority of Austrians (73.6%) in the 2001 census reported that they were Roman Catholic. Protestants made up a further 4.7% of the population and Muslims 4.2%. 12% of respondents said that they were not religious.[5]
Demographic statistics according to the World Population Review.[5]
- One birth every 6 minutes
- One death every 6 minutes
- One net migrant every 26 minutes
- Net gain of one person every 25 minutes
The following demographic statistics are from the CIA World Factbook.[6] and Statistik Austria.
- Nationality
- noun: Austrian(s)
- adjective: Austrian
- Population
- 8,754,413 (July 2017 est.)
- country comparison to the world: 95th
- Age structure

- 0-14 years: 14.01% (male 628,205/female 598,519)
- 15-24 years: 11.07% (male 494,016/female 475,500)
- 25-54 years: 42.42% (male 1,856,532/female 1,856,937)
- 55-64 years: 13.23% (male 574,570/female 584,022)
- 65 years and over: 19.26% (male 731,126/female 954,986) (2017 est.)
- 0-14 years: 13.6% (male 573,146/female 546,596)
- 15-24 years: 11.6% (male 488,564/female 468,891)
- 25-54 years: 42.9% (male 1,766,729/female 1,756,880)
- 55-64 years: 12.7% (male 515,913/female 528,988)
- 65 years and over: 19.2% (male 670,750/female 906,605) (2014 est.)
- 0-14 years: 14% (male 590,855/female 563,300)
- 15-64 years: 67.7% (male 2,793,725/female 2,769,840)
- 65 years and over: 18.2% (male 627,456/female 872,104) (2011 est.)
- 0–14 years: 14.5% (male 609,748/female 581,144)
- 15–64 years: 67.5% (male 2,785,091/female 2,756,402)
- 65 years and over: 18% (male 612,613/female 865,283) (2009 est.)
- Total fertility rate
- 1.47 children born/woman (2017 est.) Country comparison to the world: 201st
- 1.43 children born/woman (2012 est.) Country comparison to the world: 202nd
- Median age
- total: 44 years. Country comparison to the world: 13rd
- male: 42.8 years
- female: 45.1 years (2017 est.)
- Total: 44.3 years
- Male: 43.2 years
- Female: 45.3 years (2014 est.)
- Total: 43 years
- Male: 41.9 years
- Female: 44 years (2011 est.)
- Mother's mean age at first birth
- 29 years (2014 est.)
- Population growth rate
- 0.47% (2017 est.) Country comparison to the world: 156th
- 0.01% (2014 est.)
- Birth rate
- 9.5 births/1,000 population (2017 est.) Country comparison to the world: 201st
- 8.76 births/1,000 population (2014 est.)
- Death rate
- 9.6 deaths/1,000 population (2017 est.) Country comparison to the world: 50th
- 10.38 deaths/1,000 population (July 2014 est.)
- Net migration rate
- 4.8 migrant(s)/1,000 population (2017 est.) Country comparison to the world: 25th
- 1.76 migrant(s)/1,000 population (2014 est.)
- Life expectancy at birth
- total population: 81.6 years. Country comparison to the world: 23rd
- male: 78.9 years
- female: 84.4 years (2017 est.)
- Ethnic groups
Austrians 91.1%, former Yugoslavs 4% (includes Croatians, Slovenes, Serbs, and Bosniaks), Turks 1.6%, Germans 0.9%, other or unspecified 2.4% (2001 census)
- Languages
German (official nationwide) 88.6%, Turkish 2.3%, Serbian 2.2%, Croatian (official in Burgenland) 1.6%, other (includes Slovene, official in South Carinthia, and Hungarian, official in Burgenland) 5.3% (2001 est.)
- Religions
Catholic 73.8% (includes Roman Catholic 73.6%, other Catholic 0.2%), Protestant 4.9%, Muslim 4.2%, Orthodox 2.2%, other 0.8% (includes other Christian), none 12%, unspecified 2% (2001 est.)
- Urbanization
- urban population: 58.3% of total population (2018)
- rate of urbanization: 0.59% annual rate of change (2015-20 est.)
- Infant mortality rate
- total: 3.4 deaths/1,000 live births Country comparison to the world: 208th
- male: 3.8 deaths/1,000 live births
- female: 3 deaths/1,000 live births (2017 est.)
- Total: 4.16 deaths/1,000 live births
- country comparison to the world: 196
- Male: 5.01 deaths/1,000 live births
- Female: 3.27 deaths/1,000 live births (2014 est.)
- Maternal mortality ratio
- 4 deaths/100,000 live births (2015 est.) Country comparison to the world: 175th
- Dependency ratios
- total dependency ratio: 49.2
- youth dependency ratio: 21.1
- elderly dependency ratio: 28.1
- potential support ratio: 3.6 (2015 est.)
- School life expectancy (primary to tertiary education)
- total: 16 years
- male: 16 years
- female: 16 years (2015)
- Unemployment, youth ages 15-24
- total: 10.6% Country comparison to the world: 125th
- male: 11.1%
- female: 10% (2015 est.)
- Sex ratio
- at birth: 1.05 male(s)/female
- 0-14 years: 1.05 male(s)/female
- 15-24 years: 1.04 male(s)/female
- 25-54 years: 1.01 male(s)/female
- 55-64 years: 0.95 male(s)/female
- 65 years and over: 0.73 male(s)/female
- Total population: 0.95 male(s)/female (2014 est.)
- HIV/AIDS
- Adult prevalence rate: 0.3% (2009 est.)
- country comparison to the world: 90
- People living with HIV/AIDS: 15,000 (2009 est.)
- country comparison to the world: 84
- New Infections with HIV/AIDS: 453 (2005)
- Deaths: 54 (2004)
- Health expenditures
- 11% of GDP (2009)
- country comparison to the world: 20
- Physicians density
- 4.749 physicians/1,000 population (2009)
- country comparison to the world: 6
- Hospital bed density
- 7.6 beds/1,000 population (2010)
- country comparison to the world: 9
- Education expenditures
- 5.9% of GDP (2007)
- country comparison to the world: 44
- Literacy
- Definition: age 15 and over can read and write
- Total population: 98%
- Male: NA%
- Female: NA%
- Illiterates: some 3–4% of Austrians are functionally illiterate[7]
Ethnic groups
Traditional ethnic minorities in Austria
Only three numerically significant traditional minority groups exist – 14,000 Carinthian Slovenes (according to the 2001 census – unofficial estimates of Slovene organisations put the number at 50,000) in Austrian Carinthia (south central Austria) and about 25,000 Croats and 20,000 Hungarians in Burgenland (on the Hungarian border). The Slovenes (also called 'Windische') form a closely knit community. Their rights as well as those of the Croats are protected by law and generally respected in practice. The present boundaries of Austria, once the center of the Habsburg Empire that constituted the second-largest state in Europe, were established in accordance with the Treaty of Saint-Germain-en-Laye in 1919. Some Austrians, particularly near Vienna, still have relatives in countries that made up the Monarchy, namely Croatia, Czech Republic, Slovakia, Slovenia and Hungary.
New ethnic minorities in Austria
According to the Austrian Statistical Bureau, 814,800 foreigners legally lived in Austria in mid-2006, representing 9.8% of the total population, one of the highest rates in Europe.
Of these foreign residents, 305,100 came from the former Yugoslavia and 110,800 from Turkey.
Owing to a growing naturalization rate, 330,000 people have been naturalized between 1985 and the end of 2003, representing about 4% of the 7.4 million Austrian citizens living today in the country.
Of these new citizens 110,000 came from the former Yugoslavia and 90,000 from Turkey. Considering pre-1985 naturalizations, in 2005 at least 18% (in Vienna more than 30%) of the population was either foreign or of foreign origin. Native Austrians have had stagnant demographics since World War I, and have been in absolute decline since the 1970s.
Immigration
As of 2011, Statistik Austria official estimates have shown that 81% of residents, or 6.75 million[8] had no migration background and more than 19% or 1.6 million inhabitants[8] had at least one parent of immigrant background. There are more than 415,000 descendants of foreign-born immigrants[8] residing in Austria, the great majority of whom have been naturalized.
According to Eurostat, there were 1.27 million foreign-born residents in Austria in 2010, corresponding to 15.2% of the total population. Of these, 764,000 (9.1%) were born outside the EU and 512,000 (6.1%) were born in another EU member state.[9]
350,000 ethnic Turks[10] (including a minority of Turkish Kurds) currently live in Austria. At about 3% of the total population, they make up the biggest single ethnic minority in Austria.
| Rank | Nationality | Population
(1 January 2018)[11] |
|---|---|---|
| 1 | 186,891 | |
| 2 | 120,341 | |
| 3 | 117,277 | |
| 4 | 102,242 | |
| 5 | 95,221 | |
| 6 | 77,174 | |
| 7 | 76,690 | |
| 8 | 62,187 | |
| 9 | 48,116 | |
| 10 | 45,720 |
Languages
- German (official nationwide) 88.8% (94% Bavarian, 6% Alemanic)
- Serbian 2.4%
- Turkish 2.3%
- Croatian (official in Burgenland) 1.3%
- Slovene (official in Carinthia) 0.2–0.5%
- Hungarian (official in Burgenland) 0.2%
- Czech 0.2%
- Slovak 0.1%
- Yiddish ?%
- Romany ?%
- Languages of the recent immigrant groups around 10% (Census 2001 (link from Web Archive))
Religion
In 2001, about 74% of Austria's population were registered as Roman Catholic,[14] while about 5% considered themselves Protestants.[14] Austrian Christians, both Catholic and Protestant,[15] are obliged to pay a mandatory membership fee (calculated by income—about 1%) to their church; this payment is called "Kirchenbeitrag" ("Ecclesiastical/Church contribution"). Since the second half of the 20th century, the number of adherents and churchgoers has declined. Data for the end of 2016 from the Austrian Roman Catholic church lists 5,162,622 members, or 58.8% of the total Austrian population. Sunday church attendance was 605,828 or 7% of the total Austrian population in 2015.[16] The Lutheran church also recorded a loss of 74,421 adherents between 2001 and 2016.
About 12% of the population declared that they have no religion.[14] in 2001; this share had grown to 20% by 2015.[17] Of the remaining people, around 340,000 were registered as members of various Muslim communities in 2001, mainly due to the influx from Turkey, Bosnia-Herzegovina and Kosovo.[14] The number of Muslims has doubled in 15 years to 700,000 in 2016.[18] About 180,000 are members of Orthodox Churches (mostly Serbs), about 21,000 people are active Jehovah's Witnesses[19] and about 8,100 are Jewish.[14]
An estimated 15,000 Jews or adherents of Judaism live in Austria, primarily in Vienna – a remnant of the post-World War II community after the Nazi Holocaust.
Notes
- ↑ In fertility rates, 2.1 and above is a stable population and have been marked blue, 2 and below leads an aging population and the result is that the population reduces.
References

- ↑ "Total Population. Population since 1869". Statistics Austria. Retrieved 7 May 2017.
- 1 2 3 4 Max Roser (2014), "Total Fertility Rate around the world over the last two centuries", Our World In Data, Gapminder Foundation
- ↑ AUSTRIA, STATISTIK. "Bevölkerung". Statistik.at. Retrieved 24 August 2017.
- ↑ "Population". Statistics Austria. Retrieved 5 November 2016.
- 1 2 3 4 5 6 "Austria Population 2018", World Population Review
- ↑ "The World FactBook - Austria", The World Factbook, July 12, 2018
- ↑ "Archived copy". Archived from the original on 2005-05-12. Retrieved 2005-05-25.
- 1 2 3 "STATISTIK AUSTRIA Kommission für Migrations - und Integrationsforschung der Österreichischen Akademie der Wissenschaften, Wien 2012" (PDF). Medienservicestelle.at. p. 23. Retrieved 2017-08-24.
- ↑ 6.5% of the EU population are foreigners and 9.4% are born abroad, Eurostat, Katya VASILEVA, 34/2011.
- ↑ BBC (2010-11-10). "Turkey's ambassador to Austria prompts immigration spat". BBC News. Retrieved 2010-11-10.
- ↑ "Österreich - Ausländer nach Staatsangehörigkeiten 2018 - Statistik". Statista. Retrieved 12 March 2018.
- ↑ "Kirchenaustritte gingen 2012 um elf Prozent zurück" [Leaving church increased by eleven percent in 2012]. derStandard.at (in German). 8 January 2013. Archived from the original on 20 October 2013.
- ↑ WZ-Recherche 2016. Published in article: "Staat und Religion". Wiener Zeitung, January 2016.
- 1 2 3 4 5 "Census 2001: Population 2001 according to religious affiliation and nationality" (PDF) (in German). Statistik Austria. Retrieved 17 December 2007.
- ↑ Tax is only mandatory for Lutherans and Reformed.
- ↑ "Katholische Kirche Österreichs, Statistik". Retrieved 12 February 2017.
- ↑ Church data retrieved 14 January 2015
- ↑ Zahl der Muslime in Österreich seit 2001 verdoppelt diepresse.com, 04/08/2017.
- ↑ 2015 Yearbook of Jehovah's Witnesses. Watch Tower Society. p. 178.
Further reading
External links
| Wikimedia Commons has media related to Demographics of Austria. |