Energy in California
California is the most populous state in the nation, but its total energy demand is second to the state of Texas. The state has one of the lowest per capita energy consumption rates in the country due in part to the relatively mild weather comparative to the rest of the nation.[1]
Electricity
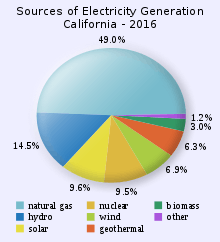
Natural gas-fired power plants typically account for more than one-half of in-state electricity generation. California is one of the largest hydroelectric power producers in the United States, and with adequate rainfall, hydroelectric power typically accounts for close to one-fifth of State electricity generation. Due to strict emission laws, only one coal-fired power plant still operates in California, the 63 MW Argus Cogeneration plant in San Bernardino County.[2]
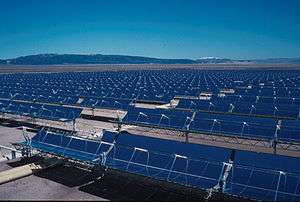
California leads the nation in electricity generation from non-hydroelectric renewable energy sources, including geothermal power, wind power, and solar power. California has some of the most aggressive renewable energy goals in the United States.[3] The state is required to obtain at least 33% of its electricity from renewable resources by 2020, and 50% by 2030, excluding large hydro.[4][5] Solar Energy Generating Systems (SEGS) is the name given to nine solar power plants in the Mojave Desert which were built in the 1980s. These plants have a combined capacity of 354 megawatts (MW) making them at one time the largest solar power installation in the world.[6] Other large solar plants in the Mojave Desert include the 392 MW Ivanpah Solar Power Facility,[7] opened in 2014, and the 550 MW Desert Sunlight Solar Farm and 579 MW Solar Star, both completed in 2015. The Alta Wind Energy Center in the Tehachapi Mountains is the largest wind power plant in the United States with 1,548 MW installed capacity.[8] A facility known as “The Geysers,” located in the Mayacamas Mountains north of San Francisco, is the largest group of geothermal power plants in the world, with more than 750 MW of installed capacity. California’s hydroelectric power potential ranks second in the United States (behind Washington State), and substantial geothermal and wind power resources are found along the coastal mountain ranges and the eastern border with Nevada. High solar power potential is found in southeastern California’s deserts.
California’s single remaining operational nuclear power plant, Diablo Canyon Power Plant, accounts for less than one-tenth of total generation. California used to have multiple other nuclear power plants, including the Rancho Seco Nuclear Generating Station, the San Onofre Nuclear Generating Station, the Vallecitos Nuclear Center,[9] and the Humboldt Bay Nuclear Power Plant,[10] in addition to various other smaller experimental or prototype reactors which intermittently supplied power to the grid, such as the Sodium Reactor Experiment. However all of these reactors have been shut down due to both economic[11] and social[12] factors. Currently, the owner of the Diablo Canyon plant, Pacific Gas & Electric, has plans to shut down the two reactors at the site in 2025.[13] This lost generation will be made up with renewables. On May 13, 2017, the California Independent System Operator (ISO) reported that the state had broken a new instantaneous renewable energy record, with non-hydro renewables providing 67.2% of the total electricity on the ISO's grid, with another 13.5% being provided by hydro.[14]
Bill 2514 directed the California Public Utilities Commission (CPUC) to adopt an energy storage program and procurement target.[15] As a result, the CPUC established an energy storage target of 1,325 MW by 2020.[16]
California's electricity rates are among the highest in the United States as a result of the changing energy mix within the state, including aggressive construction of new natural gas power plants.[17] California's electricity costs per kWh are 17.4 cents per kWh and 14.8 cents per kWh for residential and commercial customers respectively.[18] Due to high electricity demand, California imports more electricity than any other state, primarily wind and hydroelectric power from states in the Pacific Northwest (via Path 15 and Path 66) and nuclear, coal-, and natural gas-fired production from the desert Southwest via Path 46.[19] Imported coal-fired electricity is expected to decline as power agreements expire and the city of Los Angeles phases out its use of imported coal by 2025.[20][2]
Although California's population increased by 13% during the 1990s, the state did not build any new major power plants during that time, although existing in-state power plants were expanded and power output was increased nearly 30% from 1990 to 2001. However, between 2000 and 2015, California built nearly 500 new power plants to supplement the 700 operating in 2000, boosting power supplies by 43%.[17]
In 2016, CPUC announced new rules for connecting coming generation sources to grid. Connection costs must be estimated by the utility, and the developer is limited to paying within ±25% change of the estimate. CPUC expects the rules to lower overall costs for ratepayers.[21][22][23] California requires 1.8 GW of utility storage[24] and studies long duration bulk energy storage. The state allocates US$83 million per year during 2017-2019 for behind-the-meter storage.[25]
California's peak electricity demand occurred on July 24, 2006, at 2:44 pm, with 50,270 megawatts. Since then measures to reduce peak load have resulted in decreased peak demand, even as the state's population has continued to grow.[26] In 2017, the peak load was 50,116 MW, on September 1.[27]
Electricity system data
As of 2017, 29.3% of electricity was imported, and of that, 31.5% was of unspecified origin.
| Year | Wind | Solar | Small hydro | Geothermal | Biomass | Large hydro | Coal | Nuclear | Natural gas | Unspecified | Renewable |
|---|---|---|---|---|---|---|---|---|---|---|---|
| 2009 | 3.1% | 0.3% | 1.7% | 4.6% | 2.3% | 9.1% | 8.1% | 13.1% | 42.0% | 15.7% | 12.0% |
| 2010 | 4.7% | 0.3% | 1.9% | 4.6% | 2.4% | 10.5% | 7.7% | 13.9% | 41.9% | 12.0% | 13.9% |
| 2011 | 5.0% | 0.4% | 2.1% | 4.5% | 2.1% | 13.0% | 8.2% | 15.2% | 35.3% | 14.2% | 14.1% |
| 2012 | 6.3% | 0.9% | 1.5% | 4.4% | 2.3% | 8.3% | 7.5% | 9.0% | 43.4% | 16.4% | 15.4% |
| 2013 | 8.6% | 1.8% | 1.3% | 4.5% | 2.7% | 7.8% | 7.8% | 8.8% | 44.3% | 12.5% | 18.8% |
| 2014 | 8.1% | 4.2% | 0.9% | 4.4% | 2.5% | 5.5% | 6.4% | 8.5% | 44.5% | 15.0% | 20.1% |
| 2015 | 8.2% | 6.0% | 0.9% | 4.4% | 2.6% | 5.4% | 6.0% | 9.2% | 44.0% | 13.5% | 21.9% |
| 2016 | 9.1% | 8.1% | 1.7% | 4.4% | 2.3% | 10.2% | 4.1% | 9.2% | 36.5% | 14.4% | 25.5% |
| 2017 | 9.4% | 10.2% | 2.7% | 4.4% | 2.4% | 14.7% | 4.1% | 9.1% | 33.7% | 9.3% | 29.0% |
| Year | Wind | Solar | Small hydro | Geothermal | Biomass | Large hydro | Coal | Nuclear | Natural gas | Renewable |
|---|---|---|---|---|---|---|---|---|---|---|
| 2009 | 3.0% | 0.4% | 2.0% | 6.2% | 2.9% | 12.1% | 1.8% | 15.2% | 56.3% | 14.5% |
| 2010 | 3.0% | 0.4% | 2.4% | 6.2% | 2.8% | 14.3% | 1.7% | 15.7% | 53.4% | 14.9% |
| 2011 | 3.8% | 0.5% | 3.1% | 6.3% | 2.9% | 18.2% | 1.6% | 18.2% | 45.4% | 16.6% |
| 2012 | 4.6% | 0.9% | 2.1% | 6.4% | 3.0% | 11.7% | 0.8% | 9.3% | 61.1% | 17.1% |
| 2013 | 6.4% | 2.2% | 1.7% | 6.3% | 3.2% | 10.4% | 0.5% | 9.0% | 60.5% | 19.6% |
| 2014 | 6.5% | 5.3% | 1.2% | 6.1% | 3.4% | 7.1% | 0.5% | 8.6% | 61.3% | 22.8% |
| 2015 | 6.2% | 7.7% | 1.2% | 6.1% | 3.2% | 5.9% | 0.3% | 9.5% | 59.9% | 24.5% |
| 2016 | 6.8% | 10.0% | 2.3% | 5.8% | 3.0% | 12.3% | 0.2% | 9.6% | 49.9% | 27.9% |
| 2017 | 6.2% | 11.8% | 3.1% | 5.7% | 2.8% | 17.9% | 0.2% | 8.7% | 43.4% | 29.7% |
| Year | Wind | Solar | Small hydro | Geothermal | Biomass | Large hydro | Coal | Nuclear | Natural gas | Total |
|---|---|---|---|---|---|---|---|---|---|---|
| 2002 | 3.5 | 0.9 | 4.4 | 13.9 | 7.1 | 26.9 | 27.6 | 34.4 | 90.9 | 209.7 |
| 2003 | 3.5 | 0.8 | 5.1 | 13.8 | 5.6 | 30.9 | 27.2 | 35.6 | 92.4 | 214.8 |
| 2004 | 4.3 | 0.7 | 4.7 | 14.0 | 5.9 | 29.7 | 28.6 | 30.2 | 105.0 | 223.1 |
| 2005 | 4.4 | 0.7 | 5.4 | 14.4 | 6.0 | 34.5 | 28.1 | 36.2 | 96.1 | 225.8 |
| 2006 | 4.9 | 0.6 | 5.8 | 13.5 | 5.7 | 43.1 | 17.6 | 32.0 | 107.0 | 230.1 |
| 2007 | 5.7 | 0.7 | 3.7 | 13.0 | 5.4 | 23.3 | 4.2 | 35.7 | 118.3 | 209.9 |
| 2008 | 5.7 | 0.7 | 3.7 | 12.9 | 5.7 | 21.0 | 4.0 | 32.5 | 122.2 | 208.5 |
| 2009 | 6.3 | 0.9 | 4.0 | 12.9 | 5.9 | 25.1 | 3.7 | 31.5 | 116.7 | 207.2 |
| 2010 | 6.2 | 0.9 | 5.0 | 12.7 | 5.8 | 29.3 | 3.4 | 32.2 | 109.8 | 205.4 |
| 2011 | 7.6 | 1.1 | 6.1 | 12.7 | 5.8 | 36.6 | 3.1 | 36.7 | 91.2 | 200.9 |
| 2012 | 9.2 | 1.8 | 4.3 | 12.7 | 6.0 | 23.2 | 1.6 | 18.5 | 121.7 | 199.1 |
| 2013 | 12.7 | 4.3 | 3.3 | 12.5 | 6.4 | 20.8 | 1.0 | 17.9 | 120.9 | 199.8 |
| 2014 | 13.1 | 10.6 | 2.7 | 12.2 | 6.8 | 13.7 | 1.0 | 17.0 | 122.0 | 199.2 |
| 2015 | 12.2 | 15.0 | 2.4 | 12.0 | 6.4 | 11.6 | 0.5 | 18.5 | 117.5 | 196.5 |
| 2016 | 13.5 | 19.8 | 4.6 | 11.6 | 5.9 | 24.2 | 0.3 | 18.9 | 98.8 | 198.2 |
| 2017 | 12.9 | 24.3 | 6.4 | 11.7 | 5.8 | 36.9 | 0.3 | 17.9 | 89.6 | 206.3 |
Petroleum
| Year | Gallons | Change |
|---|---|---|
| 2000 | 14,544,627,116 | |
| 2001 | 15,117,143,010 | +3.9% |
| 2002 | 15,513,415,849 | +2.6% |
| 2003 | 15,661,671,712 | +1.0% |
| 2004 | 15,908,278,251 | +1.6% |
| 2005 | 15,937,855,020 | +0.2% |
| 2006 | 15,825,386,719 | −0.7% |
| 2007 | 15,672,334,029 | −1.0% |
| 2008 | 15,032,229,963 | −4.1% |
| 2009 | 14,811,281,527 | −1.5% |
| 2010 | 14,868,892,787 | +0.4% |
| 2011 | 14,600,133,763 | −1.8% |
| 2012 | 14,504,794,174 | −0.7% |
| 2013 | 14,532,944,431 | +0.2% |
| 2014 | 14,702,632,422 | +1.2% |
| 2015 | 15,105,348,840 | +2.7% |
| 2016 | 15,487,956,872 | +2.5% |
California’s crude oil and natural gas deposits are located in six geological basins in the Central Valley and along the coast. California has more than a dozen of the United States' largest oil fields, including the Midway-Sunset Oil Field, the second largest oil field in the contiguous United States.
As of 2012, California's crude oil output accounted for about 8.3% of total U.S. production.[33] Drilling operations are concentrated primarily in Kern County and the Los Angeles basin.[33] Although there is also substantial offshore oil and gas production, there is a permanent moratorium on new offshore oil and gas leasing in California waters and a deferral of leasing in Federal waters.
California ranks third in the United States in petroleum refining capacity, behind Texas and Louisiana, and accounts for about 11% of total U.S. capacity, as of 2012.[33] In addition to oil from California, California's refineries process crude oil from Alaska and foreign suppliers. The refineries are configured to produce cleaner fuels, including reformulated motor gasoline and low-sulfur diesel, to meet strict Federal and State environmental regulations. As of 2017, California has 18 refineries with a capacity to process nearly 2,000,000 US barrels (240,000,000 l; 63,000,000 US gal; 52,000,000 imp gal) per day.[34][35]
Gasoline consumption fluctuates with economic conditions and gas prices, but has generally remained flat since 2000, despite increasing population.[36] In 2017, Texas surpassed California in gasoline consumption, despite California having 6 million more vehicles.[37] Most California motorists are required to use a special motor gasoline blend called California Clean Burning Gasoline (CA CBG).[38] By 2004, California completed a transition from methyl tertiary butyl-ether (MTBE) to ethanol as a gasoline oxygenate additive, making California the largest ethanol fuel market in the United States. There are four ethanol production plants in central and southern California, but most of California’s ethanol supply is transported from other states or abroad.
Natural gas
California natural gas production typically is less than 2 percent of total annual U.S. production and satisfies less than one-sixth of state demand.[39][40] California receives most of its natural gas by pipeline from production regions in the Rocky Mountains, the Southwest, and western Canada.[40] Some of this is seasonally stored in the Aliso Canyon Oil Field, and its 2015 leak caused California to install grid batteries to compensate.[41]
Sustainable energy
California has led the United States from 2010 to 2013 with its sustainable energy plans (also known as "clean energy"), with Clean Edge's Clean Energy Index for 2013 rating it at 91.7, with the second ranked state being Massachusetts, at 77.8, and Mississippi the lowest at 4.2. California is the only state with extensive deployment of wind, solar, and geothermal energy. California's venture capital investments in sustainable energy are greater than the other 49 states combined, at $2.2 billion in 2012.[42] In August 2018, California's legislature passed legislation that mandates completely carbon-free electricity generation by 2045.[43][44]
See also
References
- ↑ "California, State Energy Profile". Official Energy Statistics from the U.S. Government. Energy Information Administration. Retrieved 2007-10-02.
- 1 2 "Current and Expected Energy From Coal for California" (PDF). California Energy Commission. November 3, 2016.
- ↑ California OKs new transmission for renewables Reuters, December 17, 2009.
- ↑ "California ISO - Clean, green grid". Caiso.com.
- ↑ "California Renewables Portfolio Standard". California Public Utilities Commission.
- ↑ SunLab (1998).Solar Trough Systems Retrieved December 18, 2008.
- ↑ Sacrificing the desert to save the Earth LA Times February 5, 2012.
- ↑ "California Clean Energy Tour: Alta Wind Farm Powers Homes". California Energy Commission.
- ↑ SchdyInventTech (15 January 2013). "Vallecitos Boiling Water Reactor - 1958". YouTube.
- ↑ "NRC: Humboldt Bay". Nrc.gov. Retrieved 6 November 2017.
- ↑ "SCE Publishes 3,200 Pages of Documentation on Faulty SONGS Steam Generators - News - Nuclear Power News - Nuclear Street - Nuclear Power Plant News, Jobs, and Careers". Nuclearstreet.com.
- ↑ "Voters, in a First, Shut Down Nuclear Reactor". The New York Times. 8 June 1989.
- ↑ "PG&E To Close Diablo Canyon In 2025 - News - Nuclear Power News - Nuclear Street - Nuclear Power Plant News, Jobs, and Careers". Nuclearstreet.com. Retrieved 6 November 2017.
- ↑ Fracassa, Dominic (May 18, 2017). "California grid sets record, with 67% of power from renewables". San Francisco Chronicle.
- ↑ "AB 2514 - Energy Storage System Procurement Targets from Publicly Owned Utilities". California Public Utilities Commission.
- ↑ "California Energy Storage Showcase". California Public Utilities Commission.
- 1 2 Penn, Ivan; Menezes, Ryan (February 5, 2017). "A runaway energy industry is costing California billions". Los Angeles Times.
- ↑ The Opportunity of Energy Group-Buying EnPowered, April 18, 2016,
- ↑ "California - State Energy Profile Overview - U.S. Energy Information Administration (EIA)". Tonto.eia.doe.gov. Retrieved 6 November 2017.
- ↑ Peterson, Molly (February 26, 2013). "Los Angeles to end use of coal by 2025, says Mayor Antonio Villaraigosa". Southern California Public Radio.
- ↑ "New California Interconnection Ruling Increases Transparency and Limits Costs". Greentechmedia.com. Retrieved 14 August 2016.
- ↑ "How California Created a New System for Determining the Costs of Grid Connection". Greentechmedia.com. Retrieved 14 August 2016.
- ↑
- ↑ "AB-2868 Energy storage. (2015-2016)". Leginfo.legislaturte.ca.gov. Retrieved 14 October 2016.
- ↑ California Ramps Up Energy Storage Plans with Enactment of Four New Bills September 28, 2016
- ↑ Martinez, Sierra (November 1, 2011). "California Is Making History by Eliminating Its Growth in Peak Demand". Natural Resources Defense Council.
- ↑ "California ISO Peak Load History" (PDF). Caiso.com. Retrieved 22 June 2018.
- 1 2 3 "Total Electricity System Power". California Energy Commission. Retrieved 1 July 2018.
- ↑ U.S. Energy Information Administration, Electric Power Monthly, February
- ↑ "California Electrical Energy Generation". California Energy Commission. Retrieved 22 June 2018.
- ↑ "Net Taxable Gasoline Gallons" (PDF). California Board of Equalization. 2000–2009. Archived from the original (PDF) on April 2, 2010.
- ↑ "Net Taxable Gasoline Gallons" (PDF). California Board of Equalization. 2010–2016. Archived from the original (PDF) on June 13, 2017.
- 1 2 3 "Oil and Gas in California: The Industry and Its Economic Contribution in 2012" (PDF). Western States Petroleum Association. Los Angeles County Economic Development Corporation.
- ↑ "California Number and Capacity of Petroleum Refineries". U.S. Energy Information Administration. January 1, 2017.
- ↑ "California's Oil Refineries". California Energy Commission.
- ↑ "Economic Perspective" (PDF). California Board of Equalization. February 2013.
- ↑ Kohlman, Matt (March 31, 2017). "Pickup vs. Prius: Texas passes California as gasoline consumption king". S&P Global Platts.
- ↑ Board, California Air Resources. "Cleaner-Burning Gasoline: An Update". Arb.ca.gov. Retrieved 2017-02-16.
- ↑ "Natural Gas Annual 2006" (PDF). US Department of Energy. October 2007. pp. 1, 70. Archived from the original (PDF) on 2009-01-14. Retrieved 2009-01-11.
- 1 2 "Overview of Natural Gas in California". Energy Almanac. California Energy Commission. Archived from the original on 2009-04-30. Retrieved 2009-01-11.
- ↑ "Tesla, Greensmith, AES Deploy Aliso Canyon Battery Storage in Record Time". GTM. 31 January 2017. Retrieved 6 February 2017.
- ↑
- ↑ Ailworth, Erin; Lazo, Alejandro (2018-08-29). "California Lawmakers Vote to Mandate Carbon-Free Electricity Generation". Wall Street Journal. ISSN 0099-9660. Retrieved 2018-08-29.
- ↑ "California Lawmakers Set Goal for Carbon-Free Energy by 2045". Retrieved 2018-08-29.
External links
- Today's Outlook, California ISO
- Yesterday's Renewables Production, California ISO
- Energy Flow Chart (2000)
- Grid maps: South, Central, North