List of cleanest cities in India
| Cleanest Cities in India Indore Vijayawada, Mysore, NDMC | |||||||||||||||
|
The Ministry of Urban Development, Government of India, and the Central Pollution Control Board (CPCB) of India, annually publish National City Rating under the Swachh Bharat Abhiyan scheme. The rating includes around 500 cities, covering 72 percent of the urban population in India.
Until 2017, India was divided into five zones for the purpose of this survey and each city was scored on 19 indicators. The cities were classified into four colours: green, blue, black, and red, green being the cleanest city, and red the most polluted. None of the cities was rated as green—the best category in the exercise. However, during the 2017-18 senses survey, the parameters of assessment were modified, and cities were categorised, based on population, into metropolis, large, medium, and small cities, and assessment took place according to this categorisation.[1]
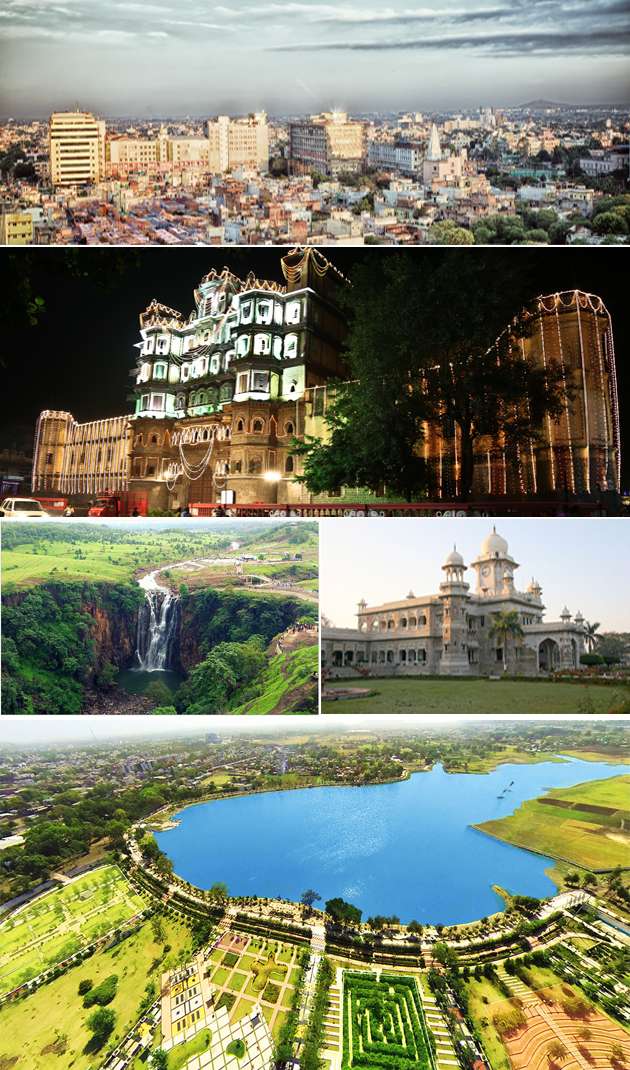
The latest ranking of 2018 by Swachh Bharat Abhiyan announced Indore as the cleanest cities in India for a second time.[1]
Summary
The Ministry of Urban Development ranks cities based on cleanliness index. This list summarises the cities topping those lists annually.
| Year | First | Runner up | |||
|---|---|---|---|---|---|
| City | State | City | State | ||
| 2018 | Metropolis | Indore | Madhya Pradesh | Bhopal | Madhya Pradesh |
| Large city | Vijayawada | Andhra Pradesh | |||
| Medium city | Mysore | Karnataka | |||
| Small city | New Delhi (Municipal Council) | Delhi | |||
| 2017 | Indore | Madhya Pradesh | Bhopal | Madhya Pradesh | |
| 2016 | Mysore | Karnataka | Chandigarh | Chandigarh Territory | |
| 2015 | Tiruchirapalli | Tamil Nadu | |||
| 2010 | Chandigarh | Union Territory of Chandigarh | Mysore | Karnataka | |
2017-2018
The dimensions of assessment increased during the 2017–18 survey, identifying cities and states to excel in different aspects of environment, energy, and cleanliness.
2016–2017
Swachh Sarvekshan 2017 was an extensive sanitation survey across 500 cities in India. The Ministry of Urban Development commissioned Quality Council of India to conduct this survey; to check the progress and impact of Swachh Bharat Abhiyan launched in 2014. It aims to foster a spirit of competition among the cities and offers a comprehensive assessment of their sanitation status.
The performance of each city was evaluated on five key thematic parameters-
- • Municipal solid waste - sweeping, collection and transportation
- • Municipal solid waste - processing and disposal of solid waste
- • Open defecation free/toilets
- • Capacity building and eLearning
- • Provision of public & community toilet seats
- • Information, education and communication, and behaviour change
Swachh Sarvekshan 2017 was conducted between 4 January 2017 and 7 February 2017.[2] The results of top 30 cities are as follows:
2015–2016
The Union Ministry of Urban Development commissioned an extensive survey to study the progress of Prime Minister Narendra Modi’s Swachh Bharat Mission and to rank 73 cities on sanitation and cleanliness. The survey, the first for the Swachh Bharat Mission, was conducted by the Quality Council of India (QCI) and was named Swachh Sarvekshan. It covered all state capitals and another 53 cities with a population of above one million. It involved three streams of data collection - interaction with municipal body, direct observation and citizen feedback. Swachh Sarvekshan evaluated the work done in the following six measurable aspects of sanitation and hygiene:
- • Strategy for Open Defecation Free town (ODF) and Integrated Solid Waste Management (SWM)
- • Information, Education and Behaviour Change Communication (IEBC) activity
- • Sweeping, door to door collection and transportation (of solid waste)
- • Processing and disposal (of solid waste)
- • Provision of public & community toilet seats
- • Construction of household individual toilets
Swachh Sarvekshan 2016 was conducted between 5 January 2016 and 20 January 2016.[4] The Results, as per the latest available sources, are as follows:
2014–2015
| Rank | City | State/Territory | Rating points (out of 20) | |
|---|---|---|---|---|
| 1 | Mysore | Karnataka | 18.50 | |
| 2 | Tiruchirapalli | Tamil Nadu | 14.25 | |
| 3 | Navi Mumbai | Maharashtra | 14.18 | |
| 4 | Kochi | Kerala | 14.07 | |
| 5 | Hassan | Karnataka | 13.58 | |
| 6 | Mandya | Karnataka | 13.52 | |
| 7 | Bengaluru | Karnataka | 13.27 | |
| 8 | Thiruvananthapuram | Kerala | 12.98 | |
| 9 | Halisahar | West Bengal | 12.75 | |
| 10 | Gangtok | Sikkim | 12.68 | |
| Source: Ministry of Urban Development[6] | ||||
According to the Central Pollution Control Board (CPCB) India, in 2015 it conducted a survey of the least polluted cities in India as well, ranked based on air quality. Among the least-polluted cities are Pathanamthitta, Mangalore, Wayanad, Hassan, and Palakkad. The table below shows the ranking of these cities as per the PM10 content in the air.[7][8]
| Rank | City | State/Territory | PM10 | |
|---|---|---|---|---|
| 1 | Pathanamthitta | Kerala | 23 | |
| 2 | Mangalore | Karnataka | 31 | |
| 3 | Wayanad | Kerala | 33 | |
| 4 | Hassan | Karnataka | 36 | |
| 5 | Palakkad | Kerala | 36 | |
| Source: Central Pollution Control Board (CPCB) India[7] | ||||
2009–2010
| Rank | City | State/Territory | Rating points | |
|---|---|---|---|---|
| 1 | Chandigarh | Union Territory of Chandigarh | 73.48 | |
| 2 | Mysore | Karnataka | 70.65 | |
| 3 | Surat | Gujarat | 69.08 | |
| 4 | New Delhi | Delhi | 68.265 | |
| 5 | Delhi Cantt. | Delhi | 61.367 | |
| 6 | Tiruchirappalli | Tamil Nadu | 59.02 | |
| 7 | Jamshedpur | Jharkhand | 57.960 | |
| 8 | Mangalore | Karnataka | 57.340 | |
| 9 | Rajkot | Gujarat | 56.118 | |
| 10 | Kanpur | Uttar Pradesh | 55.340 | |
| 11 | Navi Mumbai | Maharashtra | 53.920 | |
| 12 | Bangalore | Karnataka | 53.637 | |
| 13 | Chennai | Tamil Nadu | 53.630 | |
| 14 | Rourkela | Odisha | 53.400 | |
| 15 | Mandya | Karnataka | 53.330 | |
| 16 | Bidhannagar | West Bengal | 52.820 | |
| 17 | Noida | Uttar Pradesh | 51.910 | |
| 18 | Shillong | Meghalaya | 51.550 | |
| 19 | Ahmedabad | Gujarat | 50.286 | |
| 20 | Alandur | Tamil Nadu | 50.240 | |
| 21 | Haridwar | Uttarakhand | 49.850 | |
| 22 | Bidar | Karnataka | 49.820 | |
| 23 | Achalpur | Maharashtra | 49.666 | |
| 24 | Vijayawada | Andhra Pradesh | 49.060 | |
| 25 | Kolkata | West Bengal | 48.965 | |
| Source: Ministry of Urban Development[9] | ||||
See also
References
- 1 2 "Swachh Survekshan 2018 Report". Ministry of Urban Development. Retrieved 17 May 2018.
- ↑ "State-wise assessment schedule - Swachh Sarvekshan 2017" (PDF). 10 Jan 2017. Retrieved 11 May 2017.
- ↑ "Swachh Survekshan -2017 – ranks of 434 cities" (PDF).
- ↑ "Govt to measure success of Swachh Bharat Mission, rank 434 cities on performance". 9 Jan 2016. Retrieved 16 Feb 2016.
- ↑ "Swachh Survekshan -2016 – ranks of 73 cities".
- ↑ .
- 1 2 "CPCB - NATIONAL AMBIENT AIR QUALITY MONITORING NAAQMS 2014-2015" (PDF).
- ↑ "TERI (India) 2015 - Air Pollution and Health" (PDF).
- ↑ Ministry of Urban Development: RANK OF CITIES ON SANITATION 2009–2010, Ministry of Urban Development, 10 May 2010.