Vlasenica
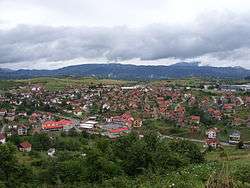
Vlasenica (Serbian Cyrillic: Власеница) is a town and municipality located in Republika Srpska, an entity of Bosnia and Herzegovina. As of 2013, it has a population 11,467 inhabitants, while the town of Vlasenica has a population of 7,228 inhabitants.
Vlasenica Власеница | |
|---|---|
Town and municipality | |
| Vlasenica | |
 Vlasenica | |
 Coat of arms | |
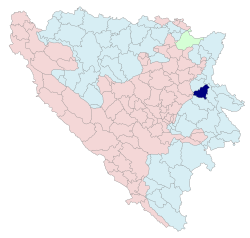 Location of Vlasenica within Bosnia and Herzegovina | |
 | |
| Coordinates: 44°11′N 18°56′E | |
| Country | |
| Entity | |
| Government | |
| • Mayor | Dragoslav Todorović (SDS) |
| Area | |
| • Total | 448.14 km2 (173.03 sq mi) |
| Population (2013 census) | |
| • Total | 11,467 |
| • Density | 26/km2 (66/sq mi) |
| Time zone | UTC+1 (CET) |
| • Summer (DST) | UTC+2 (CEST) |
| Area code(s) | 56 |
| Website | www |
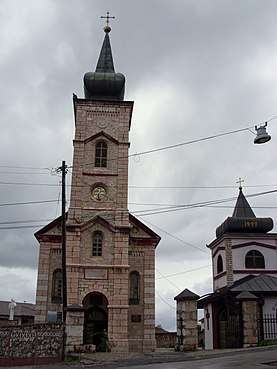
Vlasenica church
Demographics
Population
| Population of settlements – Vlasenica municipality | ||||||||||||||
|---|---|---|---|---|---|---|---|---|---|---|---|---|---|---|
| Settlement | 1879. | 1885. | 1895 | 1910. | 1921. | 1931. | 1948. | 1953. | 1961. | 1971. | 1981. | 1991. | 2013. | |
| Total | 19,420 | 23,085 | 24,927 | 30,928 | 28,865 | 37,532 | 26,623 | 30,498 | 33,817 | 11,467 | ||||
| 1 | Cerska | 1,409 | 689 | |||||||||||
| 2 | Grabovica | 537 | 342 | |||||||||||
| 3 | Gradina | 755 | 395 | |||||||||||
| 4 | Neđeljišta | 738 | 354 | |||||||||||
| 5 | Pustoše | 552 | 208 | |||||||||||
| 6 | Vlasenica | 4,121 | 7,283 | 3,047 | 3,976 | 6,000 | 7,909 | 7,228 | ||||||
Ethnic composition
| Ethnic composition – Vlasenica town | |||||||
|---|---|---|---|---|---|---|---|
| 2013. | 1991. | 1981. | 1971. | ||||
| Total | 7,228 (100,0%) | 7,909 (100,0%) | 6,000 (100,0%) | 3,976 (100,0%) | |||
| Bosniaks | 4,800 (60,69%) | 3,435 (57,25%) | 2,774 (69,77%) | ||||
| Serbs | 2,743 (34,68%) | 1,793 (29,88%) | 1,124 (28,27%) | ||||
| Yugoslavs | 242 (3,060%) | 578 (9,633%) | 5 (0,126%) | ||||
| Others | 98 (1,239%) | 22 (0,367%) | 25 (0,629%) | ||||
| Croats | 26 (0,329%) | 18 (0,300%) | 12 (0,302%) | ||||
| Roma | 98 (1,633%) | 25 (0,629%) | |||||
| Montenegrins | 28 (0,467%) | 7 (0,176%) | |||||
| Albanians | 22 (0,367%) | 3 (0,075%) | |||||
| Hungarians | 3 (0,050%) | ||||||
| Slovenes | 2 (0,033%) | ||||||
| Macedonians | 1 (0,017%) | 1 (0,025%) | |||||
| Ethnic composition – Vlasenica municipality | |||||||
|---|---|---|---|---|---|---|---|
| 2013. | 1991. | 1981. | 1971. | ||||
| Total | 11,467 (100,0%) | 17,761 (100,0%) | 30,498 (100,0%) | 26,623 (100,0%) | |||
| Serbs | 7,589 (66,18%) | 6,311 (35,53%) | 13,531 (44,37%) | 13,431 (50,45%) | |||
| Bosniaks | 3,763 (32,82%) | 10,897 (61,35%) | 15,337 (50,29%) | 12,881 (48,38%) | |||
| Others | 84 (0,733%) | 249 (1,402%) | 131 (0,430%) | 151 (0,567%) | |||
| Croats | 31 (0,270%) | 32 (0,180%) | 44 (0,144%) | 42 (0,158%) | |||
| Yugoslavs | 272 (1,531%) | 978 (3,207%) | 17 (0,064%) | ||||
| Roma | 352 (1,154%) | 53 (0,199%) | |||||
| Montenegrins | 81 (0,266%) | 28 (0,105%) | |||||
| Albanians | 33 (0,108%) | 14 (0,053%) | |||||
| Hungarians | 5 (0,016%) | 1 (0,004%) | |||||
| Slovenes | 4 (0,013%) | 3 (0,011%) | |||||
| Macedonians | 2 (0,007%) | 2 (0,008%) | |||||
Economy
The following table gives a preview of total number of registered people employed in legal entities per their core activity (as of 2018):[1]
| Activity | Total |
|---|---|
| Agriculture, forestry and fishing | 108 |
| Mining and quarrying | - |
| Manufacturing | 257 |
| Electricity, gas, steam and air conditioning supply | 86 |
| Water supply; sewerage, waste management and remediation activities | 56 |
| Construction | 28 |
| Wholesale and retail trade, repair of motor vehicles and motorcycles | 217 |
| Transportation and storage | 31 |
| Accommodation and food services | 55 |
| Information and communication | 9 |
| Financial and insurance activities | 17 |
| Real estate activities | - |
| Professional, scientific and technical activities | 20 |
| Administrative and support service activities | 4 |
| Public administration and defense; compulsory social security | 170 |
| Education | 133 |
| Human health and social work activities | 107 |
| Arts, entertainment and recreation | 10 |
| Other service activities | 32 |
| Total | 1,340 |
Notable people
- Lazar Jovanović, 19th-century manuscript writer
- Derviš Sušić
- Flory Jagoda
- Vedad Ibišević
- Fahrudin Kuduzović
- Nedžmin Ambešković, strongman
- Salko Zildžić, boxer, Party of Democratic Action politician
- Isnam Taljić, writer
See also
- Municipalities of Republika Srpska
- Massacres of Serbs in Rašića Gaj
Notes
- "Cities and Municipalities of Republika Srpska" (PDF). rzs.rs.ba. Republika Srspka Institute of Statistics. 25 December 2019. Retrieved 31 December 2019.
External links
| Wikimedia Commons has media related to Vlasenica. |
This article is issued from Wikipedia. The text is licensed under Creative Commons - Attribution - Sharealike. Additional terms may apply for the media files.