Oštra Luka
Oštra Luka (Serbian Cyrillic: Оштра Лука) is a village and a municipality located in Republika Srpska, an entity of Bosnia and Herzegovina. As of 2013, it has a population of 2,786 inhabitants, while the town of Oštra Luka has a population of 817 inhabitants.
Oštra Luka Оштра Лука | |
|---|---|
Village and municipality | |
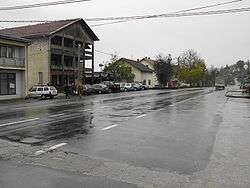 Main street in Oštra Luka | |
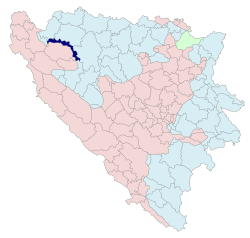 Location of Oštra Luka within Bosnia and Herzegovina | |
 | |
| Coordinates: 44°51′17″N 16°40′51″E | |
| Country | Bosnia and Herzegovina |
| Entity | Republika Srpska |
| Government | |
| • Mayor | Drena Kuridža (SNSD) |
| Area | |
| • Total | 204.91 km2 (79.12 sq mi) |
| Population (2013 census) | |
| • Total | 2,786 |
| • Density | 14/km2 (35/sq mi) |
| Time zone | UTC+1 (CET) |
| • Summer (DST) | UTC+2 (CEST) |
| Area code(s) | 52 |
| Website | www |
The municipality is situated in the northwestern part of the Republika Srpska and the central part of the Bosanska Krajina region. It was also known as Srpski Sanski Most (Српски Сански Мост, "Serb Sanski Most") and was formed after the Dayton Agreement from part of the pre-war municipality of Sanski Most (the other part of the pre-war municipality is now in the entity of Federation of Bosnia and Herzegovina).
Geography
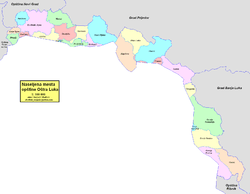
The municipality is located between the municipalities of Bosanski Novi/Novi Grad and Prijedor in the north, Banja Luka in the east, Ribnik in the south, Sanski Most in the south and west, and Bosanska Krupa in the west.
Demographics
Population
| Population of settlements – Oštra Luka municipality | |||||
|---|---|---|---|---|---|
| Settlement | 1971. | 1981. | 1991. | 2013. | |
| Total | 2,786 | 2,786 | |||
| 1 | Donja Kozica | 225 | |||
| 2 | Koprivna | 524 | |||
| 3 | Oštra Luka | 759 | 867 | 838 | 817 |
| 4 | Usorci | 434 | |||
Ethnic composition
| Ethnic composition – Oštra Luka town | |||||||
|---|---|---|---|---|---|---|---|
| 2013. | 1991. | 1981. | 1971. | ||||
| Total | 817 (100,0%) | 838 (100,0%) | 867 (100,0%) | 759 (100,0%) | |||
| Serbs | 778 (92,84%) | 557 (64,24%) | 743 (97,89%) | ||||
| Croats | 32 (3,819%) | 28 (3,230%) | 8 (1,054%) | ||||
| Yugoslavs | 17 (2,029%) | 252 (29,07%) | 3 (0,395%) | ||||
| Bosniaks | 7 (0,835%) | 10 (1,153%) | 4 (0,527%) | ||||
| Others | 4 (0,477%) | 20 (2,307%) | 1 (0,132%) | ||||
| Ethnic composition – Oštra Luka municipality | |||||||
|---|---|---|---|---|---|---|---|
| 2013. | 1991. | ||||||
| Total | 2,786 (100,0%) | 2,117 (100,0%) | |||||
| Serbs | 2,580 (92,61%) | 1,407 (66,46%) | |||||
| Croats | 160 (5,743%) | 401 (18,94%) | |||||
| Bosniaks | 23 (0,826%) | 261 (12,33%) | |||||
| Others | 23 (0,826%) | 16 (0,756%) | |||||
| Yugoslavs | 32 (1,512%) | ||||||
References
External links
| Wikimedia Commons has media related to Oštra Luka. |