Šamac, Bosnia and Herzegovina
Šamac (Serbian Cyrillic: Шамац, pronounced [ʃâmat͡s])[1] is a town and municipality located in the northeastern part of the Republika Srpska, an entity of Bosnia and Herzegovina. As of 2013, the town has a population of 5,390 inhabitants, while the municipality has 17,273 inhabitants. It is situated on the right bank of the Sava river. Across the river is Slavonski Šamac in Croatia.
Šamac Шамац | |
|---|---|
Town and municipality | |
 Šamac | |
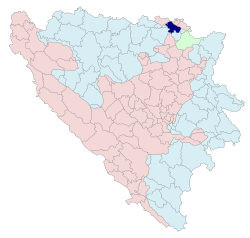 Location of Šamac within Republika Srpska | |
 | |
| Coordinates: 45°03′38″N 18°28′3″E | |
| Country | |
| Entity | |
| Government | |
| • Mayor | Đorđe Milićević (SNSD) |
| • Municipality | 177.54 km2 (68.55 sq mi) |
| Population (2013 census) | |
| • Town | 5,390 |
| • Municipality | 17,273 |
| • Municipality density | 97/km2 (250/sq mi) |
| Time zone | UTC+1 (CET) |
| • Summer (DST) | UTC+2 (CEST) |
| Area code(s) | 54 |
| Website | www |
History
The city was founded by Bosnian settlers from Ottoman province of Smederevo in 1862. It was part of the Ottoman province of Bosnia by the time it was annexed by Austro-Hungarian Empire in 1887. After World War I, the city became part of the Kingdom of Yugoslavia. From 1929 to 1939, it was part of Drina Banovina; and from 1939 until 1941 it was part of the Banovina of Croatia. During World War II, Šamac, as all the rest of Bosnia-Herzegovina, was included into Nazi-controlled Independent State of Croatia. After 1945, the city was reintegrated within the Socialist Republic of Bosnia and Herzegovina in Tito's Yugoslavia.
In the early stages of the Bosnian war the town was occupied by Bosnian Serbs who established the provisional municipal government. Most Bosniaks and Bosnian Croats were ethnically cleansed.[2][3] During the war, a semi-permanent front line was established against Croatian and Bosniak forces towards the neighboring Orašje. In 2003, three Bosnian Serb town leaders at the time of the Yugoslav Wars were sentenced in ICTY for crimes against humanity.[4]
The town lies on an important strategic position in Republika Srpska, near Brčko. As with most other places under Serb control, Srpska authorities removed the "Bosnian" adjective from the town's official name and changed it to "Šamac". Bosniaks and Bosnian Croats continued to refer to it by its historical name of "Bosanski Šamac" (Serbian Cyrillic: Босански Шамац, pronounced [bǒsanskiː ʃâmat͡s]).[1] In 2004 the constitutional court of Bosnia and Herzegovina stated the name “Šamac” was unconstitutional and therefore the official name was changed back to “Bosanski Šamac”.
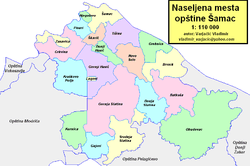
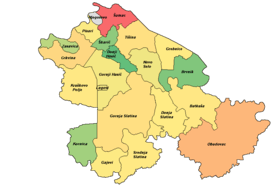
Settlements
Aside from the town of Šamac, the municipality includes the following settlements:
- Batkuša
- Brvnik
- Crkvina
- Donja Slatina
- Donji Hasić
- Gajevi
- Gornja Slatina
- Gornji Hasić
- Grebnice
- Kornica
- Kruškovo Polje
- Lugovi
- Novo Selo
- Obudovac
- Pisari
- Srednja Slatina
- Škarić
- Tišina
- Zasavica
Demographics
Population
| Population of settlements – Šamac municipality | ||||||||
|---|---|---|---|---|---|---|---|---|
| 1948. | 1953. | 1961. | 1971. | 1981. | 1991. | 2013. | ||
| Total | 37,512 | 44,269 | 31,374 | 32,320 | 32,960 | 17,273 | ||
| 1 | Batkuša | 924 | 625 | |||||
| 2 | Brvnik | 609 | 253 | |||||
| 3 | Crkvina | 1,704 | 1,223 | |||||
| 4 | Donja Slatina | 623 | 471 | |||||
| 5 | Donji Hasić | 1,029 | 207 | |||||
| 6 | Gajevi | 626 | 438 | |||||
| 7 | Gornja Slatina | 1,361 | 903 | |||||
| 8 | Gornji Hasić | 1,048 | 427 | |||||
| 9 | Grebnice | 443 | ||||||
| 10 | Kornica | 830 | 302 | |||||
| 11 | Kruškovo Polje | 706 | 588 | |||||
| 12 | Lugovi | 422 | ||||||
| 13 | Novo Selo | 1,095 | 419 | |||||
| 14 | Obudovac | 3,199 | 2,421 | |||||
| 15 | Pisari | 608 | 436 | |||||
| 16 | Šamac | 4,877 | 5,605 | 6,239 | 5,390 | |||
| 17 | Škarić | 298 | 273 | |||||
| 18 | Srednja Slatina | 1,277 | 519 | |||||
| 19 | Tišina | 2,032 | 890 | |||||
| 20 | Zasavica | 558 | 339 | |||||
Ethnic composition
| Ethnic composition – Šamac town | |||||||
|---|---|---|---|---|---|---|---|
| 2013. | 1991. | 1981. | 1971. | ||||
| Total | 5,390 (100,0%) | 6,239 (100,0%) | 5,605 (100,0%) | 4,877 (100,0%) | |||
| Serbs | 3,449 (67,19%) | 1,755 (28,13%) | 1,342 (23,94%) | 1,500 (30,76%) | |||
| Bosniaks | 1,253 (24,41%) | 2,178 (34,91%) | 1,697 (30,28%) | 2,163 (44,35%) | |||
| Croats | 227 (4,422%) | 827 (13,26%) | 687 (12,26%) | 726 (14,89%) | |||
| Others | 204 (3,974%) | 284 (4,552%) | 61 (1,088%) | 38 (0,779%) | |||
| Yugoslavs | 1 195 (19,15%) | 1 774 (31,65%) | 429 (8,796%) | ||||
| Albanians | 22 (0,393%) | 3 (0,062%) | |||||
| Montenegrins | 13 (0,232%) | 8 (0,164%) | |||||
| Slovenes | 5 (0,089%) | 3 (0,062%) | |||||
| Hungarians | 4 (0,071%) | 4 (0,082%) | |||||
| Macedonians | 3 (0,062%) | ||||||
| Ethnic composition – Šamac municipality | |||||||
|---|---|---|---|---|---|---|---|
| 2013. | 1991. | 1981. | 1971. | ||||
| Total | 17,273 (100,0%) | 32,960 (100,0%) | 32,320 (100,0%) | 31,374 (100,0%) | |||
| Serbs | 13,256 (76,74%) | 13,628 (41,35%) | 13,328 (41,24%) | 14,230 (45,36%) | |||
| Croats | 2,426 (14,05%) | 14,731 (44,69%) | 14,327 (44,33%) | 14,336 (45,69%) | |||
| Bosniaks | 1,265 (7,324%) | 2,233 (6,775%) | 1,725 (5,337%) | 2,192 (6,987%) | |||
| Others | 326 (1,887%) | 613 (1,860%) | 262 (0,811%) | 88 (0,280%) | |||
| Yugoslavs | 1,755 (5,325%) | 2 601 (8,048%) | 481 (1,533%) | ||||
| Montenegrins | 33 (0,102%) | 25 (0,080%) | |||||
| Montenegrins | 27 (0,084%) | 8 (0,025%) | |||||
| Hungarians | 7 (0,022%) | 4 (0,013%) | |||||
| Slovenes | 6 (0,019%) | 6 (0,019%) | |||||
| Macedonians | 4 (0,012%) | 4 (0,013%) | |||||
Economy
The following table gives a preview of total number of registered employed people per their core activity (as of 2016):[5]
| Activity | Total |
|---|---|
| Agriculture, forestry and fishing | 84 |
| Mining and quarrying | 40 |
| Manufacturing | 426 |
| Distribution of power, gas, steam and air-conditioning | 31 |
| Distribution of water and water waste management | 19 |
| Construction | 5 |
| Wholesale and retail, repair | 417 |
| Transportation and storage | 182 |
| Hotels and restaurants | 117 |
| Information and communication | 6 |
| Finance and insurance | 20 |
| Real estate activities | - |
| Professional, scientific and technical activities | 57 |
| Administrative and support services | 7 |
| Public administration and defence | 176 |
| Education | 248 |
| Healthcare and social work | 122 |
| Art, entertainment and recreation | 8 |
| Other service activities | 7 |
| Total | 1,972 |
Sport
The local football club, FK Borac Šamac, plays in the First League of the Republika Srpska.
Gallery
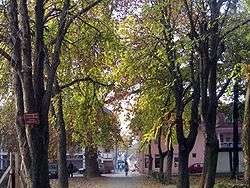
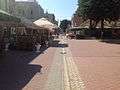 Main square
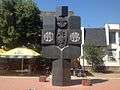 Monument to Serb casualties of the Bosnian War
Notable people
- Ljubo Miloš (1919–1948), Croatian World War II official and concentration camp commandant executed for war crimes
- Alija Izetbegović (1925–2003), first President of Bosnia and Herzegovina
- Sulejman Tihić (1951–2014), Bosniak member of the Presidency of Bosnia and Herzegovina
- Zoran Đinđić (1952–2003), former prime minister of Serbia
- Srebrenko Repčić (b. 1954), former football player
- Predrag Nikolić (b. 1960), chess Grand Master
- Darijo Srna (b. 1982), footballer
- Stevo Nikolić (b. 1984), footballer
- Mario Mandžukić (b. 1986), footballer
See also
Notes
- Mangold (2005:212)
- War Crimes in Bosnia-Hercegovina: Bosanski Samac — Six War Criminals Named by Victims of “Ethnic Cleansing”, Human Rights Watch, April 1994
- FACE TO FACE WITH EVIL, Time magazine, May 13, 1996
- International Criminal Tribunal for the Former Yugoslavia (ICTY) (Trial Chamber II): Prosecutor v. Blagoje Simic, Mirolsav Tadic and Simo Zadic (October 17, 2003) Archived February 6, 2012, at the Wayback Machine
- "Cities and Municipalities of Republika Srpska 2017" (PDF). rzs.rs.ba (in Serbian). December 2017. Retrieved 21 October 2018.
References
- Official results from the book: Ethnic composition of Bosnia-Herzegovina population, by municipalities and settlements, 1991. census, Zavod za statistiku Bosne i Hercegovine - Bilten no.234, Sarajevo 1991.
- Mangold, Max (2005), Das Aussprachewörterbuch, Duden, ISBN 9783411040667
External links
| Wikimedia Commons has media related to Šamac. |