Han Pijesak
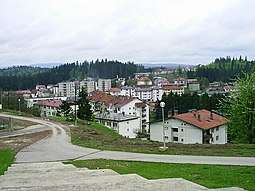
Han Pijesak (Serbian Cyrillic: Хан Пијесак) is a town and municipality located in Republika Srpska, an entity of Bosnia and Herzegovina. As of 2013, it has a population of 3,530 inhabitants, while the town of Han Pijesak has a population of 2,018 inhabitants.
Han Pijesak Хан Пијесак | |
|---|---|
Town and municipality | |
 Han Pijesak | |
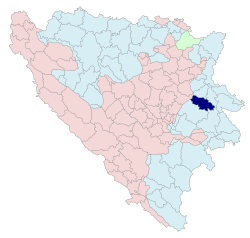 Location of Han Pijesak within Bosnia and Herzegovina | |
 | |
| Coordinates: 44°05′N 18°57′E | |
| Country | Bosnia and Herzegovina |
| Entity | Republika Srpska |
| Government | |
| • Mayor | Milan Borovina (SDS) |
| Area | |
| • Total | 322.9 km2 (124.7 sq mi) |
| Population (2013 census) | |
| • Total | 3,530 |
| • Density | 11/km2 (28/sq mi) |
| Time zone | UTC+1 (CET) |
| • Summer (DST) | UTC+2 (CEST) |
| Area code(s) | 57 |
| Website | www |
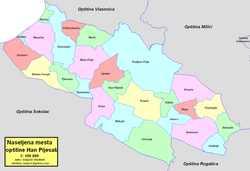
Settlements
Aside from the town of Han Pijesak, the municipality consists of the following settlements:
Demographics
Population
| Population of settlements – Han Pijesak municipality | |||||
|---|---|---|---|---|---|
| Setllement | 1971. | 1981. | 1991. | 2013. | |
| Total | 7,804 | 6,879 | 6,348 | 3,530 | |
| 1 | Han Pijesak | 1,487 | 1,695 | 2,117 | 2,018 |
| 2 | Japaga | 152 | 205 | ||
| 3 | Kraljevo Polje | 349 | 393 | ||
Ethnic composition
| Ethnic comosition – Han Pijesak town | |||||||
|---|---|---|---|---|---|---|---|
| 2013. | 1991. | 1981. | 1971. | ||||
| Total | 2,018 (100,0%) | 2,117 (100,0%) | 1,695 (100,0%) | 1,487 (100,0%) | |||
| Serbs | 1,873 (88,47%) | 1,413 (83,36%) | 1,326 (89,17%) | ||||
| Bosniaks | 148 (6,991%) | 82 (4,838%) | 108 (7,263%) | ||||
| Yugoslavs | 55 (2,598%) | 160 (9,440%) | 3 (0,202%) | ||||
| Others | 38 (1,795%) | 9 (0,531%) | 6 (0,403%) | ||||
| Croats | 3 (0,142%) | 3 (0,177%) | 4 (0,269%) | ||||
| Montenegrins | 17 (1,003%) | 19 (1,278%) | |||||
| Albanians | 9 (0,531%) | 11 (0,740%) | |||||
| Macedonians | 2 (0,118%) | 6 (0,403%) | |||||
| Slovenes | 4 (0,269%) | ||||||
| Ethnic composition – Han Pijesak municipality | |||||||
|---|---|---|---|---|---|---|---|
| 2013. | 1991. | 1981. | 1971. | ||||
| Total | 3,530 (100,0%) | 6,348 (100,0%) | 6,879 (100,0%) | 7,804 (100,0%) | |||
| Serbs | 3,068 (86,91%) | 3,674 (57,88%) | 3,927 (57,09%) | 4,790 (61,38%) | |||
| Bosniaks | 431 (12,21%) | 2,543 (40,06%) | 2,666 (38,76%) | 2,921 (37,43%) | |||
| Others | 24 (0,680%) | 56 (0,882%) | 18 (0,262%) | 11 (0,141%) | |||
| Croats | 7 (0,198%) | 7 (0,110%) | 9 (0,131%) | 16 (0,205%) | |||
| Yugoslavs | 68 (1,071%) | 222 (3,227%) | 7 (0,090%) | ||||
| Montenegrins | 24 (0,349%) | 28 (0,359%) | |||||
| Albanians | 9 (0,131%) | 19 (0,243%) | |||||
| Macedonians | 3 (0,044%) | 8 (0,103%) | |||||
| Slovenes | 1 (0,015%) | 4 (0,051%) | |||||
Economy
The following table gives a preview of total number of registered people employed in legal entities per their core activity (as of 2018):[1]
| Activity | Total |
|---|---|
| Agriculture, forestry and fishing | 437 |
| Mining and quarrying | 1 |
| Manufacturing | 100 |
| Electricity, gas, steam and air conditioning supply | 15 |
| Water supply; sewerage, waste management and remediation activities | 25 |
| Construction | 16 |
| Wholesale and retail trade, repair of motor vehicles and motorcycles | 40 |
| Transportation and storage | 32 |
| Accommodation and food services | 21 |
| Information and communication | 2 |
| Financial and insurance activities | 6 |
| Real estate activities | - |
| Professional, scientific and technical activities | 3 |
| Administrative and support service activities | 1 |
| Public administration and defense; compulsory social security | 105 |
| Education | 37 |
| Human health and social work activities | 28 |
| Arts, entertainment and recreation | 14 |
| Other service activities | 2 |
| Total | 884 |
References
- "Cities and Municipalities of Republika Srpska" (PDF). rzs.rs.ba. Republika Srspka Institute of Statistics. 25 December 2019. Retrieved 31 December 2019.
External links
| Wikimedia Commons has media related to Han Pijesak. |
This article is issued from Wikipedia. The text is licensed under Creative Commons - Attribution - Sharealike. Additional terms may apply for the media files.