1872 Canadian federal election
The 1872 Canadian federal election was held from July 20 to October 12, 1872, to elect members of the House of Commons of Canada of the 2nd Parliament of Canada. Prime Minister Sir John A. Macdonald's Conservative Party remained in power, defeating the Liberals. However, the Liberals increased their parliamentary representation considerably, while the Conservative seat count remained static, giving them only five more seats than the Liberals. This technically resulted in the country's first minority government, though the support of two independent Conservative MPs functionally gave Macdonald an extremely slim majority.
| ||||||||||||||||||||||||||||||||||
200 seats in the House of Commons 101 seats needed for a majority | ||||||||||||||||||||||||||||||||||
|---|---|---|---|---|---|---|---|---|---|---|---|---|---|---|---|---|---|---|---|---|---|---|---|---|---|---|---|---|---|---|---|---|---|---|
| Turnout | 70.3%[1] ( | |||||||||||||||||||||||||||||||||
| ||||||||||||||||||||||||||||||||||
| ||||||||||||||||||||||||||||||||||


Edward Blake, who had a seat in both the House of Commons of Canada and the Ontario legislature, resigned as Premier of Ontario in order to run in the 1872 federal election as dual mandates had been abolished. Had the Liberals won the election, he likely would have been offered the position of Prime Minister of Canada. The party had no formal leader as such until 1873 when Alexander Mackenzie was given the title after Blake declined due to ill health. Blake was ill during much of the 1872 campaign, and it was Mackenzie who essentially led the Liberal campaign in Ontario, though not outside the province.
The 1872 general election was the first to include the new provinces of Manitoba and British Columbia, which had both joined Canada after the Confederation of 1867. By-elections had been held in both provinces to elect Members of Parliament in the newly created ridings, with Manitoba receiving four seats and British Columbia five.
Results
National
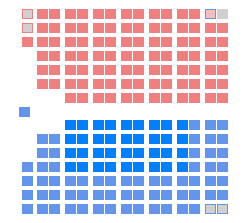

| ↓ | ||||
| 100 | 95 | 5 | ||
| Conservative | Liberal | O | ||
| 2nd Parliament | |||||||||
|---|---|---|---|---|---|---|---|---|---|
| Party | Party leader | # of candidates | Seats | Popular vote | |||||
| 1867 | Elected | Change | # | % | Change | ||||
| Conservative | Sir John A. Macdonald | 92 | 71 | 63 | -11.3% | 82,024 | 25.76% | +2.31pp | |
| Liberal-Conservative1 | 48 | 29 | 36 | +24.1% | 41,076 | 12.90% | +1.82pp | ||
| Liberal | none (unofficially, Edward Blake) | 111 | 62 | 95 | +53.2% | 110,556 | 34.72% | +12.05pp | |
| Independents | 4 | - | 1 | 5,213 | 1.64% | +1.25pp | |||
| Independent Conservative | 3 | - | 2 | 2,220 | 0.70% | +0.70pp | |||
| Independent Liberal | 4 | - | 2 | 5,232 | 1.64% | +0.98pp | |||
| Conservative Labour | 1 | - | 1 | 1,422 | 0.45% | +0.45pp | |||
| Unknown | 104 | - | - | - | 70,704 | 22.20% | -11.64pp | ||
| Total | 367 | 180 | 200 | +11.1 | 320,037 | 100% | |||
| Source: Parliament of Canada | |||||||||
Note: 1 Though identifying themselves as Liberal-Conservatives, these MPs and those identifying as Conservatives were both led by Sir John A. Macdonald (himself a Liberal-Conservative) and sat together in the House of Commons.
Acclamations
The following MPs were acclaimed:
- British Columbia: 3 Liberal-Conservatives
- Manitoba: 1 Liberal-Conservative
- Ontario: 3 Conservatives, 3 Liberal-Conservatives, 10 Liberals
- Quebec: 9 Conservatives, 5 Liberal-Conservatives, 5 Liberals
- New Brunswick: 6 Liberals
- Nova Scotia: 1 Conservative, 4 Liberal-Conservatives, 2 Liberals
Results by province
| Party name | BC | Manitoba | Ontario | Quebec | NB | NS | Total | ||
|---|---|---|---|---|---|---|---|---|---|
| Conservative | Seats | 1 | 1 | 26 | 26 | 2 | 7 | 63 | |
| Popular vote | 4.5 | 29.7 | 25.9 | 31.5 | 8.4 | 23.5 | 25.8 | ||
| Liberal-Conservative | Seats | 3 | 1 | 12 | 11 | 3 | 6 | 36 | |
| Vote | 11.9 | 10.5 | 17.8 | 19.8 | 12.9 | ||||
| Liberal | Seats | 2 | 1 | 48 | 27 | 9 | 8 | 95 | |
| Vote | 83.7 | 35.6 | 35.3 | 32.6 | 46.8 | 28.1 | 34.7 | ||
| Conservative Labour | Seats | 1 | 1 | ||||||
| Vote | 0.9 | 0.4 | |||||||
| Unknown | Seats | - | - | - | - | - | - | - | |
| Vote | 11.8 | 14.9 | 23.4 | 21.5 | 26.9 | 16.4 | 22.2 | ||
| Independent | Seats | - | - | 1 | - | 1 | |||
| Vote | 0.8 | 1.7 | 6.1 | 1.6 | |||||
| Independent Liberal | Seats | 1 | 1 | 2 | |||||
| Vote | 1.7 | 6.1 | 1.6 | ||||||
| Independent Conservative | Seats | 1 | 1 | 2 | |||||
| Vote | 19.8 | 2.2 | 0.7 | ||||||
| Total seats | 6 | 4 | 88 | 65 | 16 | 21 | 200 | ||
Vote and seat summaries
References
- "Voter Turnout at Federal Elections and Referendums". Elections Canada. Retrieved 10 March 2019.