1891 Canadian federal election
The 1891 Canadian federal election was held on March 5 to elect members of the House of Commons of Canada of the 7th Parliament of Canada. It was won by the Conservative Party of Prime Minister Sir John A. Macdonald.

| ||||||||||||||||||||||||||||||||||
215 seats in the House of Commons 108 seats needed for a majority | ||||||||||||||||||||||||||||||||||
|---|---|---|---|---|---|---|---|---|---|---|---|---|---|---|---|---|---|---|---|---|---|---|---|---|---|---|---|---|---|---|---|---|---|---|
| Turnout | 64.4%[1] ( | |||||||||||||||||||||||||||||||||
| ||||||||||||||||||||||||||||||||||
| ||||||||||||||||||||||||||||||||||
_-_tight_crop.jpg)
The main issue of the 1891 campaign was Macdonald's National Policy, a policy of protective tariffs. The Liberals supported reciprocity (free trade) with the United States.
Macdonald led a conservative campaign emphasizing stability, and retained the Conservatives' majority in the House of Commons. It was a close election and he campaigned hard. Macdonald died a few months after the election, which led to his succession by four different Conservative Prime Ministers until the 1896 election.
Senator John Abbott succeeded Macdonald as Conservative leader and Prime Minister after Macdonald's death on June 6, 1891. Abbott's most famous political comment was "I hate politics." He had in fact supported John Sparrow David Thompson to succeed Macdonald. Abbott, in failing health, was finally succeeded by Thompson in 1892. Mackenzie Bowell, another senator, succeeded Thompson after his sudden death from a heart attack on December 12, 1894. Bowell was ousted by several of his own cabinet ministers and replaced by Charles Tupper in April 1896, who led the Conservatives in the June 1896 election.
It was Wilfrid Laurier's first election as leader of the Liberals. Although he lost the election, he increased the Liberals' support. He returned in 1896 to win a solid majority, despite losing the popular vote.
Canadian voters would return to the issue of free trade 20 years later in the 1911 federal election.
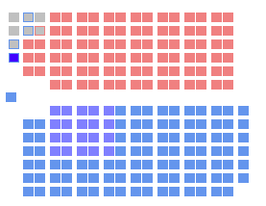
National results

| ↓ | ||||
| 117 | 90 | 8 | ||
| Conservative | Liberal | O | ||
| Party | Party leader | # of candidates |
Seats | Popular vote | |||||
|---|---|---|---|---|---|---|---|---|---|
| 1887 | Elected | Change | # | % | Change | ||||
| Conservative | John A. Macdonald | 187 | 87 | 97 | +11.5% | 332,961 | 42.96% | +2.80pp | |
| Liberal-Conservative | 25 | 24 | 20 | -16.7% | 43,557 | 5.62% | -1.64pp | ||
| Liberal | Wilfrid Laurier | 194 | 79 | 90 | +13.9% | 350,512 | 45.22% | +2.09pp | |
| Independent Conservative | 4 | 3 | 3 | - | 15,045 | 1.94% | +0.38pp | ||
| Independent | 4 | 3 | 2 | -66.7% | 6,357 | 0.82% | -0.42pp | ||
| Nationalist | 1 | 1 | 1 | - | -1 | 0.00% | -0.66pp | ||
| Independent Liberal | 2 | 5 | 1 | -80% | 5,573 | 0.72% | -1.45pp | ||
| Nationalist Conservative | 1 | 2 | 1 | -50% | 1,271 | 0.16% | -0.32pp | ||
| Unknown | 14 | 1 | - | -100% | 16,890 | 2.18% | -1.15pp | ||
| Equal Rights | 2 | * | - | * | 2,455 | 0.32% | * | ||
| Progressive2 | 2 | * | - | * | 468 | 0.06% | * | ||
| Total | 436 | 205 | 215 | +4.9% | 775,089 | 100% | |||
| Sources: http://www.elections.ca -- History of Federal Ridings since 1867 | |||||||||
Notes:
* Party did not nominate candidates in the previous election.
1 One Nationalist candidate was elected by acclamation.
2 The Parliamentary website identifies two candidates in Nova Scotia as being "Progressives". This may be an error.
Acclamations:
The following Members of Parliament were elected by acclamation;
- British Columbia: 1 Conservative, 1 Liberal-Conservative
- Manitoba: 1 Conservative
- Ontario: 1 Conservative
- Quebec: 1 Conservative, 2 Liberal, 1 Nationalist
Results by province
| Party name | BC | NW | MB | ON | QC | NB | NS | PE | Total | ||
|---|---|---|---|---|---|---|---|---|---|---|---|
| Conservative | Seats: | 5 | 4 | 1 | 39 | 24 | 10 | 12 | 2 | 97 | |
| Popular vote (%): | 71.6 | 81.0 | 12.6 | 42.2 | 45.4 | 48.9 | 41.9 | 48.5 | 43.0 | ||
| Liberal-Conservative | Seats: | 1 | 3 | 7 | 3 | 2 | 4 | 20 | |||
| Vote (%): | 40.5 | 5.3 | 3.0 | 3.7 | 10.8 | 5.6 | |||||
| Liberal | Seats: | - | - | 1 | 44 | 33 | 4 | 5 | 3 | 90 | |
| Vote (%): | 28.4 | 19.0 | 46.9 | 49.1 | 45.9 | 41.3 | 43.6 | 41.0 | 45.2 | ||
| Independent Conservative | Seats: | 1 | 2 | 3 | |||||||
| Vote (%): | 1.3 | 5.9 | 1.9 | ||||||||
| Independent | Seats: | 1 | 1 | - | 2 | ||||||
| Vote (%): | 0.7 | 1.2 | 3.2 | 0.8 | |||||||
| Nationalist | Seats: | 1 | 1 | ||||||||
| Vote (%): | - | - | |||||||||
| Independent Liberal | Seats: | - | 1 | 1 | |||||||
| Vote (%): | 2.9 | 10.5 | 0.7 | ||||||||
| Nationalist Conservative | Seats: | 1 | 1 | ||||||||
| Vote (%): | 0.7 | 0.2 | |||||||||
| Total seats | 6 | 4 | 5 | 92 | 65 | 16 | 21 | 6 | 215 | ||
| Parties that won no seats: | |||||||||||
| Unknown | Vote (%): | 2.0 | 3.8 | 3.1 | 2.2 | ||||||
| Equal Rights | Vote (%): | 0.7 | 0.3 | ||||||||
| Progressive | Vote (%): | 0.5 | 0.1 | ||||||||
Vote and seat summaries
See also
References
- "Voter Turnout at Federal Elections and Referendums". Elections Canada. Retrieved 10 March 2019.