Physical impacts of climate change
Climate change causes a variety of physical impacts on the climate system. The physical impacts of climate change foremost include globally rising temperatures of the lower atmosphere, the land, and oceans. Temperature rise is not uniform, with land masses and the Arctic region warming faster than the global average. Effects on weather encompass increased heavy precipitation, reduced amounts of cold days, increase in heat waves and various effects on tropical cyclones. The enhanced greenhouse effect causes the higher part of the atmosphere, the stratosphere, to cool. Geochemical cycles are also impacted, with absorption of CO
2 causing ocean acidification, and rising ocean water decreasing the ocean's ability to absorb further carbon dioxide. Annual snow cover has decreased, sea ice is declining and widespread melting of glaciers is underway. Thermal expansion and glacial retreat cause sea levels to increase. Retreat of ice mass may impact various geological processes as well, such as volcanism and earthquakes. Increased temperatures and other human interference with the climate system can lead to tipping points to be crossed such as the collapse of the thermohaline circulation or the Amazon rainforest. Some of these physical impacts also affect social and economic systems.
Global warming
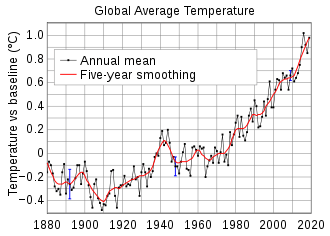
Global surface temperatures in 2016 had increased about 1.0 °C since 1901.[5] The linear trend for the past 50 years of 0.13 °C (plus or minus 0.03 °C) per decade is nearly twice that for the past 100 years. The warming has not been globally uniform. The recent warmth has been greatest over North America and Eurasia between 40 and 70°N.[6] Of the warmest years on record, 16 out of 17 occurred in the 21st century.[5] Winter temperatures are rising faster than summer temperatures and nights warm faster than days.[5]
Effects on weather
Increasing temperature is likely to lead to increasing precipitation[7][8] but the effects on storms are less clear. Extratropical storms partly depend on the temperature gradient, which is predicted to weaken in the northern hemisphere as the polar region warms more than the rest of the hemisphere.[9] It is possible that the Polar and Ferrel cells in one or both hemispheres will weaken and eventually disappear, which would cause the Hadley cell to cover the whole planet.[10] This would greatly decrease the temperature gradient between the arctic and the tropics, and cause the earth to flip to a hothouse state.[10]
Precipitation

Historically (i.e., over the 20th century), subtropical land regions have been mostly semi-arid, while most subpolar regions have had an excess of precipitation over evaporation. Future global warming is expected to be accompanied by a reduction in rainfall in the subtropics and an increase in precipitation in subpolar latitudes and some equatorial regions. In other words, regions which are dry at present will generally become even drier, while regions that are currently wet will generally become even wetter. This projection does not apply to every locale, and in some cases can be modified by local conditions. Drying is projected to be strongest near the poleward margins of the subtropics (for example, South Africa, southern Australia, the Mediterranean, and the south-western U.S.), a pattern that can be described as a poleward expansion of these semi-arid zones.[12]
This large-scale pattern of change is a robust feature present in nearly all of the simulations conducted by the world's climate modeling groups for the 4th Assessment of the Intergovernmental Panel on Climate Change (IPCC), and is also evident in observed 20th century precipitation trends.[12]
Changes in regional climate are expected to include greater warming over land, with most warming at high northern latitudes, and least warming over the Southern Ocean and parts of the North Atlantic Ocean.[13]
Future changes in precipitation are expected to follow existing trends, with reduced precipitation over subtropical land areas, and increased precipitation at subpolar latitudes and some equatorial regions.[14]
A 2015 study published in Nature Climate Change, states:
About 18% of the moderate daily precipitation extremes over land are attributable to the observed temperature increase since pre-industrial times, which in turn primarily results from human influence. For 2 °C of warming the fraction of precipitation extremes attributable to human influence rises to about 40%. Likewise, today about 75% of the moderate daily hot extremes over land are attributable to warming. It is the most rare and extreme events for which the largest fraction is anthropogenic, and that contribution increases nonlinearly with further warming.[15][16]
Extreme events
Fire
Fire is a major agent for conversion of biomass and soil organic matter to CO2 (Denman et al., 2007:527).[17] There is a large potential for future alteration in the terrestrial carbon balance through altered fire regimes. With high confidence, Schneider et al. (2007:789) projected that:[18]
- An increase in global mean temperature of about 0 to 2 °C by 2100 relative to the 1990–2000 period would result in increased fire frequency and intensity in many areas.
- An increase in the region of 2 °C or above would lead to increased frequency and intensity of fires.
Sensitivity to fires in areas that were already vulnerable has been steadily increasing. In high altitude temperate areas, increased temperature is causing snow pack to melt sooner and in greater quantities. The number of days that of higher stream flow caused by snowmelt in the Mississippi, Missouri, and Ohio rivers has been increasing in recent years.[19] The substantial amount of snow that remains atop mountains year around is also disappearing. This leads to the surrounding densely forested areas becoming more dry and staying dry for longer periods of time. In the 1970s, the length of a fire season, which is the period of the year fires are most likely to occur, was about five months. Today, the period is usually seven months, extending into the springtime mud season.[20] In addition, many areas are experiencing higher than normal droughts. Between 2011 and 2014, California experienced the driest period in its recorded history[21] and more than 100 million trees died in the drought, creating areas of dead, dry wood.[22] The decrease in rainfall is also going to increase the risk of wildfire by allowing the fire access to drier fuels. Dry foliage is more susceptible to a wildfire trigger. Wildfire specialists use foliar moisture content to determine how susceptible an area is to a wildfire.[23] In the United States, 2015 was the most destructive year on record for wildfires, with a total of 10,125,149 total acres destroyed by fires. 2017 was the second worst year on record with 10,026,086 acres destroyed.[24] The Thomas Fire occurred in 2017 and was the largest fire in California's history.[25]
The increasing frequency of wildfires as a result of climate change will also lead to an increase in the amount of CO2 in the atmosphere. This will, in turn, increase the temperature and the frequency of hot days, which will further increase fire danger. It was forecasted that double levels of CO2, would bring a greater risk of wildfires to Australia, especially the Australian outback. All of the eight sites tested projected an increase in fire danger as a result of CO2 level increase and all but one projected a longer fire season. The largest population center said to be affected is Alice Springs, a city deep in the Outback.[26]
Extreme weather

IPCC (2007a:8) projected that in the future, over most land areas, the frequency of warm spells or heat waves would very likely increase.[28] Other likely changes are listed below:
Tropical cyclones
Storm strength leading to extreme weather is increasing, such as the power dissipation index of hurricane intensity.[30] Kerry Emanuel writes that hurricane power dissipation is highly correlated with temperature, reflecting global warming.[31] However, a further study by Emanuel using current model output concluded that the increase in power dissipation in recent decades cannot be completely attributed to global warming.[32] Hurricane modeling has produced similar results, finding that hurricanes, simulated under warmer, high-CO2 conditions, are more intense, however, hurricane frequency will be reduced.[33] Worldwide, the proportion of hurricanes reaching categories 4 or 5 – with wind speeds above 56 metres per second – has risen from 20% in the 1970s to 35% in the 1990s.[34] Precipitation hitting the US from hurricanes has increased by 7% over the 20th century.[35][36][37] The extent to which this is due to global warming as opposed to the Atlantic Multidecadal Oscillation is unclear. Some studies have found that the increase in sea surface temperature may be offset by an increase in wind shear, leading to little or no change in hurricane activity.[38] Hoyos et al. (2006) have linked the increasing trend in number of category 4 and 5 hurricanes for the period 1970–2004 directly to the trend in sea surface temperatures.[39]
An international team of scientists stated in 2016 that highly destructive category four and five storms have increased in most ocean basins, among which the North Atlantic.[40][41] In 2008, Knutson et al. found that Atlantic hurricane and tropical storm frequencies could reduce under future greenhouse-gas-induced warming.[42] Vecchi and Soden find that wind shear, the increase of which acts to inhibit tropical cyclones, also changes in model-projections of global warming. There are projected increases of wind shear in the tropical Atlantic and East Pacific associated with the deceleration of the Walker circulation, as well as decreases of wind shear in the western and central Pacific.[43] The study does not make claims about the net effect on Atlantic and East Pacific hurricanes of the warming and moistening atmospheres, and the model-projected increases in Atlantic wind shear.[44]
The World Meteorological Organization explains that "though there is evidence both for and against the existence of a detectable anthropogenic signal in the tropical cyclone climate record to date, no firm conclusion can be made on this point."[45] They also clarified that "no individual tropical cyclone can be directly attributed to climate change."[45]
Extreme weather and drought
A substantially higher risk of extreme weather does not necessarily mean a noticeably greater risk of slightly-above-average weather.[46] However, the evidence is clear that severe weather and moderate rainfall are also increasing. Increases in temperature are expected to produce more intense convection over land and a higher frequency of the most severe storms.[47]
Using the Palmer Drought Severity Index, a 2010 study by the National Center for Atmospheric Research projects increasingly dry conditions across much of the globe in the next 30 years, possibly reaching a scale in some regions by the end of the century that has rarely, if ever, been observed in modern times.[48]
Coumou et al. (2013)[49] estimated that global warming had increased the probability of local record-breaking monthly temperatures worldwide by a factor of 5. This was compared to a baseline climate in which no global warming had occurred. Using a medium global warming scenario, they project that by 2040, the number of monthly heat records globally could be more than 12 times greater than that of a scenario with no long-term warming.
Increased evaporation

Over the course of the 20th century, evaporation rates have reduced worldwide;[50] this is thought by many to be explained by global dimming. As the climate grows warmer and the causes of global dimming are reduced, evaporation will increase due to warmer oceans. Because the world is a closed system this will cause heavier rainfall, with more erosion. This erosion, in turn, can in vulnerable tropical areas (especially in Africa) lead to desertification. On the other hand, in other areas, increased rainfall lead to growth of forests in dry desert areas.
Scientists have found evidence that increased evaporation could result in more extreme weather as global warming progresses. The IPCC Third Annual Report says: "...global average water vapor concentration and precipitation are projected to increase during the 21st century. By the second half of the 21st century, it is likely that precipitation will have increased over northern mid- to high latitudes and Antarctica in winter. At low latitudes there are both regional increases and decreases over land areas. Larger year-to-year variations in precipitation are very likely over most areas where an increase in mean precipitation is projected."[7][51]
Increased freshwater flow
Research based on satellite observations, published in October 2010, shows an increase in the flow of freshwater into the world's oceans, partly from melting ice and partly from increased precipitation driven by an increase in global ocean evaporation. The increase in global freshwater flow, based on data from 1994 to 2006, was about 18%. Much of the increase is in areas which already experience high rainfall. One effect, as perhaps experienced in the 2010 Pakistan floods, is to overwhelm flood control infrastructure.[52]
Regional climate change
General effects
In a literature assessment, Hegerl et al. (2007) assessed evidence for attributing observed climate change. They concluded that since the middle of the 20th century, it was likely that human influences had significantly contributed to surface temperature increases in every continent except Antarctica.[53] The magazine Scientific American reported on December 23, 2008, that the 10 places most affected by climate change were Darfur, the Gulf Coast, Italy, northern Europe, the Great Barrier Reef, island nations, Washington, D.C., the Northwest Passage, the Alps, and Uganda.
Northern hemisphere
In the northern hemisphere, the southern part of the Arctic region (home to 4,000,000 people) has experienced a temperature rise of 1 °C to 3 °C (1.8 °F to 5.4 °F) over the last 50 years.[54] Canada, Alaska and Russia are experiencing initial melting of permafrost. This may disrupt ecosystems and by increasing bacterial activity in the soil lead to these areas becoming carbon sources instead of carbon sinks.[55] A study (published in Science) of changes to eastern Siberia's permafrost suggests that it is gradually disappearing in the southern regions, leading to the loss of nearly 11% of Siberia's nearly 11,000 lakes since 1971.[56] At the same time, western Siberia is at the initial stage where melting permafrost is creating new lakes, which will eventually start disappearing as in the east. Furthermore, permafrost melting will eventually cause methane release from melting permafrost peat bogs.
Polar regions
Anisimov et al. (2007) assessed the literature on impacts of climate change in Polar regions.[57] Model projections showed that Arctic terrestrial ecosystems and the active layer (the top layer of soil or rock in permafrost that is subjected to seasonal freezing and thawing) would be a small sink for carbon (i.e., net uptake of carbon) over this century (p. 662). These projections were viewed as being uncertain. It was judged that increased emissions of carbon from thawing of permafrost could occur. This would lead to an amplification of warming.
Atmosphere
.gif)
The lower and middle atmosphere are heating due to the enhanced greenhouse effect. Increased greenhouse gases cause the higher parts of the atmosphere, the stratosphere to cool. This has been observed by a set of satellites since 1979 (the Microwave sounding unit) and radiosonde data. Satellites can not measure each height of the atmosphere separately, but instead measure a set of bands that slightly overlap. The overlap between the cooling stratosphere in the measurements of tropospheric warming may cause the latter to be underestimated slightly.[58] The heated atmosphere contains more water vapour, which is itselfs also a greenhouse gas and acts as an self-reinforcing feedback.[59]
A contraction of the thermosphere has been observed as a possible result in part due to increased carbon dioxide concentrations, the strongest cooling and contraction occurring in that layer during solar minimum. The most recent contraction in 2008–2009 was the largest such since at least 1967.[60][61][62]
Geophysical systems
Biogeochemical cycles
Climate change can have an effect on the carbon cycle in an interactive "feedback" process . A feedback exists where an initial process triggers changes in a second process that in turn influences the initial process. A positive feedback intensifies the original process, and a negative feedback reduces it (IPCC, 2007d:78).[63] Models suggest that the interaction of the climate system and the carbon cycle is one where the feedback effect is positive (Schneider et al., 2007:792).[18]
Using the A2 SRES emissions scenario, Schneider et al. (2007:789) found that this effect led to additional warming by 2100, relative to the 1990–2000 period, of 0.1 to 1.5 °C. This estimate was made with high confidence. The climate projections made in the IPCC Fourth Assessment Report of 1.1 to 6.4 °C account for this feedback effect. On the other hand, with medium confidence, Schneider et al. (2007) commented that additional releases of GHGs were possible from permafrost, peat lands, wetlands, and large stores of marine hydrates at high latitudes.
Gas hydrates
Gas hydrates are ice-like deposits containing a mixture of water and gas, the most common gas of which is methane (Maslin, 2004:1).[64] Gas hydrates are stable under high pressures and at relatively low temperatures and are found underneath the oceans and permafrost regions. Future warming at intermediate depths in the world's oceans, as predicted by climate models, will tend to destabilize gas hydrates resulting in the release of large quantities of methane. On the other hand, projected rapid sea level rise in the coming centuries associated with global warming will tend to stabilize marine gas hydrate deposits.
Carbon cycle
Models have been used to assess the effect that climate change will have on the carbon cycle (Meehl et al., 2007:789-790).[65] In the Coupled Climate-Carbon Cycle Model Intercomparison Project, eleven climate models were used. Observed emissions were used in the models and future emission projections were based on the IPCC SRES A2 emissions scenario.
Unanimous agreement was found among the models that future climate change will reduce the efficiency of the land and ocean carbon cycle to absorb human-induced CO2. As a result, a larger fraction of human-induced CO2 will stay airborne if climate change controls the carbon cycle. By the end of the 21st century, this additional CO2 in the atmosphere varied between 20 and 220 ppm for the two extreme models, with most models lying between 50 and 100 ppm. This additional CO2 led to a projected increase in warming of between 0.1 and 1.5 °C.
Cryosphere
Northern Hemisphere average annual snow cover has declined in recent decades. This pattern is consistent with warmer global temperatures. Some of the largest declines have been observed in the spring and summer months.[66]
Sea ice
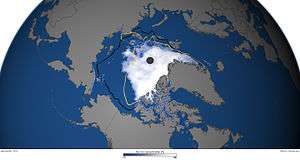
As the climate warms, snow cover and sea ice extent decrease. Large-scale measurements of sea-ice have only been possible since the satellite era, but through looking at a number of different satellite estimates, it has been determined that September Arctic sea ice has decreased between 1973 and 2007 at a rate of about -10% +/- 0.3% per decade. Sea ice extent for September for 2012 was by far the lowest on record at 3.29 million square kilometers, eclipsing the previous record low sea ice extent of 2007 by 18%. The age of the sea ice is also an important feature of the state of the sea ice cover, and for the month of March 2012, older ice (4 years and older) has decreased from 26% of the ice cover in 1988 to 7% in 2012.[67] Sea ice in the Antarctic has shown very little trend over the same period, or even a slight increase since 1979. Though extending the Antarctic sea-ice record back in time is more difficult due to the lack of direct observations in this part of the world.[6]
In a literature assessment, Meehl et al. (2007:750) found that model projections for the 21st century showed a reduction of sea ice in both the Arctic and Antarctic.[65] The range of model responses was large. Projected reductions were accelerated in the Arctic. Using the high-emission A2 SRES scenario, some models projected that summer sea ice cover in the Arctic would disappear entirely by the latter part of the 21st century.
Glacier retreat and disappearance
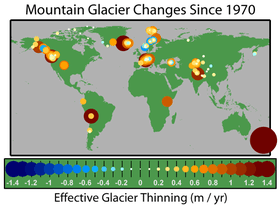
Warming temperatures lead to the melting of glaciers and ice sheets.[68] IPCC (2007a:5) found that, on average, mountain glaciers and snow cover had decreased in both the northern and southern hemispheres.[28] This widespread decrease in glaciers and ice caps has contributed to observed sea level rise.
As stated above, the total volume of glaciers on Earth is declining sharply. Glaciers have been retreating worldwide for at least the last century; the rate of retreat has increased in the past decade. Only a few glaciers are actually advancing (in locations that were well below freezing, and where increased precipitation has outpaced melting). The progressive disappearance of glaciers has implications not only for a rising global sea level, but also for water supplies in certain regions of Asia and South America.[68]
With very high or high confidence, IPCC (2007d:11) made a number of projections related to future changes in glaciers:[63]
- Mountainous areas in Europe will face glacier retreat
- In Latin America, changes in precipitation patterns and the disappearance of glaciers will significantly affect water availability for human consumption, agriculture, and energy production
- In Polar regions, there will be reductions in glacier extent and the thickness of glaciers.
In historic times, glaciers grew during a cool period from about 1550 to 1850 known as the Little Ice Age. Subsequently, until about 1940, glaciers around the world retreated as the climate warmed. Glacier retreat declined and reversed in many cases from 1950 to 1980 as a slight global cooling occurred. Since 1980, glacier retreat has become increasingly rapid and ubiquitous, and has threatened the existence of many of the glaciers of the world. This process has increased markedly since 1995.[69] Excluding the ice caps and ice sheets of the Arctic and Antarctic, the total surface area of glaciers worldwide has decreased by 50% since the end of the 19th century.[70] Currently glacier retreat rates and mass balance losses have been increasing in the Andes, Alps, Pyrenees, Himalayas, Rocky Mountains and North Cascades.
The loss of glaciers not only directly causes landslides, flash floods and glacial lake overflow,[71] but also increases annual variation in water flows in rivers. Glacier runoff declines in the summer as glaciers decrease in size, this decline is already observable in several regions.[72] Glaciers retain water on mountains in high precipitation years, since the snow cover accumulating on glaciers protects the ice from melting. In warmer and drier years, glaciers offset the lower precipitation amounts with a higher meltwater input.[70] Some world regions, such as the French Alps, already show signs of an increase in landslide frequency.[73]
Of particular importance are the Hindu Kush and Himalayan glacial melts that comprise the principal dry-season water source of many of the major rivers of the Central, South, East and Southeast Asian mainland. Increased melting would cause greater flow for several decades, after which "some areas of the most populated regions on Earth are likely to 'run out of water'" as source glaciers are depleted.[74] The Tibetan Plateau contains the world's third-largest store of ice. Temperatures there are rising four times faster than in the rest of China, and glacial retreat is at a high speed compared to elsewhere in the world.[75]
According to a Reuters report, the Himalayan glaciers that are the sources of Asia's biggest rivers—Ganges, Indus, Brahmaputra, Yangtze, Mekong, Salween and Yellow—could diminish as temperatures rise.[76] Approximately 2.4 billion people live in the drainage basin of the Himalayan rivers.[77] India, China, Pakistan, Bangladesh, Nepal and Myanmar could experience floods followed by droughts in coming decades. The Indus, Ganges and Brahmaputra river basins support 700 million people in Asia.[78] In India alone, the Ganges provides water for drinking and farming for more than 500 million people.[79][80][81] It has to be acknowledged, however, that increased seasonal runoff of Himalayan glaciers led to increased agricultural production in northern India throughout the 20th century.[82] Research studies suggest that climate change will have a marked effect on meltwater in the Indus Basin.[83]
The recession of mountain glaciers, notably in Western North America, Franz-Josef Land, Asia, the Alps, the Pyrenees, Indonesia and Africa, and tropical and sub-tropical regions of South America, has been used to provide qualitative support to the rise in global temperatures since the late 19th century. Many glaciers are being lost to melting further raising concerns about future local water resources in these glaciated areas. In Western North America the 47 North Cascade glaciers observed all are retreating.[84]
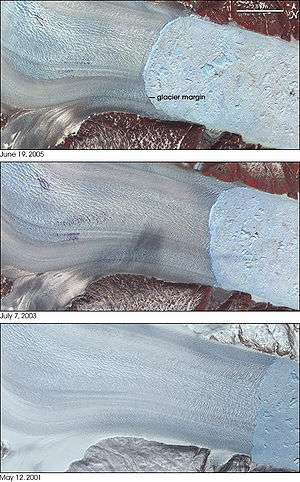
Despite their proximity and importance to human populations, the mountain and valley glaciers of temperate latitudes amount to a small fraction of glacial ice on the earth. About 99% is in the great ice sheets of polar and subpolar Antarctica and Greenland. These continuous continental-scale ice sheets, 3 kilometres (1.9 mi) or more in thickness, cap the polar and subpolar land masses. Like rivers flowing from an enormous lake, numerous outlet glaciers transport ice from the margins of the ice sheet to the ocean. Glacier retreat has been observed in these outlet glaciers, resulting in an increase of the ice flow rate. In Greenland the period since the year 2000 has brought retreat to several very large glaciers that had long been stable. Three glaciers that have been researched, Helheim, Jakobshavn Isbræ and Kangerdlugssuaq Glaciers, jointly drain more than 16% of the Greenland Ice Sheet. Satellite images and aerial photographs from the 1950s and 1970s show that the front of the glacier had remained in the same place for decades. But in 2001 it began retreating rapidly, retreating 7.2 km (4.5 mi) between 2001 and 2005. It has also accelerated from 20 m (66 ft)/day to 32 m (105 ft)/day.[85] Jakobshavn Isbræ in western Greenland had been moving at speeds of over 24 m (79 ft)/day with a stable terminus since at least 1950. The glacier's ice tongue began to break apart in 2000, leading to almost complete disintegration in 2003, while the retreat rate increased to over 30 m (98 ft)/day.[86]
Oceans
The role of the oceans in global warming is a complex one. The oceans serve as a sink for carbon dioxide, taking up much that would otherwise remain in the atmosphere, but increased levels of CO2 have led to ocean acidification. Furthermore, as the temperature of the oceans increases, they become less able to absorb excess CO2. Global warming is projected to have a number of effects on the oceans. Ongoing effects include rising sea levels due to thermal expansion and melting of glaciers and ice sheets, and warming of the ocean surface, leading to increased temperature stratification. Other possible effects include large-scale changes in ocean circulation.
Sea level rise

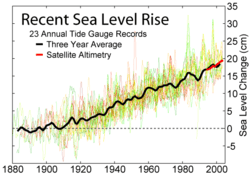
IPCC (2007a:5) reported that since 1961, global average sea level had risen at an average rate of 1.8 [1.3 to 2.3] mm/yr.[28] Between 1993 and 2003, the rate increased above the previous period to 3.1 [2.4 to 3.8] mm/yr. IPCC (2007a) were uncertain whether the increase in rate from 1993 to 2003 was due to natural variations in sea level over the time period, or whether it reflected an increase in the underlying long-term trend.
IPCC (2007a:13, 14) projected sea level rise to the end of the 21st century using the SRES emission scenarios. Across the six SRES marker scenarios, sea level was projected to rise by 18 to 59 cm (7.1 to 23.2 inches). This projection was for the time period 2090–2099, with the increase in level relative to average sea levels over the 1980–1999 period. Due to a lack of scientific understanding, this sea level rise estimate does not include all of the possible contributions of ice sheets.
With increasing average global temperature, the water in the oceans expands in volume, and additional water enters them which had previously been locked up on land in glaciers and ice sheets. The Greenland and the Antarctic ice sheets are major ice masses, and at least the former of which may suffer irreversible decline.[87] For most glaciers worldwide, an average volume loss of 60% until 2050 is predicted.[88] Meanwhile, the estimated total ice melting rate over Greenland is 239 ± 23 cubic kilometres (57.3 ± 5.5 cu mi) per year, mostly from East Greenland.[89] The Antarctic ice sheet, however, is expected to grow during the 21st century because of increased precipitation.[90] Under the IPCC Special Report on Emission Scenario (SRES) A1B, by the mid-2090s global sea level will reach 0.22 to 0.44 m (8.7 to 17.3 in) above 1990 levels, and is currently rising at about 4 mm (0.16 in) per year.[90] Since 1900, the sea level has risen at an average of 1.7 mm (0.067 in) per year;[90] since 1993, satellite altimetry from TOPEX/Poseidon indicates a rate of about 3 mm (0.12 in) per year.[90]
The sea level has risen more than 120 metres (390 ft) since the Last Glacial Maximum about 20,000 years ago. The bulk of that occurred before 7000 years ago.[91] Global temperature declined after the Holocene Climatic Optimum, causing a sea level lowering of 0.7 ± 0.1 m (27.6 ± 3.9 in) between 4000 and 2500 years before present.[92] From 3000 years ago to the start of the 19th century, sea level was almost constant, with only minor fluctuations. However, the Medieval Warm Period may have caused some sea level rise; evidence has been found in the Pacific Ocean for a rise to perhaps 0.9 m (2 ft 11 in) above present level in 700 BP.[93]
In a paper published in 2007, the climatologist James E. Hansen et al. claimed that ice at the poles does not melt in a gradual and linear fashion, but that another according to the geological record, the ice sheets can suddenly destabilize when a certain threshold is exceeded. In this paper Hansen et al. state:
Our concern that BAU GHG scenarios would cause large sealevel rise this century (Hansen 2005) differs from estimates of IPCC (2001, 2007), which foresees little or no contribution to twentyfirst century sealevel rise from Greenland and Antarctica. However, the IPCC analyses and projections do not well account for the nonlinear physics of wet ice sheet disintegration, ice streams and eroding ice shelves, nor are they consistent with the palaeoclimate evidence we have presented for the absence of discernible lag between ice sheet forcing and sealevel rise.[94]
Sea level rise due to the collapse of an ice sheet would be distributed nonuniformly across the globe. The loss of mass in the region around the ice sheet would decrease the gravitational potential there, reducing the amount of local sea level rise or even causing local sea level fall. The loss of the localized mass would also change the moment of inertia of the Earth, as flow in the Earth's mantle will require 10–15 thousand years to make up the mass deficit. This change in the moment of inertia results in true polar wander, in which the Earth's rotational axis remains fixed with respect to the sun, but the rigid sphere of the Earth rotates with respect to it. This changes the location of the equatorial bulge of the Earth and further affects the geoid, or global potential field. A 2009 study of the effects of collapse of the West Antarctic Ice Sheet shows the result of both of these effects. Instead of a global 5-meter sea level rise, western Antarctica would experience approximately 25 centimeters of sea level fall, while the United States, parts of Canada, and the Indian Ocean, would experience up to 6.5 meters of sea level rise.[95]
A paper published in 2008 by a group of researchers at the University of Wisconsin led by Anders Carlson used the deglaciation of North America at 9000 years before present as an analogue to predict sea level rise of 1.3 meters in the next century,[96][97] which is also much higher than the IPCC projections. However, models of glacial flow in the smaller present-day ice sheets show that a probable maximum value for sea level rise in the next century is 80 centimeters, based on limitations on how quickly ice can flow below the equilibrium line altitude and to the sea.[98]
Temperature rise and ocean heat content
_and_annual_average_(black_line)_of_global_upper_ocean_heat_content_for_the_0-700m_layer_between_1955-2008.gif)
From 1961 to 2003, the global ocean temperature has risen by 0.10 °C from the surface to a depth of 700 m.[90] For example, the temperature of the Antarctic Southern Ocean rose by 0.17 °C (0.31 °F) between the 1950s and the 1980s, nearly twice the rate for the world's oceans as a whole.[100] There is variability both year-to-year and over longer time scales, with global ocean heat content observations showing high rates of warming for 1991 to 2003, but some cooling from 2003 to 2007.[90] Nevertheless, there is a strong trend during the period of reliable measurements.[99] Increasing heat content in the ocean is also consistent with sea level rise, which is occurring mostly as a result of thermal expansion of the ocean water as it warms.[99]
While the full implications of elevated CO2 on marine ecosystems are still being documented, there is a substantial body of research showing that a combination of ocean acidification and elevated ocean temperature, driven mainly by CO2 and other greenhouse gas emissions, have a compounded effect on marine life and the ocean environment. This effect far exceeds the individual harmful impact of either.[101][102][103] In addition, ocean warming exacerbates ocean deoxygenation, which is an additional stressor on marine organisms, by increasing ocean stratification, through density and solubility effects, thus limiting nutrients,[104][105]
Acidification
Ocean acidification is an effect of rising concentrations of CO2 in the atmosphere, and is not a direct consequence of global warming. The oceans soak up much of the CO2 produced by living organisms, either as dissolved gas, or in the skeletons of tiny marine creatures that fall to the bottom to become chalk or limestone. Oceans currently absorb about one tonne of CO2 per person per year. It is estimated that the oceans have absorbed around half of all CO2 generated by human activities since 1800 (118 ± 19 petagrams of carbon from 1800 to 1994).[106]
In water, CO2 becomes a weak carbonic acid, and the increase in the greenhouse gas since the Industrial Revolution has already lowered the average pH (the laboratory measure of acidity) of seawater by 0.1 units, to 8.2. Predicted emissions could lower the pH by a further 0.5 by 2100, to a level probably not seen for hundreds of millennia and, critically, at a rate of change probably 100 times greater than at any time over this period.[107][108]
There are concerns that increasing acidification could have a particularly detrimental effect on corals[109] (16% of the world's coral reefs have died from bleaching caused by warm water in 1998,[110] which coincidentally was, at the time, the warmest year ever recorded) and other marine organisms with calcium carbonate shells.[111]
In November 2009 an article in Science by scientists at Canada's Department of Fisheries and Oceans reported they had found very low levels of the building blocks for the calcium chloride that forms plankton shells in the Beaufort Sea.[112] Fiona McLaughlin, one of the DFO authors, asserted that the increasing acidification of the Arctic Ocean was close to the point it would start dissolving the walls of existing plankton: "[the] Arctic ecosystem may be risk. In actual fact, they'll dissolve the shells." Because cold water absorbs CO2 more readily than warmer water the acidification is more severe in the polar regions. McLaughlin predicted the acidified water would travel to the North Atlantic within the next ten years.
Shutdown of thermohaline circulation
There is some speculation that global warming could, via a shutdown or slowdown of the thermohaline circulation, trigger localized cooling in the North Atlantic and lead to cooling, or lesser warming, in that region.[113] This would affect in particular areas like Scandinavia and Britain that are warmed by the North Atlantic drift.
The chances of this near-term collapse of the circulation, which was fictionally portrayed in the 2004 film Day After Tomorrow, are unclear. Lenton et al. found that "simulations clearly pass a THC tipping point this century".[113]
IPCC (2007b:17) concluded that a slowing of the Meridional Overturning Circulation would very likely occur this century.[114] Due to global warming, temperatures across the Atlantic and Europe were still projected to increase.
Oxygen depletion
The amount of oxygen dissolved in the oceans may decline, with adverse consequences for ocean life.[115][116]
Sulfur aerosols
Sulfur aerosols, especially stratospheric sulfur aerosols have a significant effect on climate. One source of such aerosols is the sulfur cycle, where plankton release gases such as DMS which eventually becomes oxidised to sulfur dioxide in the atmosphere. Disruption to the oceans as a result of ocean acidification or disruptions to the thermohaline circulation may result in disruption of the sulfur cycle, thus reducing its cooling effect on the planet through the creation of stratospheric sulfur aerosols.
Geology
Volcanoes
The retreat of glaciers and ice caps can cause increased volcanism. Reduction in ice cover reduces the confining pressure exerted on the volcano, increasing deviatoric stresses and potentially causing the volcano to erupt. This reduction of pressure can also cause decompression melting of material in the mantle, resulting in the generation of more magma.[117] Researchers in Iceland have shown that the rate of volcanic rock production there following deglaciation (10,000 to 4500 years before present) was 20–30 times greater than that observed after 2900 years before present.[118] While the original study addresses the first reason for increased volcanism (reduced confining pressure), scientists have more recently shown that these lavas have unusually high trace element concentrations, indicative of increased melting in the mantle.[119] This work in Iceland has been corroborated by a study in California, in which scientists found a strong correlation between volcanism and periods of global deglaciation.[120] The effects of current sea level rise could include increased crustal stress at the base of coastal volcanoes from a rise in the volcano's water table (and the associated saltwater intrusion), while the mass from extra water could activate dormant seismic faults around volcanoes. In addition, the wide-scale displacement of water from melting in places such as West Antarctica is likely to slightly alter the Earth's rotational period and may shift its axial tilt on the scale of hundreds of metres, inducing further crustal stress changes.[121][122]
Current melting of ice is predicted to increase the size and frequency of volcanic eruptions.[123] In particular, lateral collapse events at stratovolcanoes are likely to increase,[123][124] and there are potential positive feedbacks between the removal of ice and magmatism.[123]
Earthquakes
A numerical modeling study has demonstrated that seismicity increases during unloading, such as that due to the removal of ice.[125]
Notes
- "The Causes of Climate Change". climate.nasa.gov. NASA. Archived from the original on December 21, 2019.
- "Climate Science Special Report / Fourth National Climate Assessment (NCA4), Volume I". science2017.globalchange.gov. U.S. Global Change Research Program. Archived from the original on December 14, 2019.
- "Summary for Policymakers" (PDF). ipcc.ch. Intergovernmental Panel on Climate Change. 2019. Archived (PDF) from the original on January 1, 2020.
- "The Study of Earth as an Integrated System". nasa.gov. NASA. 2016. Archived from the original on November 2, 2016.
- USGCRP. "Climate Science Special Report. Chapter 1. Our Globally Changing Climate". science2017.globalchange.gov. Retrieved 2019-11-19.
- Quote from public-domain source: "NOAA: NESDIS: NCDC: Frequently Asked Questions: Is the climate warming?". NOAA. 10 March 2010.CS1 maint: ref=harv (link)
- Houghton, J.T., Y. Ding, D.J. Griggs, M. Noguer, P.J. van der Linden, X. Dai, K.Maskell, and C.A. Johnson (2001). "Climate Change 2001: The Scientific Basis. Contribution of Working Group I to the Third Assessment Report of the Intergovernmental Panel on Climate Change. Human influences will continue to change atmospheric composition throughout the 21st century". Intergovernmental Panel on Climate Change. Archived from the original on 2007-12-31. Retrieved 2007-12-03.CS1 maint: multiple names: authors list (link)
- U. Cubasch; G.A. Meehl; et al. (2001). Houghton, J.T.; Y. Ding; D.J. Griggs; M. Noguer; P.J. van der Linden; X. Dai; K.Maskell; C.A. Johnson (eds.). "Climate Change 2001: The Scientific Basis. Contribution of Working Group I to the Third Assessment Report of the Intergovernmental Panel on Climate Change. Precipitation and Convection". Intergovernmental Panel on Climate Change. Archived from the original on 2007-11-22. Retrieved 2007-12-03.
- U. Cubasch; G.A. Meehl; et al. (2001). Houghton, J.T.; Y. Ding; D.J. Griggs; M. Noguer; P.J. van der Linden; X. Dai; K.Maskell; C.A. Johnson (eds.). "Climate Change 2001: The Scientific Basis. Contribution of Working Group I to the Third Assessment Report of the Intergovernmental Panel on Climate Change. Extra-tropical storms". Intergovernmental Panel on Climate Change. Archived from the original on 2007-11-23. Retrieved 2007-12-03.
- Langford, Bill & Lewis, Greg. "Hadley Cell Expansion in Today's Climate and Paleoclimates" (PDF). Retrieved 19 October 2014.
- Geophysical Fluid Dynamics Laboratory (GFDL) - Will the Wet Get Wetter and the Dry Drier, NOAA GFDLCS1 maint: ref=harv (link)
-

- IPCC, Synthesis Report Summary for Policymakers, Section 3: Projected climate change and its impacts, in IPCC AR4 SYR 2007.
- NOAA (February 2007). "Will the wet get wetter and the dry drier?" (PDF). GFDL Climate Modeling Research Highlights. 1 (5): 1. Archived from the original (PDF) on 26 February 2013.CS1 maint: ref=harv (link)
- Justin Gillis (27 April 2015). "New Study Links Weather Extremes to Global Warming". The New York Times. Retrieved 27 April 2015.
“The bottom line is that things are not that complicated,” Dr. Knutti said. “You make the world a degree or two warmer, and there will be more hot days. There will be more moisture in the atmosphere, so that must come down somewhere.”
- E. M. Fischer; R. Knutti (27 April 2015). "Anthropogenic contribution to global occurrence of heavy-precipitation and high-temperature extremes". Nature Climate Change. 5 (6): 560–64. Bibcode:2015NatCC...5..560F. doi:10.1038/nclimate2617.
We show that at the present-day warming of 0.85 °C about 18% of the moderate daily precipitation extremes over land are attributable to the observed temperature increase since pre-industrial times, which in turn primarily results from human influence. … Likewise, today about 75% of the moderate daily hot extremes over land are attributable to warming.
- Denman, K.L.; et al. (2007). "Couplings Between Changes in the Climate System and Biogeochemistry. In: Climate Change 2007: The Physical Science Basis. Contribution of Working Group I to the Fourth Assessment Report of the Intergovernmental Panel on Climate Change [Solomon, S. et al. (eds.)]". Cambridge University Press, Cambridge, U.K., and New York, N.Y., U.S.A. Retrieved 2010-01-10.
- Schneider, S.H.; et al. (2007). "Assessing key vulnerabilities and the risk from climate change. In: Climate Change 2007: Impacts, Adaptation and Vulnerability. Contribution of Working Group II to the Fourth Assessment Report of the Intergovernmental Panel on Climate Change [M.L. Parry et al. Eds.]". Cambridge University Press, Cambridge, U.K., and New York, N.Y., U.S.A. pp. 779–810. Retrieved 2009-05-20.
- "High Streamflow is Increasing, Raising Flood Risks". www.climatecentral.org. Retrieved 2018-03-06.
- "Wildfire Season Is Scorching the West". www.climatecentral.org. Retrieved 2018-03-06.
- "California's Latest Drought - Public Policy Institute of California". Public Policy Institute of California. Retrieved 2018-03-06.
- "New Aerial Survey Identifies More Than 100 Million Dead Trees in California | US Forest Service". www.fs.fed.us. Retrieved 2018-03-06.
- Wooten, George. "Fire and fuels management: Definitions, ambiguous terminology and references" (PDF). NPS.
- "National Interagency Fire Center". www.nifc.gov. Retrieved 2018-02-27.
- "Top 20 Largest California Wildfires" (PDF). fire.ca.gov. Retrieved 17 February 2018.
- Williams, Allyson A. J.; Karoly, David J.; Tapper, Nigel (2001-04-01). "The Sensitivity of Australian Fire Danger to Climate Change". Climatic Change. 49 (1–2): 171–191. doi:10.1023/A:1010706116176. ISSN 0165-0009.
- Hansen, J.; et al. (July 2012). "The New Climate Dice: Public Perception of Climate Change" (PDF). New York, USA: Dr James E. Hansen, Columbia University. pp. 3–4.CS1 maint: ref=harv (link)
- IPCC (2007a). "Summary for Policymakers. In: Climate Change 2007: The Physical Science Basis. Contribution of Working Group I to the Fourth Assessment Report of the Intergovernmental Panel on Climate Change [Solomon, S. et al. (eds.)]". Cambridge University Press, Cambridge, U.K., and New York, N.Y., U.S.A. Retrieved 2009-05-20.
- Solomon; et al. Technical Summary. Table TS.4.CS1 maint: ref=harv (link), in IPCC AR4 WG1 2007, p. 52.
- Stefan Rahmstorf; Michael Mann; Rasmus Benestad; Gavin Schmidt & William Connolley. "Hurricanes and Global Warming - Is There a Connection?". Real Climate. Retrieved 2007-12-03.
- Emanuel, Kerry (2005). "Increasing destructiveness of tropical cyclones over the past 30 years" (PDF). Nature. 436 (7051): 686–8. Bibcode:2005Natur.436..686E. doi:10.1038/nature03906. PMID 16056221.CS1 maint: ref=harv (link)
- Emanuel, Kerry; Sundararajan, Ragoth; Williams, John (2008). "Hurricanes and global warming: Results from downscaling IPCC AR4 simulations" (PDF). Bulletin of the American Meteorological Society. 89 (3): 347–367. Bibcode:2008BAMS...89..347E. doi:10.1175/BAMS-89-3-347.CS1 maint: ref=harv (link)
- Knutson, Thomas R.; Sirutis, Joseph J.; Garner, Stephen T.; Vecchi, Gabriel A.; Held, Isaac M. (2008). "Simulated reduction in Atlantic hurricane frequency under twenty-first-century warming conditions". Nature Geoscience. 1 (6): 359–64. Bibcode:2008NatGe...1..359K. doi:10.1038/ngeo202.CS1 maint: ref=harv (link)
- Pearce, Fred (2005-09-15). "Warming world blamed for more strong hurricanes". New Scientist. Retrieved 2007-12-03.
- "Global warming will bring fiercer hurricanes". New Scientist Environment. 2005-06-25. Retrieved 2007-12-03.
- "Area Where Hurricanes Develop is Warmer, Say NOAA Scientists". NOAA News Online. 2006-05-01. Retrieved 2007-12-03.
- Kluger, Jeffrey (2005-09-26). "Global Warming: The Culprit?". Time. Retrieved 2007-12-03.
- Thompson, Andrea (2007-04-17). "Study: Global Warming Could Hinder Hurricanes". LiveScience. Retrieved 2007-12-06.
- Hoyos, Carlos D.; Agudelo, PA; Webster, PJ; Curry, JA (2006). "Deconvolution of the Factors Contributing to the Increase in Global Hurricane Intensity". Science. 312 (5770): 94–7. Bibcode:2006Sci...312...94H. doi:10.1126/science.1123560. PMID 16543416.CS1 maint: ref=harv (link)
- Walsh, Kevin J. E.; McBride, John L.; Klotzbach, Philip J.; Balachandran, Sethurathinam; Camargo, Suzana J.; Holland, Greg; Knutson, Thomas R.; Kossin, James P.; Lee, Tsz-cheung; Sobel, Adam; Sugi, Masato (2016). "Tropical cyclones and climate change". Wiley Interdisciplinary Reviews: Climate Change. 7 (1): 65–89. doi:10.1002/wcc.371. hdl:11343/192963. ISSN 1757-7799.
- Knutson, Thomas R. & Robert E. Tuleya (2004). "Impact of CO2-Induced Warming on Simulated Hurricane Intensity and Precipitation:Sensitivity to the Choice of Climate Model and Convective Parameterization" (PDF). Journal of Climate. 17 (18): 3477–94. Bibcode:2004JCli...17.3477K. doi:10.1175/1520-0442(2004)017<3477:IOCWOS>2.0.CO;2.CS1 maint: ref=harv (link)
- Knutson, Thomas; et al. (2008). "Simulated reduction in Atlantic hurricane frequency under twenty-first-century warming conditions". Nature Geoscience. 1 (6): 359–364. Bibcode:2008NatGe...1..359K. doi:10.1038/ngeo202.CS1 maint: ref=harv (link)
- Brian Soden & Gabriel Vecchi. "IPCC Projections and Hurricanes". Geophysical Fluids Dynamic Laboratory. Retrieved 2007-12-06.
- Vecchi, Gabriel A.; Brian J. Soden (2007-04-18). "Increased tropical Atlantic wind shear in model projections of global warming" (PDF). Geophysical Research Letters. 34 (L08702): 1–5. Bibcode:2007GeoRL..3408702V. doi:10.1029/2006GL028905. Retrieved 2007-04-21.CS1 maint: ref=harv (link)
- "Summary Statement on Tropical Cyclones and Climate Change" (PDF) (Press release). World Meteorological Organization. 2006-12-04. Archived from the original (PDF) on 2009-03-25.
- Myles Allen. "The Spectre of Liability" (PDF). climateprediction.net. Archived from the original (PDF) on 2007-11-28. Retrieved 2007-11-30.
- Del Genio, Tony; et al. (2007). "Will moist convection be stronger in a warmer climate?". Geophysical Research Letters. 34 (16): L16703. Bibcode:2007GeoRL..3416703D. doi:10.1029/2007GL030525.CS1 maint: ref=harv (link)
- "Climate change: Drought may threaten much of globe within decades". NCAR (USA). Retrieved 23 March 2012.
- Coumou, D.; Robinson, A.; Rahmstorf, S. (2013). "Global increase in record-breaking monthly-mean temperatures". Climatic Change. 118 (3–4): 771. Bibcode:2013ClCh..118..771C. doi:10.1007/s10584-012-0668-1.
- Peterson, T. C.; V. S. Golubev; P. Ya. Groisman (October 26, 2002). "Evaporation losing its strength". Nature. 377 (6551): 687–8. Bibcode:1995Natur.377..687P. doi:10.1038/377687b0.CS1 maint: ref=harv (link)
- U. Cubasch; G.A. Meehl; et al. (2001). Houghton, J.T.; Y. Ding; D.J. Griggs; M. Noguer; P.J. van der Linden; X. Dai; K.Maskell; C.A. Johnson (eds.). "Climate Change 2001: The Scientific Basis. Contribution of Working Group I to the Third Assessment Report of the Intergovernmental Panel on Climate Change. Precipitation and Convection". Intergovernmental Panel on Climate Change. Archived from the original on 2007-12-09. Retrieved 2007-12-03.
- "Expect More Floods as Global Water Cycle Speeds Up" blog by Sandra L. Postel, National Geographic Freshwater Fellow, based on Syed, T. H. (2010). "Satellite-based global-ocean mass balance estimates of interannual variability and emerging trends in continental freshwater discharge". Proceedings of the National Academy of Sciences. 107: 17916–17921. doi:10.1073/pnas.1003292107. Proceedings of the National Academy of Sciences, posted on NatGeo NewsWatch October 8, 2010, "There is nearly 20 percent more freshwater flowing into the world's oceans than there was 10 years ago--a sign of climate change and a harbinger of more flooding.", accessed October 9, 2010
- Hegerl, G.C.; et al. (2007). Executive Summary. In (book chapter): Chapter 9: Understanding and Attributing Climate Change. In: Climate Change 2007: The Physical Science Basis. Contribution of Working Group I to the Fourth Assessment Report of the Intergovernmental Panel on Climate Change (Solomon, S. et al. (eds.)). Print version: Cambridge University Press, Cambridge, United Kingdom and New York, NY, USA. This version: IPCC website. ISBN 978-0-521-70596-7. Retrieved 2010-05-20.
- Jonathan Watts (2018-02-27). "Arctic warming: scientists alarmed by 'crazy' temperature rises". The Guardian.
- Vladimir Romanovsky. "How rapidly is permafrost changing and what are the impacts of these changes?". NOAA. Retrieved 2007-12-06.
- Nick Paton Walsh (2005-06-10). "Shrinking lakes of Siberia blamed on global warming". The Guardian.
- Anisimov, O.A.; et al. (2007). "Polar regions (Arctic and Antarctic). In: Climate Change 2007: Impacts, Adaptation and Vulnerability. Contribution of Working Group II to the Fourth Assessment Report of the Intergovernmental Panel on Climate Change [M.L. Parry et al. Eds.]". Cambridge University Press, Cambridge, U.K., and New York, N.Y., U.S.A. pp. 653–685. Retrieved 2009-05-20.
- Hausfather, Zeke (2017-06-21). "Study: Why troposphere warming differs between models and satellite data". Carbon Brief. Retrieved 2019-11-19.
- "Climate change: evidence and causes | Royal Society". royalsociety.org. Retrieved 2019-11-19.
- Science News, NASA (July 15, 2010). "A Puzzling Collapse of Earth's Upper Atmosphere". National Aeronautics and Space Administration - Science News. Retrieved 16 July 2010.
- Ho, Derrick (July 17, 2010). "Scientists baffled by unusual upper atmosphere shrinkage". Cable News Network. Retrieved 18 July 2010.
- Saunders, Arrun; Graham G. Swinerd; Hugh G. Lewis (2009). "Preliminary Results to Support Evidence of Thermospheric Contraction" (PDF). Advanced Maui Optical and Space Surveillance Technologies Conference: 8. Bibcode:2009amos.confE..55S.CS1 maint: ref=harv (link)
- IPCC (2007d). "Climate Change 2007: Synthesis Report. Contribution of Working Groups I, II and III to the Fourth Assessment Report of the Intergovernmental Panel on Climate Change [Core Writing Team et al. (eds.)]". IPCC, Geneva, Switzerland. p. 104. Retrieved 2009-05-20.
- Maslin, M. (2004). "Gas Hydrates: A Hazard for the 21st century" (PDF). Issues in Risk Science. 3: 24. Retrieved 2009-05-20.CS1 maint: ref=harv (link)
- Meehl, G.A.; et al. (2007). "Global Climate Projections. In: Climate Change 2007: The Physical Science Basis. Contribution of Working Group I to the Fourth Assessment Report of the Intergovernmental Panel on Climate Change [Solomon, S. et al. (eds.)]". Cambridge University Press, Cambridge, U.K., and New York, N.Y., U.S.A. Retrieved 2010-01-10.
- Quote from public-domain source: "NOAA: NESDIS: NCDC: Frequently Asked Questions: How do we know the Earth's climate is warming?". NOAA. 10 March 2010. Northern Hemisphere Snow Cover is Retreating.
- "Arctic Report Card 2012". NOAA. Retrieved 8 May 2013.
- Quote from public-domain source: "NOAA: NESDIS: NCDC: Frequently Asked Questions: How do we know the Earth's climate is warming?". NOAA. 10 March 2010. Glacier Volume is Shrinking.
- World Glacier Monitoring Service. "Home page". Archived from the original on December 18, 2005. Retrieved December 20, 2005.
- "Retreat of the glaciers". Munich Re Group. Archived from the original on 2008-01-17. Retrieved 2007-12-12.
- "Glacial Lake Outburst Flood Monitoring and Early Warning System". United Nations Environment Programme. Archived from the original on 2006-07-17. Retrieved 2007-12-12.
- Mauri S. Pelto. "Recent retreat of North Cascade Glaciers and changes in North Cascade Streamflow". North Cascade Glacier Climate Project. Archived from the original on 2006-03-07. Retrieved 2007-12-28.
- Jérôme Lopez Saez; Christophe Corona; Markus Stoffel; Frédéric Berger (2013). "Climate change increases frequency of shallow spring landslides in the French Alps". Geology. 41 (5): 619–22. Bibcode:2013Geo....41..619S. doi:10.1130/G34098.1.
- Barnett, T. P.; Adam, J. C.; Lettenmaier, D. P. (November 17, 2005). "Potential impacts of a warming climate on water availability in snow-dominated regions". Nature. 438 (7066): 303–9. Bibcode:2005Natur.438..303B. doi:10.1038/nature04141. PMID 16292301.CS1 maint: ref=harv (link)
- "Global warming benefits to Tibet: Chinese official". AFP. 2009-08-17. Archived from the original on 2014-02-19. Retrieved 2016-03-22.
- "Vanishing Himalayan Glaciers Threaten a Billion". Reuters. 2007-06-05. Retrieved December 21, 2007.
- "Big melt threatens millions, says UN". People and the Planet. 2007-06-24. Archived from the original on 2007-12-18. Retrieved 2007-12-28.
- Nepal, S. & Shrestha, A. B. (2015). "Impact of climate change on the hydrological regime of the Indus, Ganges and Brahmaputra river basins: a review of the literature". International Journal of Water Resources Development. 31 (2): 201–218. doi:10.1080/07900627.2015.1030494.
- "Ganges, Indus may not survive: climatologists". Rediff India Abroad. 2007-07-25. Retrieved December 21, 2007.
- China Daily (2007-07-24). "Glaciers melting at alarming speed". People's Daily Online. Retrieved December 21, 2007.
- Navin Singh Khadka (2004-11-10). "Himalaya glaciers melt unnoticed". BBC. Retrieved December 21, 2007.
- Rühland, Kathleen; et al. (2006). "Accelerated melting of Himalayan snow and ice triggers pronounced changes in a valley peatland from northern India". Geophysical Research Letters. 33 (15): L15709. Bibcode:2006GeoRL..3315709R. doi:10.1029/2006GL026704.CS1 maint: ref=harv (link)
- Nepal, S. & Shrestha, A. B. (2015). "Impact of climate change on the hydrological regime of the Indus, Ganges and Brahmaputra river basins: a review of the literature". International Journal of Water Resources Development. 31 (2): 201–218. doi:10.1080/07900627.2015.1030494.
- Mauri S. Pelto. "North Cascade Glacier Climate Project". North Cascade Glacier Climate Project. Archived from the original on 2006-03-07. Retrieved 2007-12-28.
- Emily Saarman (2005-11-14). "Rapidly accelerating glaciers may increase how fast the sea level rises". UC Santa Cruz Currents. Retrieved 2007-12-28.
- Krishna Ramanujan (2004-12-01). "Fastest Glacier in Greenland Doubles Speed". NASA. Retrieved 2007-12-28.
- Ridley, J.; Gregory, J. M.; Huybrechts, P.; Lowe, J. (2009). "Thresholds for irreversible decline of the Greenland ice sheet". Climate Dynamics. 35 (6): 1065. Bibcode:2010ClDy...35.1065R. doi:10.1007/s00382-009-0646-0.
- Schneeberger, Christian; et al. (2003). "Modelling changes in the mass balance of glaciers of the northern hemisphere for a transient 2×CO2 scenario". Journal of Hydrology. 282 (1–4): 145–163. Bibcode:2003JHyd..282..145S. doi:10.1016/S0022-1694(03)00260-9.CS1 maint: ref=harv (link)
- Chen, J. L.; Wilson, C. R.; Tapley, B. D. (2006). "Satellite Gravity Measurements Confirm Accelerated Melting of Greenland Ice Sheet". Science. 313 (5795): 1958–60. Bibcode:2006Sci...313.1958C. doi:10.1126/science.1129007. PMID 16902089.CS1 maint: ref=harv (link)
- Bindoff, N.L.; J. Willebrand; V. Artale; A. Cazenave; J. Gregory; S. Gulev; K. Hanawa; C. Le Quéré; S. Levitus; Y. Nojiri; C.K. Shum; L.D. Talley; A. Unnikrishnan (2007). Solomon, S.; D. Qin; M. Manning; Z. Chen; M. Marquis; K.B. Averyt; M. Tignor; H.L. Miller (eds.). "Observations: Oceanic Climate Change and Sea Level. In: Climate Change 2007: The Physical Science Basis. Contribution of Working Group I to the Fourth Assessment Report of the Intergovernmental Panel on Climate Change" (PDF). Cambridge University Press, Cambridge, United Kingdom and New York, NY, USA. Archived from the original (PDF) on 2017-05-13. Retrieved 2007-12-29.
- Fleming, Kevin; et al. (1998). "Refining the eustatic sea-level curve since the Last Glacial Maximum using far- and intermediate-field sites". Earth and Planetary Science Letters. 163 (1–4): 327–342. Bibcode:1998E&PSL.163..327F. doi:10.1016/S0012-821X(98)00198-8.CS1 maint: ref=harv (link)
- Goodwin, Ian D. (1998). "Did changes in Antarctic ice volume influence late Holocene sea-level lowering?". Quaternary Science Reviews. 17 (4–5): 319–332. Bibcode:1998QSRv...17..319G. doi:10.1016/S0277-3791(97)00051-6.CS1 maint: ref=harv (link)
- Nunn, Patrick D. (1998). "Sea-Level Changes over the Past 1,000 Years in the Pacific". Journal of Coastal Research. 14 (1): 23–30. doi:10.2112/0749-0208(1998)014[0023:SLCOTP]2.3.CO;2 (inactive 2020-03-21). JSTOR 4298758.CS1 maint: ref=harv (link)
- Hansen, James; et al. (2007). "Climate change and trace gases" (PDF). Phil. Trans. Roy. Soc. A. 365 (1856): 1925–54. Bibcode:2007RSPTA.365.1925H. doi:10.1098/rsta.2007.2052. PMID 17513270. Archived from the original (PDF) on 2011-10-22.CS1 maint: ref=harv (link)
- Mitrovica, J. X.; Gomez, N.; Clark, P. U. (2009). "The Sea-Level Fingerprint of West Antarctic Collapse". Science. 323 (5915): 753. Bibcode:2009Sci...323..753M. CiteSeerX 10.1.1.462.2329. doi:10.1126/science.1166510. PMID 19197056.CS1 maint: ref=harv (link)
- "Sea level rises could far exceed IPCC estimates". New Scientist. Retrieved 2009-01-24.
- Carlson, Anders E.; Legrande, Allegra N.; Oppo, Delia W.; Came, Rosemarie E.; Schmidt, Gavin A.; Anslow, Faron S.; Licciardi, Joseph M.; Obbink, Elizabeth A. (2008). "Rapid early Holocene deglaciation of the Laurentide ice sheet". Nature Geoscience. 1 (9): 620. Bibcode:2008NatGe...1..620C. doi:10.1038/ngeo285. hdl:1912/2707.CS1 maint: ref=harv (link)
- Pfeffer, Wt; Harper, Jt; O'Neel, S (September 2008). "Kinematic constraints on glacier contributions to 21st-century sea-level rise". Science. 321 (5894): 1340–3. Bibcode:2008Sci...321.1340P. doi:10.1126/science.1159099. ISSN 0036-8075. PMID 18772435.CS1 maint: ref=harv (link)
- Edited quote from public-domain source: "NOAA: NESDIS: NCDC: Frequently Asked Questions: How do we know the Earth's climate is warming?". NOAA. 10 March 2010.CS1 maint: ref=harv (link)
- Gille, Sarah T. (February 15, 2002). "Warming of the Southern Ocean Since the 1950s". Science. 295 (5558): 1275–7. Bibcode:2002Sci...295.1275G. doi:10.1126/science.1065863. PMID 11847337.CS1 maint: ref=harv (link)
- Kroeker, et al. (June 2013) "Impacts of ocean acidification on marine organisms: quantifying sensitivities and interaction with warming." Glob Chang Biol. 19(6): 1884–1896
- Harvey, et al. (April 2013) "Meta-analysis reveals complex marine biological responses to the interactive effects of ocean acidification and warming." Ecol Evol. 3(4): 1016–1030
- Nagelkerken Global alteration of ocean ecosystem functioning due to increasing human CO2 emissions, PNAS vol. 112 no. 43, 2015
- Bednaršek, N.; Harvey, C.J.; Kaplan, I.C.; Feely, R.A.; Možina, J. (2016). "Pteropods on the edge: Cumulative effects of ocean acidification, warming, and deoxygenation". Progress in Oceanography. 145: 1–24. doi:10.1016/j.pocean.2016.04.002.
- Keeling, Ralph F.; Garcia, Hernan E. (2002). "The change in oceanic O2 inventory associated with recent global warming". Proceedings of the National Academy of Sciences. 99 (12): 7848–7853. Bibcode:2002PNAS...99.7848K. doi:10.1073/pnas.122154899.
- Sabine, Christopher L.; et al. (2004). "The Oceanic Sink for Anthropogenic CO2". Science. 305 (5682): 367–371. Bibcode:2004Sci...305..367S. doi:10.1126/science.1097403. hdl:10261/52596. PMID 15256665.CS1 maint: ref=harv (link)
- "Emission cuts 'vital' for oceans". BBC. 2005-06-30. Retrieved 2007-12-29.
- "Ocean acidification due to increasing atmospheric carbon dioxide". Royal Society. 2005-06-30. Retrieved 2008-06-22.
- Thomas J Goreau (2005-05-30). "Global warming and coral reefs". Open Democracy. Retrieved 2007-12-29.
- Walther, Gian-Reto; et al. (2002). "Ecological responses to recent climate change". Nature. 416 (6879): 389–395. doi:10.1038/416389a. PMID 11919621.CS1 maint: ref=harv (link)
- Larry O'Hanlon (2006-07-05). "Rising Ocean Acidity Threatens Reefs". Discovery News. Retrieved 2007-12-29.
- Margaret Munro (2009-11-19). "Climate change causing 'corrosive' water to affect Arctic marine life: study". Canadawest. Archived from the original on 2009-11-21.
- Lenton, T. M.; Held, H.; Kriegler, E.; Hall, J. W.; Lucht, W.; Rahmstorf, S.; Schellnhuber, H. J. (2008). "Inaugural Article: Tipping elements in the Earth's climate system". Proceedings of the National Academy of Sciences. 105 (6): 1786–1793. Bibcode:2008PNAS..105.1786L. doi:10.1073/pnas.0705414105. PMC 2538841. PMID 18258748.
- IPCC (2007). M.L. Parry et al. (eds.). Summary for Policymakers. In: Climate Change 2007: Impacts, Adaptation and Vulnerability. Contribution of Working Group II to the Fourth Assessment Report of the Intergovernmental Panel on Climate Change (PDF). Cambridge University Press, Cambridge, U.K., and New York, N.Y., U.S.A. pp. 7–22. Retrieved 2007-11-30.CS1 maint: uses editors parameter (link)
- Crowley, T. J.; North, G. R. (May 1988). "Abrupt Climate Change and Extinction Events in Earth History". Science. 240 (4855): 996–1002. Bibcode:1988Sci...240..996C. doi:10.1126/science.240.4855.996. PMID 17731712.
- Shaffer, G. .; Olsen, S. M.; Pedersen, J. O. P. (2009). "Long-term ocean oxygen depletion in response to carbon dioxide emissions from fossil fuels". Nature Geoscience. 2 (2): 105–109. Bibcode:2009NatGe...2..105S. doi:10.1038/ngeo420.
- Pagli, Carolina; Sigmundsson, Freysteinn (2008). "Will present day glacier retreat increase volcanic activity? Stress induced by recent glacier retreat and its effect on magmatism at the Vatnajökull ice cap, Iceland" (PDF). Geophysical Research Letters. 35 (9): L09304. Bibcode:2008GeoRL..3509304P. doi:10.1029/2008GL033510.CS1 maint: ref=harv (link)
- Sigvaldason, Gudmundur E; Annertz, Kristian; Nilsson, Magnus (1992). "Effect of glacier loading/deloading on volcanism: postglacial volcanic production rate of the Dyngjufjöll area, central Iceland". Bulletin of Volcanology. 54 (5): 385. Bibcode:1992BVol...54..385S. doi:10.1007/BF00312320.CS1 maint: ref=harv (link)
- Slater, L; Jull, M; McKenzie, D; Gronvöld, K (1998). "Deglaciation effects on mantle melting under Iceland: results from the northern volcanic zone". Earth and Planetary Science Letters. 164 (1–2): 151. Bibcode:1998E&PSL.164..151S. doi:10.1016/S0012-821X(98)00200-3.CS1 maint: ref=harv (link)
- Jellinek, A. Mark (2004). "Did melting glaciers cause volcanic eruptions in eastern California? Probing the mechanics of dike formation". Journal of Geophysical Research. 109: B09206. Bibcode:2004JGRB..10909206J. doi:10.1029/2004JB002978. hdl:2027.42/94661.CS1 maint: ref=harv (link)
- McGuire, Bill (2002). Nicolette Linton (ed.). Raging planet: earthquakes, volcanoes, and the tectonic threat to life on earth. Hauppauge, New York: Quarto Inc. ISBN 978-0-7641-1969-9.
- University of Toronto (February 6, 2009). "Collapse Of Antarctic Ice Sheet Would Likely Put Washington, D.C. Largely Underwater". ScienceDaily. Retrieved 19 November 2010.
- Tuffen, H. (2010). "How will melting of ice affect volcanic hazards in the twenty-first century?". Philosophical Transactions of the Royal Society A: Mathematical, Physical and Engineering Sciences. 368 (1919): 2535–58. Bibcode:2010RSPTA.368.2535T. doi:10.1098/rsta.2010.0063. PMID 20403841.CS1 maint: ref=harv (link)
- Deeming, K. R.; McGuire, B.; Harrop, P. (2010). "Climate forcing of volcano lateral collapse: evidence from Mount Etna, Sicily". Philosophical Transactions of the Royal Society A: Mathematical, Physical and Engineering Sciences. 368 (1919): 2559–77. Bibcode:2010RSPTA.368.2559D. doi:10.1098/rsta.2010.0054. PMID 20403842.CS1 maint: ref=harv (link)
- Hampel, A.; Hetzel, R.; Maniatis, G. (2010). "Response of faults to climate-driven changes in ice and water volumes on Earth's surface". Philosophical Transactions of the Royal Society A: Mathematical, Physical and Engineering Sciences. 368 (1919): 2501–17. Bibcode:2010RSPTA.368.2501H. doi:10.1098/rsta.2010.0031. PMID 20403839.CS1 maint: ref=harv (link)
References
- IPCC AR4 WG1 (2007). Solomon, S.; Qin, D.; Manning, M.; Chen, Z.; Marquis, M.; Averyt, K.B.; Tignor, M.; Miller, H.L. (eds.). Climate Change 2007: The Physical Science Basis. Contribution of Working Group I to the Fourth Assessment Report of the Intergovernmental Panel on Climate Change. Cambridge University Press. ISBN 978-0-521-88009-1.CS1 maint: ref=harv (link) (pb: 978-0-521-70596-7).
External links
- The IPCC Working Group I (WG I) website. This body assesses the physical scientific aspects of the climate system and climate change.
- Climate Change at the National Academies - US National Academy of Sciences
- UNFCCC: State of the Climate in 2018 Shows Accelerating Climate Change Impacts
| |||||||||||||
| |||||||||||||
| |||||||||||||
| |||||||||||||
| |||||||||||||
| |||||||||||||
| |||||||||||||