Attribution of recent climate change
Attribution of recent climate change is the effort to scientifically ascertain mechanisms responsible for recent global warming and related climate changes on Earth.[4] The effort has focused on changes observed during the period of instrumental temperature record, particularly in the last 50 years. This is the period when human activity has grown fastest and observations of the atmosphere above the surface have become available. According to the Intergovernmental Panel on Climate Change (IPCC), it is "extremely likely"[5] that human influence was the dominant cause of global warming between 1951 and 2010.[6] Likely human contribution is 93%–123% of the observed 1951–2010 temperature change.[7]
Some of the main human activities that contribute to global warming are:[8]
- increasing atmospheric concentrations of greenhouse gases, for a warming effect
- global changes to land surface, such as deforestation, for a warming effect
- increasing atmospheric concentrations of aerosols, mainly for a cooling effect

In addition to human activities, some natural mechanisms can also cause climate change, including for example, climate oscillations, changes in solar activity, and volcanic activity.
Multiple lines of evidence support attribution of recent climate change to human activities:[9]
- A physical understanding of the climate system: greenhouse gas concentrations have increased and their warming properties are well-established.
- Historical estimates of past climate changes suggest that the recent changes in global surface temperature are unusual.
- Computer-based climate models are unable to replicate the observed warming unless human greenhouse gas emissions are included.
- Natural forces alone (such as solar and volcanic activity) cannot explain the observed warming.
The IPCC's attribution of recent global warming to human activities is a view shared by the scientific community,[10][11][12] and is also supported by 196 other scientific organizations worldwide[13] (see also: Scientific consensus on climate change).
Background
Factors affecting Earth's climate can be broken down into feedbacks and forcings.[11]:7 A forcing is something that is imposed externally on the climate system. External forcings include natural phenomena such as volcanic eruptions and variations in the sun's output.[15] Human activities can also impose forcings, for example, through changing the composition of the atmosphere.
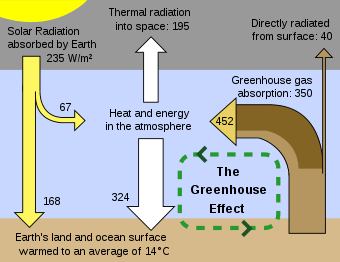
Radiative forcing is a measure of how various factors alter the energy balance of the Earth's atmosphere.[16] A positive radiative forcing will tend to increase the energy of the Earth-atmosphere system, leading to a warming of the system. Between the start of the Industrial Revolution in 1750, and the year 2005, the increase in the atmospheric concentration of carbon dioxide (chemical formula: CO
2) led to a positive radiative forcing, averaged over the Earth's surface area, of about 1.66 watts per square metre (abbreviated W m−2).[17]
Climate feedbacks can either amplify or dampen the response of the climate to a given forcing.[11]:7 There are many feedback mechanisms in the climate system that can either amplify (a positive feedback) or diminish (a negative feedback) the effects of a change in climate forcing.
The climate system will vary in response to changes in forcings.[18] The climate system will show internal variability both in the presence and absence of forcings imposed on it, (see images opposite). This internal variability is a result of complex interactions between components of the climate system, such as the coupling between the atmosphere and ocean (see also the later section on Internal climate variability and global warming).[19] An example of internal variability is the El Niño–Southern Oscillation.
Detection vs. attribution
.png)
Detection and attribution of climate signals, as well as its common-sense meaning, has a more precise definition within the climate change literature, as expressed by the IPCC.[21] Detection of a climate signal does not always imply significant attribution. The IPCC's Fourth Assessment Report says "it is extremely likely that human activities have exerted a substantial net warming influence on climate since 1750," where "extremely likely" indicates a probability greater than 95%.[22] Detection of a signal requires demonstrating that an observed change is statistically significantly different from that which can be explained by natural internal variability.
Attribution requires demonstrating that a signal is:
- unlikely to be due entirely to internal variability;
- consistent with the estimated responses to the given combination of anthropogenic and natural forcing
- not consistent with alternative, physically plausible explanations of recent climate change that exclude important elements of the given combination of forcings.
Key attributions
Greenhouse gases
Carbon dioxide is the primary greenhouse gas that is contributing to recent climate change.[23] CO
2 is absorbed and emitted naturally as part of the carbon cycle, through animal and plant respiration, volcanic eruptions, and ocean-atmosphere exchange.[23] Human activities, such as the burning of fossil fuels and changes in land use (see below), release large amounts of carbon to the atmosphere, causing CO
2 concentrations in the atmosphere to rise.[23][24]
The high-accuracy measurements of atmospheric CO
2 concentration, initiated by Charles David Keeling in 1958, constitute the master time series documenting the changing composition of the atmosphere.[25] These data have iconic status in climate change science as evidence of the effect of human activities on the chemical composition of the global atmosphere.[25]
In May 2019 the concentration of CO2 in the atmosphere reached 415 PPM. The last time when it reached this level was 2.6 – 5.3 million years ago. Without human intervention, it would be 280 PPM.[26]
Along with CO
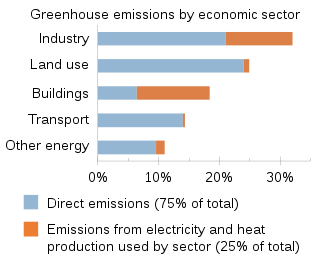
2, methane and to a lesser extent nitrous oxide are also major forcing contributors to the greenhouse effect. The Kyoto Protocol lists these together with hydrofluorocarbon (HFCs), perfluorocarbons (PFCs), and sulfur hexafluoride (SF6),[27] which are entirely artificial gases, as contributors to radiative forcing. The chart at right attributes anthropogenic greenhouse gas emissions to eight main economic sectors, of which the largest contributors are power stations (many of which burn coal or other fossil fuels), industrial processes, transportation fuels (generally fossil fuels), and agricultural by-products (mainly methane from enteric fermentation and nitrous oxide from fertilizer use).[28]
Water vapor
Water vapor is the most abundant greenhouse gas and is the largest contributor to the natural greenhouse effect, despite having a short atmospheric lifetime[23] (about 10 days).[29] Some human activities can influence local water vapor levels. However, on a global scale, the concentration of water vapor is controlled by temperature, which influences overall rates of evaporation and precipitation.[23] Therefore, the global concentration of water vapor is not substantially affected by direct human emissions.[23]
Land use
Climate change is attributed to land use for two main reasons. Between 1750 and 2007, about two-thirds of anthropogenic CO
2 emissions were produced from burning fossil fuels, and about one-third of emissions from changes in land use,[30] primarily deforestation.[31] Deforestation both reduces the amount of carbon dioxide absorbed by deforested regions and releases greenhouse gases directly, together with aerosols, through biomass burning that frequently accompanies it.
Some of the causes of climate change are, generally, not connected with it directly in the media coverage. For example, the harm done by humans to the populations of Elephants and Monkeys contributes to deforestation therefore to climate change.[32]
A second reason that climate change has been attributed to land use is that the terrestrial albedo is often altered by use, which leads to radiative forcing. This effect is more significant locally than globally.[31]
Livestock and land use
Worldwide, livestock production occupies 70% of all land used for agriculture, or 30% of the ice-free land surface of the Earth.[33] More than 18% of anthropogenic greenhouse gas emissions are attributed to livestock and livestock-related activities such as deforestation and increasingly fuel-intensive farming practices.[33] Specific attributions to the livestock sector include:
- 9% of global anthropogenic carbon dioxide emissions
- 35–40% of global anthropogenic methane emissions (chiefly due to enteric fermentation and manure)
- 64% of global anthropogenic nitrous oxide emissions, chiefly due to fertilizer use.[33]
Aerosols
With virtual certainty, scientific consensus has attributed various forms of climate change, chiefly cooling effects, to aerosols, which are small particles or droplets suspended in the atmosphere.[34] Key sources to which anthropogenic aerosols are attributed[35] include:
- biomass burning such as slash-and-burn deforestation. Aerosols produced are primarily black carbon.
- industrial air pollution, which produces soot and airborne sulfates, nitrates, and ammonium
- dust produced by land use effects such as desertification
Attribution of 20th-century climate change
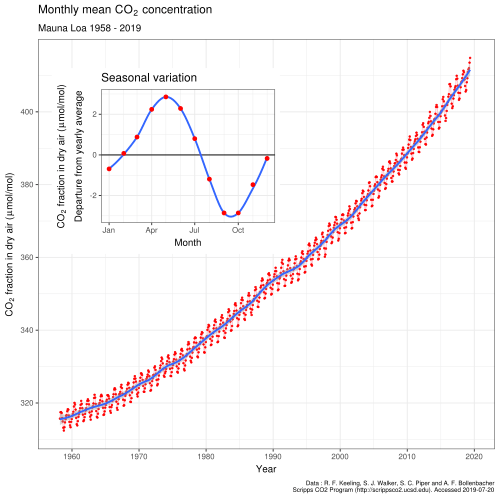
2) concentrations from 1958–2018. Monthly CO
2 measurements display seasonal oscillations in an upward trend. Each year's maximum occurs during the Northern Hemisphere's late spring.
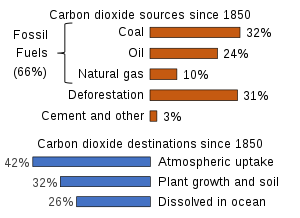
2 sources and sinks since 1880. While there is little debate that excess carbon dioxide in the industrial era has mostly come from burning fossil fuels, the future strength of land and ocean carbon sinks is an area of study.[36]
Over the past 150 years human activities have released increasing quantities of greenhouse gases into the atmosphere. This has led to increases in mean global temperature, or global warming. Other human effects are relevant—for example, sulphate aerosols are believed to have a cooling effect. Natural factors also contribute. According to the historical temperature record of the last century, the Earth's near-surface air temperature has risen around 0.74 ± 0.18 °Celsius (1.3 ± 0.32 °Fahrenheit).[37]
A historically important question in climate change research has regarded the relative importance of human activity and non-anthropogenic causes during the period of instrumental record. In the 1995 Second Assessment Report (SAR), the IPCC made the widely quoted statement that "The balance of evidence suggests a discernible human influence on global climate". The phrase "balance of evidence" suggested the (English) common-law standard of proof required in civil as opposed to criminal courts: not as high as "beyond reasonable doubt". In 2001 the Third Assessment Report (TAR) refined this, saying "There is new and stronger evidence that most of the warming observed over the last 50 years is attributable to human activities".[38] The 2007 Fourth Assessment Report (AR4) strengthened this finding:
- "Anthropogenic warming of the climate system is widespread and can be detected in temperature observations taken at the surface, in the free atmosphere and in the oceans. Evidence of the effect of external influences, both anthropogenic and natural, on the climate system has continued to accumulate since the TAR."[39]
Other findings of the IPCC Fourth Assessment Report include:
- "It is extremely unlikely (<5%)[40] that the global pattern of warming during the past half century can be explained without external forcing (i.e., it is inconsistent with being the result of internal variability), and very unlikely[40] that it is due to known natural external causes alone. The warming occurred in both the ocean and the atmosphere and took place at a time when natural external forcing factors would likely have produced cooling."[41]
- "From new estimates of the combined anthropogenic forcing due to greenhouse gases, aerosols, and land surface changes, it is extremely likely (>95%)[40] that human activities have exerted a substantial net warming influence on climate since 1750."[42]
- "It is virtually certain[40] that anthropogenic aerosols produce a net negative radiative forcing (cooling influence) with a greater magnitude in the Northern Hemisphere than in the Southern Hemisphere."[42]
Over the past five decades there has been a global warming of approximately 0.65 °C (1.17 °F) at the Earth's surface (see historical temperature record). Among the possible factors that could produce changes in global mean temperature are internal variability of the climate system, external forcing, an increase in concentration of greenhouse gases, or any combination of these. Current studies indicate that the increase in greenhouse gases, most notably CO
2, is mostly responsible for the observed warming. Evidence for this conclusion includes:
- Estimates of internal variability from climate models, and reconstructions of past temperatures, indicate that the warming is unlikely to be entirely natural.
- Climate models forced by natural factors and increased greenhouse gases and aerosols reproduce the observed global temperature changes; those forced by natural factors alone do not.[38]
- "Fingerprint" methods (see below) indicate that the pattern of change is closer to that expected from greenhouse gas-forced change than from natural change.[43]
- The plateau in warming from the 1940s to 1960s can be attributed largely to sulphate aerosol cooling.[44]
Details on attribution
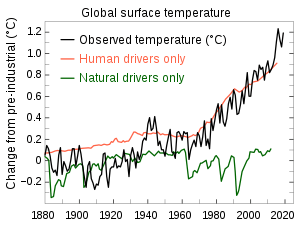
Recent scientific assessments find that most of the warming of the Earth's surface over the past 50 years has been caused by human activities (see also the section on scientific literature and opinion). This conclusion rests on multiple lines of evidence. Like the warming "signal" that has gradually emerged from the "noise" of natural climate variability, the scientific evidence for a human influence on global climate has accumulated over the past several decades, from many hundreds of studies. No single study is a "smoking gun." Nor has any single study or combination of studies undermined the large body of evidence supporting the conclusion that human activity is the primary driver of recent warming.[45]
The first line of evidence is based on a physical understanding of how greenhouse gases trap heat, how the climate system responds to increases in greenhouse gases, and how other human and natural factors influence climate. The second line of evidence is from indirect estimates of climate changes over the last 1,000 to 2,000 years. These records are obtained from living things and their remains (like tree rings and corals) and from physical quantities (like the ratio between lighter and heavier isotopes of oxygen in ice cores), which change in measurable ways as climate changes. The lesson from these data is that global surface temperatures over the last several decades are clearly unusual, in that they were higher than at any time during at least the past 400 years. For the Northern Hemisphere, the recent temperature rise is clearly unusual in at least the last 1,000 years (see graph opposite).[45]
The third line of evidence is based on the broad, qualitative consistency between observed changes in climate and the computer model simulations of how climate would be expected to change in response to human activities. For example, when climate models are run with historical increases in greenhouse gases, they show gradual warming of the Earth and ocean surface, increases in ocean heat content and the temperature of the lower atmosphere, a rise in global sea level, retreat of sea ice and snow cover, cooling of the stratosphere, an increase in the amount of atmospheric water vapor, and changes in large-scale precipitation and pressure patterns. These and other aspects of modelled climate change are in agreement with observations.[45]
"Fingerprint" studies
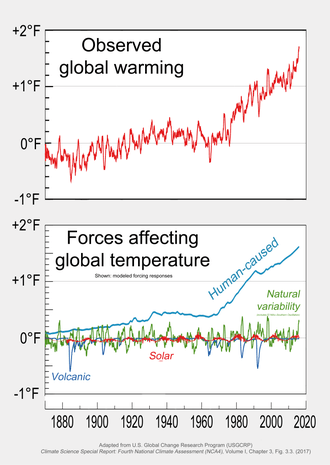
Bottom panel: Data more recent than that plotted at left, and merged for display on the same axis to emphasize relative strengths of forces affecting temperature change. Human-caused forces have increasingly dominated.
Finally, there is extensive statistical evidence from so-called "fingerprint" studies. Each factor that affects climate produces a unique pattern of climate response, much as each person has a unique fingerprint. Fingerprint studies exploit these unique signatures, and allow detailed comparisons of modelled and observed climate change patterns. Scientists rely on such studies to attribute observed changes in climate to a particular cause or set of causes. In the real world, the climate changes that have occurred since the start of the Industrial Revolution are due to a complex mixture of human and natural causes. The importance of each individual influence in this mixture changes over time. Of course, there are not multiple Earths, which would allow an experimenter to change one factor at a time on each Earth, thus helping to isolate different fingerprints. Therefore, climate models are used to study how individual factors affect climate. For example, a single factor (like greenhouse gases) or a set of factors can be varied, and the response of the modelled climate system to these individual or combined changes can thus be studied.[45]
These projections have been confirmed by observations (shown above).[46]}} For example, when climate model simulations of the last century include all of the major influences on climate, both human-induced and natural, they can reproduce many important features of observed climate change patterns. When human influences are removed from the model experiments, results suggest that the surface of the Earth would actually have cooled slightly over the last 50 years. The clear message from fingerprint studies is that the observed warming over the last half-century cannot be explained by natural factors, and is instead caused primarily by human factors.[45]
Another fingerprint of human effects on climate has been identified by looking at a slice through the layers of the atmosphere, and studying the pattern of temperature changes from the surface up through the stratosphere (see the section on solar activity). The earliest fingerprint work focused on changes in surface and atmospheric temperature. Scientists then applied fingerprint methods to a whole range of climate variables, identifying human-caused climate signals in the heat content of the oceans, the height of the tropopause (the boundary between the troposphere and stratosphere, which has shifted upward by hundreds of feet in recent decades), the geographical patterns of precipitation, drought, surface pressure, and the runoff from major river basins.[47]
Studies published after the appearance of the IPCC Fourth Assessment Report in 2007 have also found human fingerprints in the increased levels of atmospheric moisture (both close to the surface and over the full extent of the atmosphere), in the decline of Arctic sea ice extent, and in the patterns of changes in Arctic and Antarctic surface temperatures.[47]
The message from this entire body of work is that the climate system is telling a consistent story of increasingly dominant human influence – the changes in temperature, ice extent, moisture, and circulation patterns fit together in a physically consistent way, like pieces in a complex puzzle.[48]
Increasingly, this type of fingerprint work is shifting its emphasis. As noted, clear and compelling scientific evidence supports the case for a pronounced human influence on global climate. Much of the recent attention is now on climate changes at continental and regional scales, and on variables that can have large impacts on societies. For example, scientists have established causal links between human activities and the changes in snowpack, maximum and minimum (diurnal) temperature, and the seasonal timing of runoff over mountainous regions of the western United States. Human activity is likely to have made a substantial contribution to ocean surface temperature changes in hurricane formation regions. Researchers are also looking beyond the physical climate system, and are beginning to tie changes in the distribution and seasonal behaviour of plant and animal species to human-caused changes in temperature and precipitation.[48]
For over a decade, one aspect of the climate change story seemed to show a significant difference between models and observations. In the tropics, all models predicted that with a rise in greenhouse gases, the troposphere would be expected to warm more rapidly than the surface. Observations from weather balloons, satellites, and surface thermometers seemed to show the opposite behaviour (more rapid warming of the surface than the troposphere). This issue was a stumbling block in understanding the causes of climate change. It is now largely resolved. Research showed that there were large uncertainties in the satellite and weather balloon data. When uncertainties in models and observations are properly accounted for, newer observational data sets (with better treatment of known problems) are in agreement with climate model results.[48]
This does not mean, however, that all remaining differences between models and observations have been resolved. The observed changes in some climate variables, such as Arctic sea ice, some aspects of precipitation, and patterns of surface pressure, appear to be proceeding much more rapidly than models have projected. The reasons for these differences are not well understood. Nevertheless, the bottom-line conclusion from climate fingerprinting is that most of the observed changes studied to date are consistent with each other, and are also consistent with our scientific understanding of how the climate system would be expected to respond to the increase in heat-trapping gases resulting from human activities.[49]
Extreme weather events

One of the subjects discussed in the literature is whether or not extreme weather events can be attributed to human activities. Seneviratne et al. (2012)[51] stated that attributing individual extreme weather events to human activities was challenging. They were, however, more confident over attributing changes in long-term trends of extreme weather. For example, Seneviratne et al. (2012)[52] concluded that human activities had likely led to a warming of extreme daily minimum and maximum temperatures at the global scale.
Another way of viewing the problem is to consider the effects of human-induced climate change on the probability of future extreme weather events. Stott et al. (2003),[53] for example, considered whether or not human activities had increased the risk of severe heat waves in Europe, like the one experienced in 2003. Their conclusion was that human activities had very likely more than doubled the risk of heat waves of this magnitude.[53]
An analogy can be made between an athlete on steroids and human-induced climate change.[54] In the same way that an athlete's performance may increase from using steroids, human-induced climate change increases the risk of some extreme weather events.
Hansen et al. (2012)[55] suggested that human activities have greatly increased the risk of summertime heat waves. According to their analysis, the land area of the Earth affected by very hot summer temperature anomalies has greatly increased over time (refer to graphs on the left). In the base period 1951–1980, these anomalies covered a few tenths of 1% of the global land area.[56] In recent years, this has increased to around 10% of the global land area. With high confidence, Hansen et al. (2012)[56] attributed the 2010 Moscow and 2011 Texas heat waves to human-induced global warming.
An earlier study by Dole et al. (2011)[57] concluded that the 2010 Moscow heatwave was mostly due to natural weather variability. While not directly citing Dole et al. (2011),[57] Hansen et al. (2012)[56] rejected this type of explanation. Hansen et al. (2012)[56] stated that a combination of natural weather variability and human-induced global warming was responsible for the Moscow and Texas heat waves.
Scientific literature and opinion
There are a number of examples of published and informal support for the consensus view. As mentioned earlier, the IPCC has concluded that most of the observed increase in globally averaged temperatures since the mid-20th century is "very likely" due to human activities.[58] The IPCC's conclusions are consistent with those of several reports produced by the US National Research Council.[10][59][60] A report published in 2009 by the U.S. Global Change Research Program concluded that "[global] warming is unequivocal and primarily human-induced."[61] A number of scientific organizations have issued statements that support the consensus view. Two examples include:
- a joint statement made in 2005 by the national science academies of the G8, and Brazil, China and India;[62]
- a joint statement made in 2008 by the Network of African Science Academies.[63]
Detection and attribution studies
%2C_the_El_Ni%C3%B1o_%E2%80%93_Southern_Oscillation%2C_the_Arctic_Oscillation%2C_and_the_North_Atlantic_Oscillation_(NOAA).png)
The IPCC Fourth Assessment Report (2007), concluded that attribution was possible for a number of observed changes in the climate (see effects of global warming). However, attribution was found to be more difficult when assessing changes over smaller regions (less than continental scale) and over short time periods (less than 50 years).[41] Over larger regions, averaging reduces natural variability of the climate, making detection and attribution easier.
- In 1996, in a paper in Nature titled "A search for human influences on the thermal structure of the atmosphere", Benjamin D. Santer et al. wrote: "The observed spatial patterns of temperature change in the free atmosphere from 1963 to 1987 are similar to those predicted by state-of-the-art climate models incorporating various combinations of changes in carbon dioxide, anthropogenic sulphate aerosol and stratospheric ozone concentrations. The degree of pattern similarity between models and observations increases through this period. It is likely that this trend is partially due to human activities, although many uncertainties remain, particularly relating to estimates of natural variability."
- A 2002 paper in the Journal of Geophysical Research says "Our analysis suggests that the early twentieth century warming can best be explained by a combination of warming due to increases in greenhouse gases and natural forcing, some cooling due to other anthropogenic forcings, and a substantial, but not implausible, contribution from internal variability. In the second half of the century we find that the warming is largely caused by changes in greenhouse gases, with changes in sulphates and, perhaps, volcanic aerosol offsetting approximately one third of the warming."[65][66]
- A 2005 review of detection and attribution studies by the International Ad hoc Detection and Attribution Group[67] found that "natural drivers such as solar variability and volcanic activity are at most partially responsible for the large-scale temperature changes observed over the past century, and that a large fraction of the warming over the last 50 yr can be attributed to greenhouse gas increases. Thus, the recent research supports and strengthens the IPCC Third Assessment Report conclusion that 'most of the global warming over the past 50 years is likely due to the increase in greenhouse gases.'"
- Barnett and colleagues (2005) say that the observed warming of the oceans "cannot be explained by natural internal climate variability or solar and volcanic forcing, but is well simulated by two anthropogenically forced climate models," concluding that "it is of human origin, a conclusion robust to observational sampling and model differences".[68]
- Two papers in the journal Science in August 2005[69][70] resolve the problem, evident at the time of the TAR, of tropospheric temperature trends (see also the section on "fingerprint" studies) . The UAH version of the record contained errors, and there is evidence of spurious cooling trends in the radiosonde record, particularly in the tropics. See satellite temperature measurements for details; and the 2006 US CCSP report.[71]
- Multiple independent reconstructions of the temperature record of the past 1000 years confirm that the late 20th century is probably the warmest period in that time (see the preceding section -details on attribution).
Reviews of scientific opinion
- An essay in Science surveyed 928 abstracts related to climate change, and concluded that most journal reports accepted the consensus.[72] This is discussed further in scientific consensus on climate change.
- A 2010 paper in the Proceedings of the National Academy of Sciences found that among a pool of roughly 1,000 researchers who work directly on climate issues and publish the most frequently on the subject, 97% agree that anthropogenic climate change is happening.[73]
- A 2011 paper from George Mason University published in the International Journal of Public Opinion Research, "The Structure of Scientific Opinion on Climate Change," collected the opinions of scientists in the earth, space, atmospheric, oceanic or hydrological sciences.[74] The 489 survey respondents—representing nearly half of all those eligible according to the survey's specific standards – work in academia, government, and industry, and are members of prominent professional organizations.[74] The study found that 97% of the 489 scientists surveyed agreed that global temperatures have risen over the past century.[74] Moreover, 84% agreed that "human-induced greenhouse warming" is now occurring."[74] Only 5% disagreed with the idea that human activity is a significant cause of global warming.[74]
As described above, a small minority of scientists do disagree with the consensus. For example, Willie Soon and Richard Lindzen[75] say that there is insufficient proof for anthropogenic attribution. Generally this position requires new physical mechanisms to explain the observed warming.[76]
Solar activity
.png)
Solar sunspot maximum occurs when the magnetic field of the Sun collapses and reverse as part of its average 11-year solar cycle (22 years for complete North to North restoration).
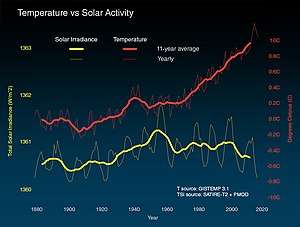
The role of the Sun in recent climate change has been looked at by climate scientists. Since 1978, output from the Sun has been measured by satellites[11]:6 significantly more accurately than was previously possible from the surface. These measurements indicate that the Sun's total solar irradiance has not increased since 1978, so the warming during the past 30 years cannot be directly attributed to an increase in total solar energy reaching the Earth (see graph above, left). In the three decades since 1978, the combination of solar and volcanic activity probably had a slight cooling influence on the climate.[77]
Climate models have been used to examine the role of the Sun in recent climate change.[78] Models are unable to reproduce the rapid warming observed in recent decades when they only take into account variations in total solar irradiance and volcanic activity. Models are, however, able to simulate the observed 20th century changes in temperature when they include all of the most important external forcings, including human influences and natural forcings. As has already been stated, Hegerl et al. (2007) concluded that greenhouse gas forcing had "very likely" caused most of the observed global warming since the mid-20th century. In making this conclusion, Hegerl et al. (2007) allowed for the possibility that climate models had been underestimated the effect of solar forcing.[79]
The role of solar activity in climate change has also been calculated over longer time periods using "proxy" datasets, such as tree rings.[80] Models indicate that solar and volcanic forcings can explain periods of relative warmth and cold between AD 1000 and 1900, but human-induced forcings are needed to reproduce the late-20th century warming.[81]
Another line of evidence against the sun having caused recent climate change comes from looking at how temperatures at different levels in the Earth's atmosphere have changed.[82] Models and observations (see figure above, middle) show that greenhouse gas results in warming of the lower atmosphere at the surface (called the troposphere) but cooling of the upper atmosphere (called the stratosphere).[83] Depletion of the ozone layer by chemical refrigerants has also resulted in a cooling effect in the stratosphere. If the Sun was responsible for observed warming, warming of the troposphere at the surface and warming at the top of the stratosphere would be expected as increase solar activity would replenish ozone and oxides of nitrogen.[84] The stratosphere has a reverse temperature gradient than the troposphere so as the temperature of the troposphere cools with altitude, the stratosphere rises with altitude. Hadley cells are the mechanism by which equatorial generated ozone in the tropics (highest area of UV irradiance in the stratosphere) is moved poleward. Global climate models suggest that climate change may widen the Hadley cells and push the jetstream northward thereby expanding the tropics region and resulting in warmer, dryer conditions in those areas overall.[85]
Non-consensus views
Habibullo Abdussamatov (2004), head of space research at St. Petersburg's Pulkovo Astronomical Observatory in Russia, has argued that the sun is responsible for recently observed climate change.[86] Journalists for news sources canada.com (Solomon, 2007b),[87] National Geographic News (Ravillious, 2007),[88] and LiveScience (Than, 2007)[89] reported on the story of warming on Mars. In these articles, Abdussamatov was quoted. He stated that warming on Mars was evidence that global warming on Earth was being caused by changes in the sun.
Ravillious (2007)[88] quoted two scientists who disagreed with Abdussamatov: Amato Evan, a climate scientist at the University of Wisconsin–Madison, in the US, and Colin Wilson, a planetary physicist at Oxford University in the UK. According to Wilson, "Wobbles in the orbit of Mars are the main cause of its climate change in the current era" (see also orbital forcing).[90] Than (2007) quoted Charles Long, a climate physicist at Pacific Northwest National Laboratories in the US, who disagreed with Abdussamatov.[89]
Than (2007) pointed to the view of Benny Peiser, a social anthropologist at Liverpool John Moores University in the UK.[89] In his newsletter, Peiser had cited a blog that had commented on warming observed on several planetary bodies in the Solar system. These included Neptune's moon Triton,[91] Jupiter,[92] Pluto[93] and Mars. In an e-mail interview with Than (2007), Peiser stated that:
"I think it is an intriguing coincidence that warming trends have been observed on a number of very diverse planetary bodies in our solar system, (...) Perhaps this is just a fluke."
Than (2007) provided alternative explanations of why warming had occurred on Triton, Pluto, Jupiter and Mars.
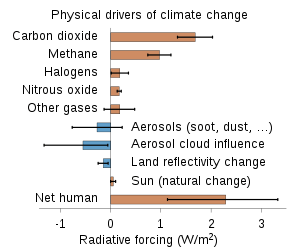
The US Environmental Protection Agency (US EPA, 2009) responded to public comments on climate change attribution.[94] A number of commenters had argued that recent climate change could be attributed to changes in solar irradiance. According to the US EPA (2009), this attribution was not supported by the bulk of the scientific literature. Citing the work of the IPCC (2007), the US EPA pointed to the low contribution of solar irradiance to radiative forcing since the start of the Industrial Revolution in 1750. Over this time period (1750 to 2005),[95] the estimated contribution of solar irradiance to radiative forcing was 5% the value of the combined radiative forcing due to increases in the atmospheric concentrations of carbon dioxide, methane and nitrous oxide (see graph opposite).
Effect of cosmic rays
Henrik Svensmark has suggested that the magnetic activity of the sun deflects cosmic rays, and that this may influence the generation of cloud condensation nuclei, and thereby have an effect on the climate.[96] The website ScienceDaily reported on a 2009 study that looked at how past changes in climate have been affected by the Earth's magnetic field.[97] Geophysicist Mads Faurschou Knudsen, who co-authored the study, stated that the study's results supported Svensmark's theory. The authors of the study also acknowledged that CO
2 plays an important role in climate change.
Consensus view on cosmic rays
The view that cosmic rays could provide the mechanism by which changes in solar activity affect climate is not supported by the literature.[98] Solomon et al. (2007)[99] state:
[..] the cosmic ray time series does not appear to correspond to global total cloud cover after 1991 or to global low-level cloud cover after 1994. Together with the lack of a proven physical mechanism and the plausibility of other causal factors affecting changes in cloud cover, this makes the association between galactic cosmic ray-induced changes in aerosol and cloud formation controversial
Studies by Lockwood and Fröhlich (2007)[100] and Sloan and Wolfendale (2008)[101] found no relation between warming in recent decades and cosmic rays. Pierce and Adams (2009)[102] used a model to simulate the effect of cosmic rays on cloud properties. They concluded that the hypothesized effect of cosmic rays was too small to explain recent climate change.[102] Pierce and Adams (2009)[103] noted that their findings did not rule out a possible connection between cosmic rays and climate change, and recommended further research.
Erlykin et al. (2009)[104] found that the evidence showed that connections between solar variation and climate were more likely to be mediated by direct variation of insolation rather than cosmic rays, and concluded: "Hence within our assumptions, the effect of varying solar activity, either by direct solar irradiance or by varying cosmic ray rates, must be less than 0.07 °C since 1956, i.e. less than 14% of the observed global warming." Carslaw (2009)[105] and Pittock (2009)[106] review the recent and historical literature in this field and continue to find that the link between cosmic rays and climate is tenuous, though they encourage continued research. US EPA (2009)[98] commented on research by Duplissy et al. (2009):[107]
The CLOUD experiments at CERN are interesting research but do not provide conclusive evidence that cosmic rays can serve as a major source of cloud seeding. Preliminary results from the experiment (Duplissy et al., 2009) suggest that though there was some evidence of ion mediated nucleation, for most of the nucleation events observed the contribution of ion processes appeared to be minor. These experiments also showed the difficulty in maintaining sufficiently clean conditions and stable temperatures to prevent spurious aerosol bursts. There is no indication that the earlier Svensmark experiments could even have matched the controlled conditions of the CERN experiment. We find that the Svensmark results on cloud seeding have not yet been shown to be robust or sufficient to materially alter the conclusions of the assessment literature, especially given the abundance of recent literature that is skeptical of the cosmic ray-climate linkage
See also
Notes
- "Global Annual Mean Surface Air Temperature Change". NASA. Retrieved 23 February 2020..
- IPCC AR5 SYR Glossary 2014, p. 124.
- USGCRP Chapter 3 2017 Figure 3.1 panel 2, Figure 3.3 panel 5.
- "NASA – What's in a Name? Global Warming vs. Climate Change". nasa.gov. Retrieved 29 October 2018.
- The IPCC defines "extremely likely" as indicating a probability of 95 to 100%, based on an expert assessment of all the available evidence. IPCC AR5 WG1 2013, Section: Summary for Policymakers (finalized version), page 4, footnote 2.
- IPCC AR5 WG1 2013, Section: Summary for Policymakers (finalized version), Chapter: D.3 Detection and Attribution of Climate Change, page 17.
- "The likely range of the human contribution to the global mean temperature increase over the period 1951–2010 is 1.1° to 1.4°F (0.6° to 0.8°C), and the central estimate of the observed warming of 1.2°F (0.65°C) lies within this range (high confidence). This translates to a likely human contribution of 93%–123% of the observed 1951–2010 change." Chapter 3: Detection and Attribution of Climate Change, Climate Science Special Report , U.S. Global Change Research Program.
- IPCC AR4 WG1 2007, chapter "9.7 Combining Evidence of Anthropogenic Climate Change Archived 11 November 2018 at the Wayback Machine"
- "EPA's Endangerment Finding Climate Change Facts". National Service Center for Environmental Publications (NSCEP). 2009. Report ID: 430F09086. Retrieved 22 December 2017.
- Committee on the Science of Climate Change, US National Research Council (2001). "Summary". Climate Change Science: An Analysis of Some Key Questions. Washington, D.C., USA: National Academies Press. pp. 1–3. ISBN 0-309-07574-2. Archived from the original on 5 June 2011. Retrieved 20 May 2011.CS1 maint: uses authors parameter (link) "The IPCC's conclusion that most of the observed warming of the last 50 years is likely to have been due to the increase in greenhouse gas concentrations accurately reflects the current thinking of the scientific community on this issue" (page 3).
- US National Research Council (2008). Understanding and responding to climate change: Highlights of National Academies Reports, 2008 edition (PDF). 500 Fifth St. N.W., Washington, D.C. 20001: National Academy of Sciences. Archived from the original (PDF) on 13 December 2011. Retrieved 20 May 2011.CS1 maint: location (link)
- Cook & others 2013
- OPR n.d.
- Kevin E. Trenberth and John T. Fasullo (5 October 2016). "Insights into Earth's Energy Imbalance from Multiple Sources". Journal of Climate. 29 (20): 7495–7505. Bibcode:2016JCli...29.7495T. doi:10.1175/JCLI-D-16-0339.1.
- Le Treut et al., Chapter 1: Historical Overview of Climate Change Science, FAQ 1.1, What Factors Determine Earth's Climate?, in IPCC AR4 WG1 2007.
- Forster et al., Chapter 2: Changes in Atmospheric Constituents and Radiative Forcing, FAQ 2.1, How do Human Activities Contribute to Climate Change and How do They Compare with Natural Influences? in IPCC AR4 WG1 2007.
- IPCC, Summary for Policymakers, Human and Natural Drivers of Climate Change, Figure SPM.2, in IPCC AR4 WG1 2007.
- Committee on the Science of Climate Change, US National Research Council (2001). "2. Natural Climatic Variations". Climate Change Science: An Analysis of Some Key Questions. Washington, D.C., USA: National Academies Press. p. 8. ISBN 0-309-07574-2. Retrieved 20 May 2011.CS1 maint: uses authors parameter (link)
- Albritton et al., Technical Summary, Box 1: What drives changes in climate?, in IPCC TAR WG1 2001.
-

- Mitchell et al., Chapter 12: Detection of Climate Change and Attribution of Causes, Section 12.1.1: The Meaning of Detection and Attribution, in IPCC TAR WG1 2001.
- IPCC AR4 WG1 2007, chapter "TS.6 Robust Findings and Key Uncertainties Archived 2 November 2018 at the Wayback Machine"
- Quote from public-domain source: US Environmental Protection Agency (EPA) (28 June 2012). "Causes of Climate Change: The Greenhouse Effect causes the atmosphere to retain heat". EPA. Archived from the original on 8 March 2017. Retrieved 1 July 2013.
- See also: 2.1 Greenhouse Gas Emissions and Concentrations, 2. Validity of Observed and Measured Data, retrieved 1 July 2013, in EPA 2009
- Le Treut, H.; et al., "1.3.1 The Human Fingerprint on Greenhouse Gases", Historical Overview of Climate Change Science, in IPCC AR4 WG1 2007.
- Rosane, Olivia (13 May 2019). "CO2 Levels Top 415 PPM for First Time in Human History". Ecowatch. Retrieved 14 May 2019.
- "The Kyoto Protocol". UNFCCC.
- see Stern (2006) for more details: 7. Projecting the Growth of Greenhouse-Gas Emissions (PDF), pp. 171–4, archived from the original (PDF) on 4 November 2012, in Stern 2006
- Schmidt, Gavin A. (6 April 2005). "Water vapour: feedback or forcing?". RealClimate. Retrieved 7 April 2008.
- Solomon, S.; et al., "TS.2.1.1 Changes in Atmospheric Carbon Dioxide, Methane and Nitrous Oxide", Technical Summary, in IPCC AR4 WG1 2007.
- Solomon, S.; et al., Technical Summary, in IPCC AR4 WG1 2007.
- Cimons, Marlene (9 August 2019). "Elephants and Monkeys Are Working to Protect You From Climate Change". Ecowatch. Retrieved 11 August 2019.
- Food and Agriculture Organization of the United Nations. Henning Steinfeld .... (2006). Livestock's Long Shadow (PDF). Food and Agricultural Organization of the U.N. ISBN 9251055718. Archived from the original (PDF) on 25 June 2008.CS1 maint: uses authors parameter (link)
- ?? in IPCC AR4 WG1 2007.
- Geerts, B. "Aerosols and Climate".
- "CO2 is making Earth greener—for now". NASA. Retrieved 28 February 2020.
- UCAR FAQ: How much has global temp. risen over the past 100 years?
- IPCC, Summary for Policymakers. in IPCC TAR WG1 2001.
- Solomon et al., Technical Summary, p. ?. in IPCC AR4 WG1 2007.
- In the IPCC Fourth Assessment Report, the following scale is used to quantify uncertainty: "virtually certain" >99%; "extremely likely" >95%; "very likely" >90%; "likely" >66%; "more likely than not" >50%; "about as likely as not" 33 to 66%; "unlikely" <33%; "very unlikely" <10%; "extremely unlikely" <5%; "exceptionally unlikely" <1%. Solomon, S.; et al., "Box TS.1: Treatment of Uncertainties in the Working Group I Assessment", Technical Summary, in IPCC AR4 WG1 2007.
- Hegerl et al., Chapter 9: Understanding and Attributing Climate Change, Executive Summary, in IPCC AR4 WG1 2007.
- Solomon, S.; et al., "TS.6.1 Changes in Human and Natural Drivers of Climate", Technical Summary, in IPCC AR4 WG1 2007.
- Mitchell et al., Chapter 12: Detection of Climate Change and Attribution of Causes Section 12.4.3, Optimal Fingerprint Methods, in IPCC TAR WG1 2001.
- Figure 4, Simulated annual global mean surface temperatures, in IPCC TAR WG1 2001.
- Karl & others 2009, page 19.
- Schneider, S., Climate Science, Stephen H. Schneider, Stanford University, It is likely that human activities have caused a discernible impact on observed warming trends, retrieved 28 September 2012
- Karl & others 2009, page 20.
- Karl & others 2009, page 21.
- Karl & others 2009, page 22.
- Hansen, J.; et al. (July 2012), The New Climate Dice: Public Perception of Climate Change (PDF), New York City: Dr James E. Hansen, Columbia University, pp. 3–4
- Seneviratne, S.I.; et al., Ch 3. Changes in Climate Extremes and their Impacts on the Natural Physical Environment: FAQ 3.2. Has Climate Change Affected Individual Extreme Events? (PDF), archived from the original (PDF) on 15 February 2013, retrieved 8 March 2013, in IPCC SREX 2012, p. 127.
- Seneviratne, S.I.; et al., Ch 3. Changes in Climate Extremes and their Impacts on the Natural Physical Environment: Executive summary (PDF), archived from the original (PDF) on 15 February 2013, retrieved 8 March 2013, in IPCC SREX 2012, p. 112.
- Stott, P.A.; et al. (2004), "Human contribution to the European heatwave of 2003", Nature, 432 (7017): 610–614, Bibcode:2004Natur.432..610S, doi:10.1038/nature03089, PMID 15577907
- Stott, P.A.; et al. (July 2012), Peterson, T.C.; et al. (eds.), "Introduction. In: Explaining Extreme Events of 2011 from a Climate Perspective" (PDF), Bull. Amer. Meteorol. Soc, 93 (7), pp. 1041–1067, Bibcode:2012BAMS...93.1041P, doi:10.1175/BAMS-D-12-00021.1, 1042
- Hansen & others 2012, p. 1
- Discussion, in Hansen & others 2012, pp. 6–7
- Dole, R.; et al. (March 2011), "Was there a basis for anticipating the 2010 Russian heat wave?" (PDF), Geophysical Research Letters, 38 (6): n/a, Bibcode:2011GeoRL..38.6702D, doi:10.1029/2010GL046582
- IPCC, "Understanding and Attributing Climate Change", Summary for Policymakers, in IPCC AR4 WG1 2007.
- Committee on Surface Temperature Reconstructions for the Last 2,000 Years, US National Research Council (2006). "Overview". Surface Temperature Reconstructions for the Last 2,000 Years. Washington, D.C., USA: National Academies Press. pp. 21–22. ISBN 0-309-66144-7. Retrieved 20 May 2011.CS1 maint: uses authors parameter (link)
- Panel on Advancing the Science of Climate Change; US National Research Council (2010). "Summary". Advancing the Science of Climate Change. Washington, D.C., USA: National Academies Press. p. 3. ISBN 978-0-309-14588-6. Retrieved 20 May 2011.CS1 maint: uses authors parameter (link)
- Karl & others 2009, Executive Summary, p. 12.
- "Joint science academies' statement: Global response to climate change". UK Royal Society website. 7 June 2005. Retrieved 20 May 2011.
- "Joint statement by NASAC to the G8 on sustainability, energy efficiency and climate change". UK Royal Society website. 1 June 2007. Retrieved 20 May 2011.
- "Climate.gov". NOAA. Global Climate Dashboard > Climate Variability. Retrieved 22 December 2017.
- Tett SFB; et al. (2002). "Estimation of natural and anthropogenic contributions to twentieth century temperature change". J. Geophys. Res. 107 (D16): 4306. Bibcode:2002JGRD..107.4306T. doi:10.1029/2000JD000028.
- William Connolley (27 May 2003). "Estimation of natural and anthropogenic contributions to twentieth century temperature change". Newsgroup: sci.environment. Usenet: 3ed342eb@news.nwl.ac.uk. Retrieved 13 June 2012.
- Barnett, T. (May 2005). "Detecting and Attributing External Influences on the Climate System: A Review of Recent Advances" (PDF). Journal of Climate. 18 (9): 1291–1314. Bibcode:2005JCli...18.1291.. doi:10.1175/JCLI3329.1.
- Barnett TP, Pierce DW, Achutarao KM, et al. (July 2005). "Penetration of human-induced warming into the world's oceans". Science. 309 (5732): 284–7. Bibcode:2005Sci...309..284B. doi:10.1126/science.1112418. PMID 15933161. S2CID 5641405.
- Schmidt, Gavin A. (11 August 2007). "Et Tu LT?". RealClimate.org.
- Schmidt, Gavin A. (11 August 2007). "The tropical lapse rate quandary". RealClimate.org.
-
Wigley, Tom M. L. (2 May 2006). "Temperature Trends in the Lower Atmosphere — Understanding and Reconciling Differences (Executive Summary)" (PDF). NOAA. Archived from the original (PDF) on 23 April 2007. Cite journal requires
|journal=(help) - Oreskes N (December 2004). "Beyond the ivory tower. The scientific consensus on climate change" (PDF). Science. 306 (5702): 1686. doi:10.1126/science.1103618. PMID 15576594.
- Anderegg, W.R.L.; et al. (6 July 2010). "Expert credibility in climate change". Proceedings of the National Academy of Sciences. 107 (27): 12107–12109. Bibcode:2010PNAS..10712107A. doi:10.1073/pnas.1003187107. PMC 2901439. PMID 20566872. Referred to by: Wihbey, J. (3 July 2012). "Expert Credibility in Climate Change". Journalist's Resource: Research for Reporting. A project of the Harvard Kennedy School's Shorenstein Center and the Carnegie-Knight Initiative.
- Farnsworth, S. J. (2011). "The Structure of Scientific Opinion on Climate Change". International Journal of Public Opinion Research. 24: 93–103. doi:10.1093/ijpor/edr033. Referred to by: Wihbey, J. (4 November 2011). "Structure of Scientific Opinion on Climate Change". Journalist's Resource: Research for Reporting. A project of the Harvard Kennedy School's Shorenstein Center and the Carnegie-Knight Initiative.
- Lindzen RS (August 1997). "Can increasing carbon dioxide cause climate change?". Proceedings of the National Academy of Sciences of the United States of America. 94 (16): 8335–42. Bibcode:1997PNAS...94.8335L. doi:10.1073/pnas.94.16.8335. PMC 33750. PMID 11607742.
- for example: Soon, W.; Posmentier, E.; Baliunas, S. (2000). "Climate hypersensitivity to solar forcing?". Annales Geophysicae. 18 (5): 583–588. Bibcode:2000AnGeo..18..583S. CiteSeerX 10.1.1.353.2743. doi:10.1007/s00585-000-0583-z.
- Global Climate Change, in Karl & others 2009, pp. 15–16.
- Hegerl, et al., Chapter 9: Understanding and Attributing Climate Change, Frequently Asked Question 9.2: Can the Warming of the 20th century be Explained by Natural Variability?, in IPCC AR4 WG1 2007.
- Hegerl, et al., Chapter 9: Understanding and Attributing Climate Change, Executive Summary, in IPCC AR4 WG1 2007.
- Simmon, R. & D. Herring (November 2009). "Notes for slide number 5 titled "Over 100 years of total solar irradiance data," in presentation, "Human contributions to global climate change"". Presentation library on the U.S. National Oceanic and Atmospheric Administration's Climate Services website. Archived from the original on 3 July 2011. Retrieved 23 June 2011.
- Committee on Surface Temperature Reconstructions for the Last 2,000 Years, US National Research Council (2006). "10. Climate Forcings and Climate Models". Surface Temperature Reconstructions for the Last 2,000 Years. Washington, D.C., USA: National Academies Press. p. 109. ISBN 0-309-66144-7. Retrieved 23 June 2011.CS1 maint: uses authors parameter (link)
- Simmon, R. & D. Herring (November 2009). "Notes for slide number 7, titled "Satellite evidence also suggests greenhouse gas warming," in presentation, "Human contributions to global climate change"". Presentation library on the U.S. National Oceanic and Atmospheric Administration's Climate Services website. Archived from the original on 3 July 2011. Retrieved 23 June 2011.
- Hegerl et al., Chapter 9: Understanding and Attributing Climate Change, Frequently Asked Question 9.2: Can the Warming of the 20th century be Explained by Natural Variability?, in IPCC AR4 WG1 2007.
- Karl & others 2009, p. 20.
- Celeste M. Johanson & Qiang Fu (2009). "Hadley Cell Widening: Model Simulations versus Observations" (PDF). Journal of Climate. 22 (10): 2713–25. Bibcode:2009JCli...22.2713J. doi:10.1175/2008JCLI2620.1.
- Abdussamatov, Habibullo I. (June 2004). "About the long-term coordinated variations of the activity, radius, total irradiance of the Sun and the Earth's climate". Proceedings of the International Astronomical Union. 223: 541–542. doi:10.1017/S1743921304006775. "The main cause of climate change during the last millennia is the corresponding cyclic variation of the 80- and 200-year component of irradiance correlated with activity. That is why, the contemporary (climate change) is not anomalous but is ordinary secular global warming."
- Solomon, Lawrence (2 February 2007). "Look to Mars for the truth on global warming". National Post. Archived from the original on 6 March 2007. Retrieved 2 March 2007.
- Ravilious, Kate (28 February 2007). "Mars Melt Hints at Solar, Not Human, Cause for Warming, Scientist Says". National Geographic News.
- Than, Ker (12 March 2007). "Sun Blamed for Warming of Earth and Other Worlds". LiveScience.com.
- See also: Fenton, Lori K.; Geissler, Paul E.; Haberle, Robert M. (5 April 2007). "Global warming and climate forcing by recent of albedo changes on Mars" (PDF). Nature. 446 (7136): 646–649. Bibcode:2007Natur.446..646F. doi:10.1038/nature05718. PMID 17410170. Archived from the original (PDF) on 8 July 2007. Retrieved 9 May 2007.
- See also: "MIT researcher finds evidence of global warming on Neptune's largest moon". MIT. 24 June 1998.
- See also: Goudarzi, Sara (4 May 2006). "New Storm on Jupiter Hints at Climate Change". Space.com.
- See also: "Pluto is undergoing global warming, researchers find". MIT. 9 October 2002.
- US Environmental Protection Agency (2009). "3.2.2 Solar Irradiance". Volume 3: Attribution of Observed Climate Change. Endangerment and Cause or Contribute Findings for Greenhouse Gases under Section 202(a) of the Clean Air Act. EPA's Response to Public Comments. US Environmental Protection Agency. Archived from the original on 16 June 2011. Retrieved 23 June 2011.
- IPCC, Summary for Policymakers, Human and Natural Drivers of Climate Change, in IPCC AR4 WG1 2007.
- Marsh, Nigel; Henrik, Svensmark (November 2000). "Cosmic Rays, Clouds, and Climate" (PDF). Space Science Reviews. 94 (1–2): 215–230. doi:10.1023/A:1026723423896. Archived from the original (PDF) on 1 February 2014. Retrieved 17 April 2007.
- "The earth's magnetic field impacts climate: Danish study". SpaceDaily.com. 12 January 2009. Retrieved 5 January 2013.
- EPA's Response to Public Comments, 3: Attribution of Observed Climate Change, Response 3–36, in Sec 3.2.2 Solar Irradiance, in EPA 2009
- Solomon, S.; et al., "TS.2.4 Radiative Forcing Due to Solar Activity and Volcanic Eruptions", Technical Summary, in IPCC AR4 WG1 2007, p. 31
- Lockwood, Mike; Claus Fröhlich (2007). "Recent oppositely directed trends in solar climate forcings and the global mean surface air temperature" (PDF). Proceedings of the Royal Society A. 463 (2086): 2447–2460. Bibcode:2007RSPSA.463.2447L. doi:10.1098/rspa.2007.1880. Archived from the original (PDF) on 26 September 2007. Retrieved 21 July 2007.
Our results show that the observed rapid rise in global mean temperatures seen after 1985 cannot be ascribed to solar variability, whichever of the mechanisms is invoked and no matter how much the solar variation is amplified
- T Sloan & A W Wolfendale (2008). "Testing the proposed causal link between cosmic rays and cloud cover". Environ. Res. Lett. 3 (2): 024001. arXiv:0803.2298. Bibcode:2008ERL.....3d4001S. doi:10.1088/1748-9326/3/2/024001.
- Abstract, in Pierce & Adams 2009
- paragraph 18, in: 6. Discussion, in Pierce & Adams 2009, p. 5
- Erlykin & others 2009
- Carslaw 2009
- Pittock 2009
- Duplissy & others 2009
References
- Carslaw, K. (16 July 2009), "Atmospheric physics: Cosmic rays, clouds, and climate", Nature, 460 (7253): 332–333, Bibcode:2009Natur.460..332C, doi:10.1038/460332a, PMID 19606133, pp. 332–333. Referred to by EPA 2009: EPA's Response to Public Comments, 3: Attribution of Observed Climate Change, Response 3-36, in Sec 3.2.2 Solar Irradiance
- Cook, J.; et al. (2013), "Quantifying the consensus on anthropogenic global warming in the scientific literature", Environmental Research Letters, 8 (2): 024024, Bibcode:2013ERL.....8b4024C, doi:10.1088/1748-9326/8/2/024024. Open-access article.
- Duplissy, J.; et al. (2 September 2009), "Results from the CERN pilot CLOUD experiment", Atmos. Chem. Phys. Discuss., 9 (18235): 18235–18270, doi:10.5194/acpd-9-18235-2009, hdl:10138/162406, pp. 18235–18270. Referred to by EPA 2009: EPA's Response to Public Comments, 3: Attribution of Observed Climate Change, Response 3–36, in Sec 3.2.2 Solar Irradiance
- Erlykin, A.D.; et al. (June 2009), "The search for cosmic ray effects on clouds", Journal of Atmospheric and Solar-Terrestrial Physics, 71 (8–9): 955–958, Bibcode:2009JASTP..71..955E, doi:10.1016/j.jastp.2009.03.019, pp. 955–958. Referred to by EPA 2009: EPA's Response to Public Comments, 3: Attribution of Observed Climate Change, Response 3-36, in Sec 3.2.2 Solar Irradiance
- James Hansen; Makiko Sato; Reto Ruedy (August 2012), "Perception of climate change", Proceedings of the National Academy of Sciences of the United States of America, National Academy of Sciences, 109 (32): E2415–E2423, Bibcode:2012PNAS..109E2415H, doi:10.1073/pnas.1205276109, PMC 3443154, PMID 22869707
- Houghton, J. (2002), "An Overview of the Intergovernmental Panel on Climate Change (IPCC) and Its Process of Science Assessment", in Hester, R.E.; Harrison, R.M. (eds.), Issues in Environmental Science and Technology (PDF), Global Environmental Change, 17, The Royal Society of Chemistry, ISBN 978-0-85404-280-7.
- IPCC SAR WG1 (1996), Houghton, J.T.; Meira Filho, L.G.; Callander, B.A.; Harris, N.; Kattenberg, A.; Maskell, K. (eds.), Climate Change 1995: The Science of Climate Change, Contribution of Working Group I to the Second Assessment Report of the Intergovernmental Panel on Climate Change, Cambridge University Press, ISBN 0-521-56433-6 (pb: 0-521-56436-0).
- IPCC TAR WG1 (2001), Houghton, J.T.; Ding, Y.; Griggs, D.J.; Noguer, M.; van der Linden, P.J.; Dai, X.; Maskell, K.; Johnson, C.A. (eds.), Climate Change 2001: The Scientific Basis, Contribution of Working Group I to the Third Assessment Report of the Intergovernmental Panel on Climate Change, Cambridge University Press, ISBN 0-521-80767-0, archived from the original on 15 December 2019, retrieved 18 December 2019 (pb: 0-521-01495-6).
- IPCC AR4 WG1 (2007), Solomon, S.; Qin, D.; Manning, M.; Chen, Z.; Marquis, M.; Averyt, K.B.; Tignor, M.; Miller, H.L. (eds.), Climate Change 2007: The Physical Science Basis, Contribution of Working Group I to the Fourth Assessment Report of the Intergovernmental Panel on Climate Change, Cambridge University Press, ISBN 978-0-521-88009-1 (pb: 978-0-521-70596-7).
- IPCC SREX (2012), Field, C.B.; et al. (eds.), Managing the Risks of Extreme Events and Disasters to Advance Climate Change Adaptation (SREX), Cambridge University Press, archived from the original on 19 December 2012. Summary for Policymakers available in Arabic, Chinese, French, Russian, and Spanish.
- IPCC AR5 WG1 (2013), Stocker, T.F.; et al. (eds.), Climate Change 2013: The Physical Science Basis. Working Group 1 (WG1) Contribution to the Intergovernmental Panel on Climate Change (IPCC) 5th Assessment Report (AR5), Cambridge University PressCS1 maint: ref=harv (link). Climate Change 2013 Working Group 1 website.
- OPR (n.d.), Office of Planning and Research (OPR) List of Organizations, OPR, Office of the Governor, State of California, archived from the original on 1 April 2014, retrieved 30 November 2013CS1 maint: ref=harv (link) CS1 maint: BOT: original-url status unknown (link). Archived page: The source appears to incorrectly list the Society of Biology (UK) twice.
- Pierce J.R. & P.J. Adams (May 2009), "Can cosmic rays affect cloud condensation nuclei by altering new particle formation rates?", Geophys. Res. Lett., 36 (9): L09820, Bibcode:2009GeoRL..36.9820P, doi:10.1029/2009GL037946, S2CID 15704833. L09820.
- Pittock, B. (October 2009), "Can solar variations explain variations in the Earth's climate? An editorial comment", Climatic Change, 96 (4): 483–487, doi:10.1007/s10584-009-9645-8, pp. 483–487. Referred to by EPA 2009: EPA's Response to Public Comments, 3: Attribution of Observed Climate Change, Response 3-36, in Sec 3.2.2 Solar Irradiance
- Stern, N. (2006), Stern Review Report on the Economics of Climate Change (pre-publication edition), London, UK: HM Treasury, archived from the original on 7 April 2010
Public-domain sources
External links
- How much of the recent CO2 increase is due to human activities? (RealClimate, 2005)
- Climate change and global warming (U.S. EPA)
| |||||||||||||
| |||||||||||||
| |||||||||||||
| |||||||||||||
| |||||||||||||
| |||||||||||||
| |||||||||||||