Tropical cyclone
A tropical cyclone is a rapidly rotating storm system characterized by a low-pressure center, a closed low-level atmospheric circulation, strong winds, and a spiral arrangement of thunderstorms that produce heavy rain or squalls. Depending on its location and strength, a tropical cyclone is referred to by different names, including hurricane (/ˈhʌrɪkən, -keɪn/),[1][2][3] typhoon (/taɪˈfuːn/), tropical storm, cyclonic storm, tropical depression, and simply cyclone.[4] A hurricane is a tropical cyclone that occurs in the Atlantic Ocean and northeastern Pacific Ocean, and a typhoon occurs in the northwestern Pacific Ocean; in the south Pacific or Indian Ocean, comparable storms are referred to simply as "tropical cyclones" or "severe cyclonic storms".[4]
| Part of a series on |
| Weather |
|---|
|
|
"Tropical" refers to the geographical origin of these systems, which form almost exclusively over tropical seas. "Cyclone" refers to their winds moving in a circle,[5] whirling round their central clear eye, with their winds blowing counterclockwise in the Northern Hemisphere and clockwise in the Southern Hemisphere. The opposite direction of circulation is due to the Coriolis effect. Tropical cyclones typically form over large bodies of relatively warm water. They derive their energy through the evaporation of water from the ocean surface, which ultimately recondenses into clouds and rain when moist air rises and cools to saturation. This energy source differs from that of mid-latitude cyclonic storms, such as nor'easters and European windstorms, which are fueled primarily by horizontal temperature contrasts. Tropical cyclones are typically between 100 and 2,000 km (62 and 1,243 mi) in diameter.
The strong rotating winds of a tropical cyclone are a result of the conservation of angular momentum imparted by the Earth's rotation as air flows inwards toward the axis of rotation. As a result, they rarely form within 5° of the equator.[6] Tropical cyclones are almost unknown in the South Atlantic due to a consistently strong wind shear and a weak Intertropical Convergence Zone.[7] Conversely, the African easterly jet and areas of atmospheric instability give rise to cyclones in the Atlantic Ocean and Caribbean Sea, while cyclones near Australia owe their genesis to the Asian monsoon and Western Pacific Warm Pool.
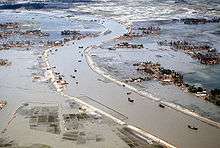
Coastal regions are particularly vulnerable to the impact of a tropical cyclone, compared to inland regions. The primary energy source for these storms is warm ocean waters. These storms are therefore typically strongest when over or near water, and weaken quite rapidly over land. Coastal damage may be caused by strong winds and rain, high waves (due to winds), storm surges (due to wind and severe pressure changes), and the potential of spawning tornadoes. Tropical cyclones also draw in air from a large area—which can be a vast area for the most severe cyclones—and concentrate that air's water content (made up from atmospheric moisture and moisture evaporated from water) into precipitation over a much smaller area. This continual replacement of moisture-bearing air by new moisture-bearing air after its moisture has fallen as rain, may cause multi-hour or multi-day extremely heavy rain up to 40 kilometers (25 mi) from the coastline, far beyond the amount of water that the local atmosphere holds at any one time. This in turn can lead to river flooding, overland flooding, and a general overwhelming of local man-made water control structures across a large area.
Though their effects on human populations are often devastating, tropical cyclones can relieve drought conditions. They also carry heat energy away from the tropics and transport it toward temperate latitudes, which may play an important role in modulating regional and global climate.
| Part of a series on |
| Tropical cyclones |
|---|
|
Structure |
|
Climatology and tracking |
|
|
Outline of tropical cyclones |
Physical structure
Tropical cyclones are areas of relatively low pressure in the troposphere, with the largest pressure perturbations occurring at low altitudes near the surface. On Earth, the pressures recorded at the centers of tropical cyclones are among the lowest ever observed at sea level.[8] The environment near the center of tropical cyclones is warmer than the surroundings at all altitudes, thus they are characterized as "warm core" systems.[9]
Wind field
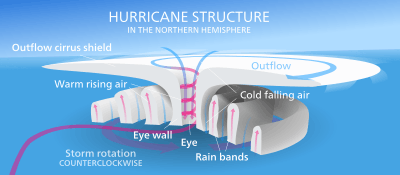
The near-surface wind field of a tropical cyclone is characterized by air rotating rapidly around a center of circulation while also flowing radially inwards. At the outer edge of the storm, air may be nearly calm; however, due to the Earth's rotation, the air has non-zero absolute angular momentum. As air flows radially inward, it begins to rotate cyclonically (counter-clockwise in the Northern Hemisphere, and clockwise in the Southern Hemisphere) to conserve angular momentum. At an inner radius, air begins to ascend to the top of the troposphere. This radius is typically coincident with the inner radius of the eyewall, and has the strongest near-surface winds of the storm; consequently, it is known as the radius of maximum winds.[10] Once aloft, air flows away from the storm's center, producing a shield of cirrus clouds.[11]
The previously mentioned processes result in a nearly axisymmetric wind field: Wind speeds are low at the center, increase rapidly moving outwards to the radius of maximum winds, and then decay more gradually with radius to large radii. However, the wind field often exhibits additional spatial and temporal variability due to the effects of localized processes, such as thunderstorm activity and horizontal flow instabilities. In the vertical direction, winds are strongest near the surface and decay with height within the troposphere.[12]
Eye and center
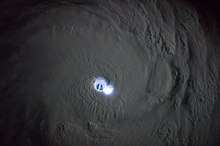
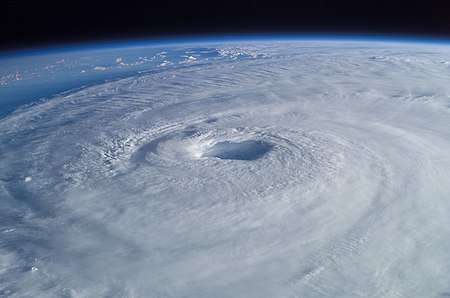
At the center of a mature tropical cyclone, air sinks rather than rises. For a sufficiently strong storm, air may sink over a layer deep enough to suppress cloud formation, thereby creating a clear "eye". Weather in the eye is normally calm and free of clouds, although the sea may be extremely violent.[13] The eye is normally circular and is typically 30–65 km (19–40 mi) in diameter, though eyes as small as 3 km (1.9 mi) and as large as 370 km (230 mi) have been observed.[14][15]
The cloudy outer edge of the eye is called the "eyewall". The eyewall typically expands outward with height, resembling an arena football stadium; this phenomenon is sometimes referred to as the "stadium effect".[15] The eyewall is where the greatest wind speeds are found, air rises most rapidly, clouds reach their highest altitude, and precipitation is the heaviest. The heaviest wind damage occurs where a tropical cyclone's eyewall passes over land.[13]
In a weaker storm, the eye may be obscured by the central dense overcast, which is the upper-level cirrus shield that is associated with a concentrated area of strong thunderstorm activity near the center of a tropical cyclone.[16]
The eyewall may vary over time in the form of eyewall replacement cycles, particularly in intense tropical cyclones. Outer rainbands can organize into an outer ring of thunderstorms that slowly moves inward, which is believed to rob the primary eyewall of moisture and angular momentum. When the primary eyewall weakens, the tropical cyclone weakens temporarily. The outer eyewall eventually replaces the primary one at the end of the cycle, at which time the storm may return to its original intensity.[17]
Rapid intensification
On occasion, tropical cyclones may undergo a process known as rapid intensification, a period in which the maximum sustained winds of a tropical cyclone increase by 30 knots within 24 hours.[18] For rapid intensification to occur, several conditions must be in place. Water temperatures must be extremely high (near or above 30 °C, 86 °F), and water of this temperature must be sufficiently deep such that waves do not up well cooler waters to the surface. Wind shear must be low; when wind shear is high, the convection and circulation in the cyclone will be disrupted. Usually, an anticyclone in the upper layers of the troposphere above the storm must be present as well—for extremely low surface pressures to develop, air must be rising very rapidly in the eyewall of the storm, and an upper-level anticyclone helps channel this air away from the cyclone efficiently.[19]
Size
| Size descriptions of tropical cyclones | |
|---|---|
| ROCI (Diameter) | Type |
| Less than 2 degrees latitude | Very small/minor |
| 2 to 3 degrees of latitude | Small |
| 3 to 6 degrees of latitude | Medium/Average/Normal |
| 6 to 8 degrees of latitude | Large |
| Over 8 degrees of latitude | Very large[20] |
There are a variety of metrics commonly used to measure storm size. The most common metrics include the radius of maximum wind, the radius of 34-knot wind (i.e. gale force), the radius of outermost closed isobar (ROCI), and the radius of vanishing wind.[21][22] An additional metric is the radius at which the cyclone's relative vorticity field decreases to 1×10⁻⁵ s−1.[15]
On Earth, tropical cyclones span a large range of sizes, from 100–2,000 kilometres (62–1,243 mi) as measured by the radius of vanishing wind. They are largest on average in the northwest Pacific Ocean basin and smallest in the northeastern Pacific Ocean basin.[23] If the radius of outermost closed isobar is less than two degrees of latitude (222 km (138 mi)), then the cyclone is "very small" or a "midget". A radius of 3–6 latitude degrees (333–670 km (207–416 mi)) is considered "average sized". "Very large" tropical cyclones have a radius of greater than 8 degrees (888 km (552 mi)).[20] Observations indicate that size is only weakly correlated to variables such as storm intensity (i.e. maximum wind speed), radius of maximum wind, latitude, and maximum potential intensity.[22][23]
Size plays an important role in modulating damage caused by a storm. All else equal, a larger storm will impact a larger area for a longer period of time. Additionally, a larger near-surface wind field can generate higher storm surge due to the combination of longer wind fetch, longer duration, and enhanced wave setup.[24]
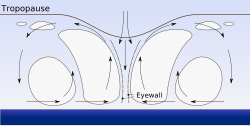
The upper circulation of strong hurricanes extends into the tropopause of the atmosphere, which at low latitudes is 15,000–18,000 metres (50,000–60,000 ft).[25]
Physics and energetics
The three-dimensional wind field in a tropical cyclone can be separated into two components: a "primary circulation" and a "secondary circulation". The primary circulation is the rotational part of the flow; it is purely circular. The secondary circulation is the overturning (in-up-out-down) part of the flow; it is in the radial and vertical directions. The primary circulation is larger in magnitude, dominating the surface wind field, and is responsible for the majority of the damage a storm causes, while the secondary circulation is slower but governs the energetics of the storm.
Secondary circulation: a Carnot heat engine
A tropical cyclone's primary energy source is heat from the evaporation of water from the surface of a warm ocean, previously heated by sunshine. The energetics of the system may be idealized as an atmospheric Carnot heat engine.[27] First, inflowing air near the surface acquires heat primarily via evaporation of water (i.e. latent heat) at the temperature of the warm ocean surface (during evaporation, the ocean cools and the air warms). Second, the warmed air rises and cools within the eyewall while conserving total heat content (latent heat is simply converted to sensible heat during condensation). Third, air outflows and loses heat via infrared radiation to space at the temperature of the cold tropopause. Finally, air subsides and warms at the outer edge of the storm while conserving total heat content. The first and third legs are nearly isothermal, while the second and fourth legs are nearly isentropic. This in-up-out-down overturning flow is known as the secondary circulation. The Carnot perspective provides an upper bound on the maximum wind speed that a storm can attain.
Scientists estimate that a tropical cyclone releases heat energy at the rate of 50 to 200 exajoules (1018 J) per day,[28] equivalent to about 1 PW (1015 watt). This rate of energy release is equivalent to 70 times the world energy consumption of humans and 200 times the worldwide electrical generating capacity, or to exploding a 10-megaton nuclear bomb every 20 minutes.[28][29]
Primary circulation: rotating winds
The primary rotating flow in a tropical cyclone results from the conservation of angular momentum by the secondary circulation. Absolute angular momentum on a rotating planet is given by


where is the Coriolis parameter, is the azimuthal (i.e. rotating) wind speed, and is the radius to the axis of rotation. The first term on the right hand side is the component of planetary angular momentum that projects onto the local vertical (i.e. the axis of rotation). The second term on the right hand side is the relative angular momentum of the circulation itself with respect to the axis of rotation. Because the planetary angular momentum term vanishes at the equator (where ), tropical cyclones rarely form within 5° of the equator.[6][30]


As air flows radially inward at low levels, it begins to rotate cyclonically in order to conserve angular momentum. Similarly, as rapidly rotating air flows radially outward near the tropopause, its cyclonic rotation decreases and ultimately changes sign at large enough radius, resulting in an upper-level anti-cyclone. The result is a vertical structure characterized by a strong cyclone at low levels and a strong anti-cyclone near the tropopause; from thermal wind balance, this corresponds to a system that is warmer at its center than in the surrounding environment at all altitudes (i.e. "warm-core"). From hydrostatic balance, the warm core translates to lower pressure at the center at all altitudes, with the maximum pressure drop located at the surface.[12]
Maximum potential intensity
Due to surface friction, the inflow only partially conserves angular momentum. Thus, the sea surface lower boundary acts as both a source (evaporation) and sink (friction) of energy for the system. This fact leads to the existence of a theoretical upper bound on the strongest wind speed that a tropical cyclone can attain. Because evaporation increases linearly with wind speed (just as climbing out of a pool feels much colder on a windy day), there is a positive feedback on energy input into the system known as the Wind-Induced Surface Heat Exchange (WISHE) feedback.[27] This feedback is offset when frictional dissipation, which increases with the cube of the wind speed, becomes sufficiently large. This upper bound is called the "maximum potential intensity", , and is given by


where is the temperature of the sea surface, is the temperature of the outflow ([K]), is the enthalpy difference between the surface and the overlying air ([J/kg]), and and are the surface exchange coefficients (dimensionless) of enthalpy and momentum, respectively.[31] The surface-air enthalpy difference is taken as , where is the saturation enthalpy of air at sea surface temperature and sea-level pressure and is the enthalpy of boundary layer air overlying the surface.


The maximum potential intensity is predominantly a function of the background environment alone (i.e. without a tropical cyclone), and thus this quantity can be used to determine which regions on Earth can support tropical cyclones of a given intensity, and how these regions may evolve in time.[32][33] Specifically, the maximum potential intensity has three components, but its variability in space and time is due predominantly to the variability in the surface-air enthalpy difference component .
Derivation
A tropical cyclone may be viewed as a heat engine that converts input heat energy from the surface into mechanical energy that can be used to do mechanical work against surface friction. At equilibrium, the rate of net energy production in the system must equal the rate of energy loss due to frictional dissipation at the surface, i.e.

The rate of energy loss per unit surface area from surface friction, , is given by


where is the density of near-surface air ([kg/m3]) and is the near surface wind speed ([m/s]).


The rate of energy production per unit surface area, is given by


where is the heat engine efficiency and is the total rate of heat input into the system per unit surface area. Given that a tropical cyclone may be idealized as a Carnot heat engine, the Carnot heat engine efficiency is given by


Heat (enthalpy) per unit mass is given by

where is the heat capacity of air, is air temperature, is the latent heat of vaporization, and is the concentration of water vapor. The first component corresponds to sensible heat and the second to latent heat.


There are two sources of heat input. The dominant source is the input of heat at the surface, primarily due to evaporation. The bulk aerodynamic formula for the rate of heat input per unit area at the surface, , is given by


where represents the enthalpy difference between the ocean surface and the overlying air. The second source is the internal sensible heat generated from frictional dissipation (equal to ), which occurs near the surface within the tropical cyclone and is recycled to the system.

Thus, the total rate of net energy production per unit surface area is given by

Setting and taking (i.e. the rotational wind speed is dominant) leads to the solution for given above. This derivation assumes that total energy input and loss within the system can be approximated by their values at the radius of maximum wind. The inclusion of acts to multiply the total heat input rate by the factor . Mathematically, this has the effect of replacing with in the denominator of the Carnot efficiency.


An alternative definition for the maximum potential intensity, which is mathematically equivalent to the above formulation, is

where CAPE stands for the Convective Available Potential Energy, is the CAPE of an air parcel lifted from saturation at sea level in reference to the environmental sounding, is the CAPE of the boundary layer air, and both quantities are calculated at the radius of maximum wind.[34]


Characteristic values and variability on Earth
On Earth, a characteristic temperature for is 300 K and for is 200 K, corresponding to a Carnot efficiency of . The ratio of the surface exchange coefficients, , is typically taken to be 1. However, observations suggest that the drag coefficient varies with wind speed and may decrease at high wind speeds within the boundary layer of a mature hurricane.[35] Additionally, may vary at high wind speeds due to the effect of sea spray on evaporation within the boundary layer.[36]


A characteristic value of the maximum potential intensity, , is 80 metres per second (180 mph; 290 km/h). However, this quantity varies significantly across space and time, particularly within the seasonal cycle, spanning a range of 0 to 100 metres per second (0 to 224 mph; 0 to 360 km/h).[34] This variability is primarily due to variability in the surface enthalpy disequilibrium ( ) as well as in the thermodynamic structure of the troposphere, which are controlled by the large-scale dynamics of the tropical climate. These processes are modulated by factors including the sea surface temperature (and underlying ocean dynamics), background near-surface wind speed, and the vertical structure of atmospheric radiative heating.[37] The nature of this modulation is complex, particularly on climate time-scales (decades or longer). On shorter time-scales, variability in the maximum potential intensity is commonly linked to sea surface temperature perturbations from the tropical mean, as regions with relatively warm water have thermodynamic states much more capable of sustaining a tropical cyclone than regions with relatively cold water.[38] However, this relationship is indirect via the large-scale dynamics of the tropics; the direct influence of the absolute sea surface temperature on is weak in comparison.
Interaction with the upper ocean
The passage of a tropical cyclone over the ocean causes the upper layers of the ocean to cool substantially, which can influence subsequent cyclone development. This cooling is primarily caused by wind-driven mixing of cold water from deeper in the ocean with the warm surface waters. This effect results in a negative feedback process that can inhibit further development or lead to weakening. Additional cooling may come in the form of cold water from falling raindrops (this is because the atmosphere is cooler at higher altitudes). Cloud cover may also play a role in cooling the ocean, by shielding the ocean surface from direct sunlight before and slightly after the storm passage. All these effects can combine to produce a dramatic drop in sea surface temperature over a large area in just a few days.[39] Conversely, the mixing of the sea can result in heat being inserted in deeper waters, with potential effects on global climate.[40]
Major basins and related warning centers
| Tropical cyclone basins and official warning centers | |||
|---|---|---|---|
| Basin | Warning center | Area of responsibility | Notes |
| Northern Hemisphere | |||
| North Atlantic Eastern Pacific | United States National Hurricane Center United States Central Pacific Hurricane Center | Equator northward, African Coast – 140°W Equator northward, 140–180°W | [41] |
| Western Pacific | Japan Meteorological Agency | Equator – 60°N, 180–100°E | [42] |
| North Indian Ocean | India Meteorological Department | Equator northward, 100–40°E | [43] |
| Southern Hemisphere | |||
| South-West Indian Ocean | Météo-France Reunion | Equator – 40°S, African Coast – 90°E | [44] |
| Australian region | Indonesian Agency for Meteorology, Climatology and Geophysics (BMKG) Papua New Guinea National Weather Service, Australian Bureau of Meteorology | Equator – 10°S, 90–141°E Equator – 10°S, 141–160°E 10–40°S, 90–160°E | [45] |
| Southern Pacific | Fiji Meteorological Service Meteorological Service of New Zealand | Equator – 25°S, 160°E – 120°W 25–40°S, 160°E – 120°W | [45] |
There are six Regional Specialized Meteorological Centres (RSMCs) worldwide. These organizations are designated by the World Meteorological Organization and are responsible for tracking and issuing bulletins, warnings, and advisories about tropical cyclones in their designated areas of responsibility. Also, there are six Tropical Cyclone Warning Centres (TCWCs) that provide information to smaller regions.[46]
The RSMCs and TCWCs are not the only organizations that provide information about tropical cyclones to the public. The Joint Typhoon Warning Center (JTWC) issues advisories in all basins except the Northern Atlantic for the United States Government.[47] The Philippine Atmospheric, Geophysical and Astronomical Services Administration (PAGASA) issues advisories and names for tropical cyclones that approach the Philippines in the Northwestern Pacific to protect the life and property of its citizens.[48] The Canadian Hurricane Center (CHC) issues advisories on hurricanes and their remnants for Canadian citizens when they affect Canada.[49]
On March 26, 2004, Hurricane Catarina became the first recorded South Atlantic cyclone, striking southern Brazil with winds equivalent to Category 2 on the Saffir-Simpson Hurricane Scale. As the cyclone formed outside the authority of another warning center, Brazilian meteorologists initially treated the system as an extratropical cyclone, but later on, classified it as tropical.[50]
Formation
Worldwide, tropical cyclone activity peaks in late summer, when the difference between temperatures aloft and sea surface temperatures is the greatest. However, each particular basin has its own seasonal patterns. On a worldwide scale, May is the least active month, while September is the most active month. November is the only month in which all the tropical cyclone basins are in season.[51]
Times
In the Northern Atlantic Ocean, a distinct cyclone season occurs from June 1 to November 30, sharply peaking from late August through September.[51] The statistical peak of the Atlantic hurricane season is September 10. The Northeast Pacific Ocean has a broader period of activity, but in a similar time frame to the Atlantic.[52] The Northwest Pacific sees tropical cyclones year-round, with a minimum in February and March and a peak in early September.[51] In the North Indian basin, storms are most common from April to December, with peaks in May and November.[51] In the Southern Hemisphere, the tropical cyclone year begins on July 1 and runs all year-round encompassing the tropical cyclone seasons, which run from November 1 until the end of April, with peaks in mid-February to early March.[51][45]
| Season lengths and averages | |||||
|---|---|---|---|---|---|
| Basin | Season start | Season end | Tropical cyclones | Refs | |
| North Atlantic | June 1 | November 30 | 12.1 | [53] | |
| Eastern Pacific | May 15 | November 30 | 16.6 | [53] | |
| Western Pacific | January 1 | December 31 | 26.0 | [53] | |
| North Indian | January 1 | December 31 | 12 | [54] | |
| South-West Indian | July 1 | June 30 | 9.3 | [53][44] | |
| Australian region | November 1 | April 30 | 11.0 | [55] | |
| Southern Pacific | November 1 | April 30 | 7.1 | [56] | |
| Total: | 94.1 | ||||
Factors
The formation of tropical cyclones is the topic of extensive ongoing research and is still not fully understood.[57] While six factors appear to be generally necessary, tropical cyclones may occasionally form without meeting all of the following conditions. In most situations, water temperatures of at least 26.5 °C (79.7 °F) are needed down to a depth of at least 50 m (160 ft);[58] waters of this temperature cause the overlying atmosphere to be unstable enough to sustain convection and thunderstorms.[59] For tropical transitioning cyclones (i.e. Hurricane Ophelia (2017)) a water temperature of at least 22.5 °C (72.5 °F) has been suggested.[60]
Another factor is rapid cooling with height, which allows the release of the heat of condensation that powers a tropical cyclone.[58] High humidity is needed, especially in the lower-to-mid troposphere; when there is a great deal of moisture in the atmosphere, conditions are more favorable for disturbances to develop.[58] Low amounts of wind shear are needed, as high shear is disruptive to the storm's circulation.[58] Tropical cyclones generally need to form more than 555 km (345 mi) or five degrees of latitude away from the equator, allowing the Coriolis effect to deflect winds blowing towards the low pressure center and creating a circulation.[58] Lastly, a formative tropical cyclone needs a preexisting system of disturbed weather. Tropical cyclones will not form spontaneously.[58] Low-latitude and low-level westerly wind bursts associated with the Madden–Julian oscillation can create favorable conditions for tropical cyclogenesis by initiating tropical disturbances.[61]
Locations
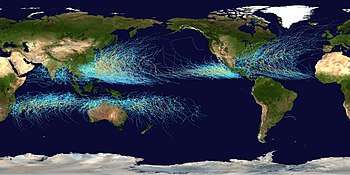
Most tropical cyclones form in a worldwide band of thunderstorm activity near the equator, referred to as the Intertropical Front (ITF), the Intertropical Convergence Zone (ITCZ), or the monsoon trough.[62][63][64] Another important source of atmospheric instability is found in tropical waves, which contribute to the development of about 85% of intense tropical cyclones in the Atlantic Ocean and become most of the tropical cyclones in the Eastern Pacific.[65][66][67] The majority forms between 10 and 30 degrees of latitude away of the equator,[68] and 87% forms no farther away than 20 degrees north or south.[69][70] Because the Coriolis effect initiates and maintains their rotation, tropical cyclones rarely form or move within 5 degrees of the equator, where the effect is weakest.[69] However, it is still possible for tropical systems to form within this boundary as Tropical Storm Vamei and Cyclone Agni did in 2001 and 2004, respectively.[71][72]
Movement
The movement of a tropical cyclone (i.e. its "track") is typically approximated as the sum of two terms: "steering" by the background environmental wind and "beta drift".[73]
Environmental steering
Environmental steering is the dominant term. Conceptually, it represents the movement of the storm due to prevailing winds and other wider environmental conditions, similar to "leaves carried along by a stream".[74] Physically, the winds, or flow field, in the vicinity of a tropical cyclone may be treated as having two parts: the flow associated with the storm itself, and the large-scale background flow of the environment in which the storm takes place. In this way, tropical cyclone motion may be represented to first-order simply as advection of the storm by the local environmental flow. This environmental flow is termed the "steering flow".
Climatologically, tropical cyclones are steered primarily westward by the east-to-west trade winds on the equatorial side of the subtropical ridge—a persistent high-pressure area over the world's subtropical oceans.[74] In the tropical North Atlantic and Northeast Pacific oceans, the trade winds steer tropical easterly waves westward from the African coast toward the Caribbean Sea, North America, and ultimately into the central Pacific Ocean before the waves dampen out.[66] These waves are the precursors to many tropical cyclones within this region.[65] In contrast, in the Indian Ocean and Western Pacific in both hemispheres, tropical cyclogenesis is influenced less by tropical easterly waves and more by the seasonal movement of the Inter-tropical Convergence Zone and the monsoon trough.[75] Additionally, tropical cyclone motion can be influenced by transient weather systems, such as extratropical cyclones.
Beta drift
In addition to environmental steering, a tropical cyclone will tend to drift slowly poleward and westward, a motion known as "beta drift". This motion is due to the superposition of a vortex, such as a tropical cyclone, onto an environment in which the Coriolis force varies with latitude, such as on a sphere or beta plane. It is induced indirectly by the storm itself, the result of a feedback between the cyclonic flow of the storm and its environment.
Physically, the cyclonic circulation of the storm advects environmental air poleward east of center and equatorial west of center. Because air must conserve its angular momentum, this flow configuration induces a cyclonic gyre equatorward and westward of the storm center and an anticyclonic gyre poleward and eastward of the storm center. The combined flow of these gyres acts to advect the storm slowly poleward and westward. This effect occurs even if there is zero environmental flow.
Multiple storm interaction
A third component of motion that occurs relatively infrequently involves the interaction of multiple tropical cyclones. When two cyclones approach one another, their centers will begin orbiting cyclonically about a point between the two systems. Depending on their separation distance and strength, the two vortices may simply orbit around one another or else may spiral into the center point and merge. When the two vortices are of unequal size, the larger vortex will tend to dominate the interaction, and the smaller vortex will orbit around it. This phenomenon is called the Fujiwhara effect, after Sakuhei Fujiwhara.[76]
Interaction with the mid-latitude westerlies
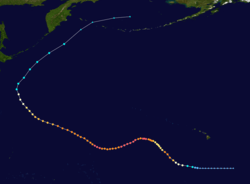
Though a tropical cyclone typically moves from east to west in the tropics, its track may shift poleward and eastward either as it moves west of the subtropical ridge axis or else if it interacts with the mid-latitude flow, such as the jet stream or an extratropical cyclone. This motion, termed "recurvature", commonly occurs near the western edge of the major ocean basins, where the jet stream typically has a poleward component and extratropical cyclones are common.[77] An example of tropical cyclone recurvature was Typhoon Ioke in 2006.[78]
Landfall
The landfall of a tropical cyclone occurs when a storm's surface center (eye if a stronger cyclone) moves over a coastline.[10] Storm conditions may be experienced on the coast and inland hours before landfall; in fact, a tropical cyclone can launch its strongest winds over land, yet not make landfall. NOAA uses the term "direct hit" to describe when a location (on the left side of the eye) falls within the radius of maximum winds (or twice that radius if on the right side), whether or not the hurricane's eye made landfall.[10]
Changes caused by El Niño–Southern Oscillation
Most tropical cyclones form on the side of the subtropical ridge closer to the equator, then move poleward past the ridge axis before recurving into the main belt of the Westerlies.[79] When the subtropical ridge position shifts due to El Niño, so will the preferred tropical cyclone tracks. Areas west of Japan and Korea tend to experience much fewer September–November tropical cyclone impacts during El Niño and neutral years. During El Niño years, the break in the subtropical ridge tends to lie near 130°E which would favor the Japanese archipelago.[80] During El Niño years, Guam's chance of a tropical cyclone impact is one-third more likely than of the long-term average.[81] The tropical Atlantic Ocean experiences depressed activity due to increased vertical wind shear across the region during El Niño years.[82] During La Niña years, the formation of tropical cyclones, along with the subtropical ridge position, shifts westward across the western Pacific Ocean, which increases the landfall threat to China and much greater intensity in the Philippines.[80]
Dissipation
Factors
A tropical cyclone can cease to have tropical characteristics in several different ways. One such way is if it moves over land, thus depriving it of the warm water it needs to power itself, quickly losing strength.[83] Most strong storms lose their strength very rapidly after landfall and become disorganized areas of low pressure within a day or two, or evolve into extratropical cyclones. There is a chance a tropical cyclone could regenerate if it managed to get back over open warm water, such as with Hurricane Ivan. If it remains over mountains for even a short time, weakening will accelerate.[84] Many storm fatalities occur in mountainous terrain, when diminishing cyclones unleash their moisture as torrential rainfall.[85] This rainfall may lead to deadly floods and mudslides, as was the case with Hurricane Mitch around Honduras in October 1998.[86] Without warm surface water, the storm cannot survive.[87]
A tropical cyclone can dissipate when it moves over waters significantly below 26.5 °C (79.7 °F). This will cause the storm to lose its tropical characteristics, such as a warm core with thunderstorms near the center, and become a remnant low-pressure area. These remnant systems may persist for up to several days before losing their identity. This dissipation mechanism is most common in the eastern North Pacific.[88] Weakening or dissipation can occur if it experiences vertical wind shear, causing the convection and heat engine to move away from the center; this normally ceases development of a tropical cyclone.[89] In addition, its interaction with the main belt of the Westerlies, by means of merging with a nearby frontal zone, can cause tropical cyclones to evolve into extratropical cyclones. This transition can take 1–3 days.[90] Even after a tropical cyclone is said to be extratropical or dissipated, it can still have tropical storm force (or occasionally hurricane/typhoon force) winds and drop several inches of rainfall. In the Pacific Ocean and Atlantic Ocean, such tropical-derived cyclones of higher latitudes can be violent and may occasionally remain at hurricane or typhoon-force wind speeds when they reach the west coast of North America. These phenomena can also affect Europe, where they are known as European windstorms; Hurricane Iris's extratropical remnants are an example of such a windstorm from 1995.[91] A cyclone can also merge with another area of low pressure, becoming a larger area of low pressure. This can strengthen the resultant system, although it may no longer be a tropical cyclone.[89] Studies in the 2000s have given rise to the hypothesis that large amounts of dust reduce the strength of tropical cyclones.[92]
Artificial dissipation
In the 1960s and 1970s, the United States government attempted to weaken hurricanes through Project Stormfury by seeding selected storms with silver iodide. It was thought that the seeding would cause supercooled water in the outer rainbands to freeze, causing the inner eyewall to collapse and thus reducing the winds.[93] The winds of Hurricane Debbie—a hurricane seeded in Project Stormfury—dropped as much as 31%, but Debbie regained its strength after each of two seeding forays.[94] In an earlier episode in 1947, disaster struck when a hurricane east of Jacksonville, Florida promptly changed its course after being seeded, and smashed into Savannah, Georgia.[95] Because there was so much uncertainty about the behavior of these storms, the federal government would not approve seeding operations unless the hurricane had a less than 10% chance of making landfall within 48 hours, greatly reducing the number of possible test storms. The project was dropped after it was discovered that eyewall replacement cycles occur naturally in strong hurricanes, casting doubt on the result of the earlier attempts. Today, it is known that silver iodide seeding is not likely to have an effect because the amount of supercooled water in the rainbands of a tropical cyclone is too low.[96]
Other approaches have been suggested over time, including cooling the water under a tropical cyclone by towing icebergs into the tropical oceans.[97] Other ideas range from covering the ocean in a substance that inhibits evaporation,[98] dropping large quantities of ice into the eye at very early stages of development (so that the latent heat is absorbed by the ice, instead of being converted to kinetic energy that would feed the positive feedback loop),[97] or blasting the cyclone apart with nuclear weapons.[99] Project Cirrus even involved throwing dry ice on a cyclone.[100] These approaches all suffer from one flaw above many others: tropical cyclones are simply too large and long-lived for any of the weakening techniques to be practical.[101]
Effects
Tropical cyclones out at sea cause large waves, heavy rain, flood and high winds, disrupting international shipping and, at times, causing shipwrecks.[102] Tropical cyclones stir up water, leaving a cool wake behind them, which causes the region to be less favorable for subsequent tropical cyclones.[39] On land, strong winds can damage or destroy vehicles, buildings, bridges, and other outside objects, turning loose debris into deadly flying projectiles. The storm surge, or the increase in sea level due to the cyclone, is typically the worst effect from landfalling tropical cyclones, historically resulting in 90% of tropical cyclone deaths.[103] The broad rotation of a landfalling tropical cyclone, and vertical wind shear at its periphery, spawns tornadoes. Tornadoes can also be spawned as a result of eyewall mesovortices, which persist until landfall.[104]
Over the past two centuries, tropical cyclones have been responsible for the deaths of about 1.9 million people worldwide. Large areas of standing water caused by flooding lead to infection, as well as contributing to mosquito-borne illnesses. Crowded evacuees in shelters increase the risk of disease propagation.[103] Tropical cyclones significantly interrupt infrastructure, leading to power outages, bridge destruction, and the hampering of reconstruction efforts.[103][105] On average, the Gulf and east coasts of the United States suffer approximately US$5 billion (1995 US $) in cyclone damage every year. The majority (83%) of tropical cyclone damage is caused by severe hurricanes, category 3 or greater. However, category 3 or greater hurricanes only account for about one-fifth of cyclones that make landfall every year.[106]
Although cyclones take an enormous toll in lives and personal property, they may be important factors in the precipitation regimes of places they impact, as they may bring much-needed precipitation to otherwise dry regions.[107] Tropical cyclones also help maintain the global heat balance by moving warm, moist tropical air to the middle latitudes and polar regions,[108] and by regulating the thermohaline circulation through upwelling.[109] The storm surge and winds of hurricanes may be destructive to human-made structures, but they also stir up the waters of coastal estuaries, which are typically important fish breeding locales. Tropical cyclone destruction spurs redevelopment, greatly increasing local property values.[110]
When hurricanes surge upon shore from the ocean, salt is introduced to many freshwater areas and raises the salinity levels too high for some habitats to withstand. Some are able to cope with the salt and recycle it back into the ocean, but others can not release the extra surface water quickly enough or do not have a large enough freshwater source to replace it. Because of this, some species of plants and vegetation die due to the excess salt.[111] In addition, hurricanes can carry toxins and acids onto shore when they make landfall. The flood water can pick up the toxins from different spills and contaminate the land that it passes over. The toxins are very harmful to the people and animals in the area, as well as the environment around them. The flooding water can also spark many dangerous oil spills.[112]
Preparedness and response
Hurricane preparedness encompasses the actions and planning taken before a tropical cyclone strikes to mitigate damage and injury from the storm. Knowledge of tropical cyclone impacts on an area help plan for future possibilities. Preparedness may involve preparations made by individuals as well as centralized efforts by governments or other organizations. Tracking storms during the tropical cyclone season helps individuals know current threats. Regional Specialized Meteorological Centers and Tropical Cyclone Warning Centers provide current information and forecasts to help individuals make the best decision possible.
Hurricane response is the disaster response after a hurricane. Activities performed by hurricane responders include assessment, restoration, and demolition of buildings; removal of debris and waste; repairs to land-based and maritime infrastructure; and public health services including search and rescue operations.[113] Hurricane response requires coordination between federal, tribal, state, local, and private entities.[114] According to the National Voluntary Organizations Active in Disaster, potential response volunteers should affiliate with established organizations and should not self-deploy, so that proper training and support can be provided to mitigate the danger and stress of response work.[115]
Hurricane responders face many hazards. Hurricane responders may be exposed to chemical and biological contaminants including stored chemicals, sewage, human remains, and mold growth encouraged by flooding,[116][117][118] as well as asbestos and lead that may be present in older buildings.[117][119] Common injuries arise from falls from heights, such as from a ladder or from level surfaces; from electrocution in flooded areas, including from backfeed from portable generators; or from motor vehicle accidents.[116][119][120] Long and irregular shifts may lead to sleep deprivation and fatigue, increasing the risk of injuries, and workers may experience mental stress associated with a traumatic incident. Additionally, heat stress is a concern as workers are often exposed to hot and humid temperatures, wear protective clothing and equipment, and have physically difficult tasks.[116][119]
Observation and forecasting
Observation

_at_SENEX_Air_Quality-Climate_Research_Study_(9119691512).jpg)
Intense tropical cyclones pose a particular observation challenge, as they are a dangerous oceanic phenomenon, and weather stations, being relatively sparse, are rarely available on the site of the storm itself. In general, surface observations are available only if the storm is passing over an island or a coastal area, or if there is a nearby ship. Real-time measurements are usually taken in the periphery of the cyclone, where conditions are less catastrophic and its true strength cannot be evaluated. For this reason, there are teams of meteorologists that move into the path of tropical cyclones to help evaluate their strength at the point of landfall.[121]
Tropical cyclones far from land are tracked by weather satellites capturing visible and infrared images from space, usually at half-hour to quarter-hour intervals. As a storm approaches land, it can be observed by land-based Doppler weather radar. Radar plays a crucial role around landfall by showing a storm's location and intensity every several minutes.[122]
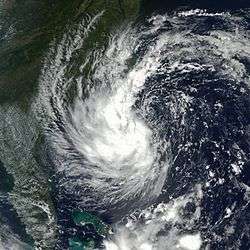
In situ measurements, in real-time, can be taken by sending specially equipped reconnaissance flights into the cyclone. In the Atlantic basin, these flights are regularly flown by United States government hurricane hunters.[123] The aircraft used are WC-130 Hercules and WP-3D Orions, both four-engine turboprop cargo aircraft. These aircraft fly directly into the cyclone and take direct and remote-sensing measurements. The aircraft also launch GPS dropsondes inside the cyclone. These sondes measure temperature, humidity, pressure, and especially winds between flight level and the ocean's surface. A new era in hurricane observation began when a remotely piloted Aerosonde, a small drone aircraft, was flown through Tropical Storm Ophelia as it passed Virginia's Eastern Shore during the 2005 hurricane season. A similar mission was also completed successfully in the western Pacific Ocean. This demonstrated a new way to probe the storms at low altitudes that human pilots seldom dare.[124]
Forecasting
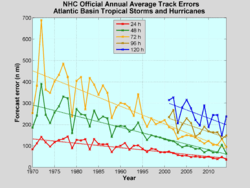
Because of the forces that affect tropical cyclone tracks, accurate track predictions depend on determining the position and strength of high- and low-pressure areas, and predicting how those areas will change during the life of a tropical system. The deep layer mean flow, or average wind through the depth of the troposphere, is considered the best tool in determining track direction and speed. If storms are significantly sheared, use of wind speed measurements at a lower altitude, such as at the 70 kPa pressure surface (3,000 metres or 9,800 feet above sea level) will produce better predictions. Tropical forecasters also consider smoothing out short-term wobbles of the storm as it allows them to determine a more accurate long-term trajectory.[125] High-speed computers and sophisticated simulation software allow forecasters to produce computer models that predict tropical cyclone tracks based on the future position and strength of high- and low-pressure systems. Combining forecast models with increased understanding of the forces that act on tropical cyclones, as well as with a wealth of data from Earth-orbiting satellites and other sensors, scientists have increased the accuracy of track forecasts over recent decades.[126] However, scientists are not as skillful at predicting the intensity of tropical cyclones.[127] The lack of improvement in intensity forecasting is attributed to the complexity of tropical systems and an incomplete understanding of factors that affect their development. New tropical cyclone position and forecast information is available at least every six hours from the various warning centers.[46][128][129][130][131]
Classifications, terminology, and naming
Intensity classifications

Around the world, tropical cyclones are classified in different ways, based on the location, the structure of the system and its intensity. For example, within the Northern Atlantic and Eastern Pacific basins, a tropical cyclone with wind speeds of over 65 kn (75 mph; 120 km/h) is called a hurricane, while it is called a typhoon or a severe cyclonic storm within the Western Pacific or North Indian Oceans.[41][42][43] Within the Southern Hemisphere, it is either called a hurricane, tropical cyclone or a severe tropical cyclone, depending on if it is located within the South Atlantic, South-West Indian Ocean, Australian region or the South Pacific Ocean.[44][45] If a tropical cyclone moves from one basin to another, then it is generally classified using that basin's terminology.
| Tropical cyclone classifications | ||||||||
|---|---|---|---|---|---|---|---|---|
| Beaufort scale |
1-minute sustained winds (NHC/CPHC/JTWC) |
10-minute sustained winds (WMO/JMA/MF/BOM/FMS) |
NE Pacific & N Atlantic NHC/CPHC[41] |
NW Pacific JTWC |
NW Pacific JMA |
N Indian Ocean IMD[43] |
SW Indian Ocean MF |
Australia & S Pacific BOM/FMS[45] |
| 0–7 | <32 knots (37 mph; 59 km/h) | <28 knots (32 mph; 52 km/h) | Tropical Depression | Tropical Depression | Tropical Depression | Depression | Zone of Disturbed Weather | Tropical Disturbance Tropical Depression Tropical Low |
| 7 | 33 knots (38 mph; 61 km/h) | 28–29 knots (32–33 mph; 52–54 km/h) | Deep Depression | Tropical Disturbance | ||||
| 8-9 | 34–37 knots (39–43 mph; 63–69 km/h) | 30–33 knots (35–38 mph; 56–61 km/h) | Tropical Storm | Tropical Storm | Tropical Depression | |||
| 9–10 | 38–54 knots (44–62 mph; 70–100 km/h) | 34–47 knots (39–54 mph; 63–87 km/h) | Tropical Storm | Cyclonic Storm | Moderate Tropical Storm |
Category 1 Tropical Cyclone | ||
| 10-11 | 55–63 knots (63–72 mph; 102–117 km/h) | 48–55 knots (55–63 mph; 89–102 km/h) | Severe Tropical Storm |
Severe Cyclonic Storm |
Severe Tropical Storm |
Category 2 Tropical Cyclone | ||
| 12+ | 64–71 knots (74–82 mph; 119–131 km/h) | 56–63 knots (64–72 mph; 104–117 km/h) | Category 1 Hurricane |
Typhoon | ||||
| 72–82 knots (83–94 mph; 133–152 km/h) | 64–72 knots (74–83 mph; 119–133 km/h) | Typhoon | Very Severe Cyclonic Storm |
Tropical Cyclone | Category 3 Severe Tropical Cyclone | |||
| 83–95 knots (96–109 mph; 154–176 km/h) | 73–83 knots (84–96 mph; 135–154 km/h) | Category 2 Hurricane | ||||||
| 96–97 knots (110–112 mph; 178–180 km/h) | 84–85 knots (97–98 mph; 156–157 km/h) | Category 3 Major Hurricane |
Very Strong Typhoon | |||||
| 98–112 knots (113–129 mph; 181–207 km/h) | 86–98 knots (99–113 mph; 159–181 km/h) | Extremely Severe Cyclonic Storm |
Intense Tropical Cyclone |
Category 4 Severe Tropical Cyclone | ||||
| 113–122 knots (130–140 mph; 209–226 km/h) | 99–107 knots (114–123 mph; 183–198 km/h) | Category 4 Major Hurricane | ||||||
| 123–129 knots (142–148 mph; 228–239 km/h) | 108–113 knots (124–130 mph; 200–209 km/h) | Violent Typhoon | Category 5 Severe Tropical Cyclone | |||||
| 130–136 knots (150–157 mph; 241–252 km/h) | 114–119 knots (131–137 mph; 211–220 km/h) | Super Typhoon |
Super Cyclonic Storm |
Very Intense Tropical Cyclone | ||||
| >137 knots (158 mph; 254 km/h) | >120 knots (138 mph; 222 km/h) | Category 5 Major Hurricane | ||||||
Identification codes
Tropical cyclones that develop around the world are assigned an identification code consisting of a two-digit number and suffix letter by the warning centers that monitor them. These codes start at 01 every year and are assigned in order to systems, which have the potential to develop further, cause significant impact to life and property or when the warning centers start to write advisories on the system.[45][132]
| Tropical Cyclone Numbering[132][133][134] | |||
|---|---|---|---|
| Basin(s) | Warning Center |
Format | Example |
| N Atlantic | NHC | nn (nnL)[lower-alpha 1] |
06 (06L) |
| NE Pacific (E of 140°W) |
nnE | 09E | |
| NC Pacific (E of IDL, W of 140°W) |
CPHC | nnC | 02C |
| NW Pacific (W of IDL) |
JMA | yynn (nn, Tyynn)[lower-alpha 2] |
1330 (30, T1330) |
| JTWC | nnW | 10W | |
| N Indian (Bay of Bengal) |
IMD | BOB nn | BOB 03 |
| JTWC | nnB | 05B | |
| N Indian (Arabian Sea) |
IMD | ARB nn | ARB 01 |
| JTWC | nnA | 02A | |
| SW Indian (W of 90°E) |
MFR | nn (REnn)[lower-alpha 3] |
07 (RE07) |
| SW Indian & Australian reg. (W of 135°E) |
JTWC | nnS | 01S |
| Australian reg. (E of 90°E, W of 160°E) |
BOM | nnU | 08U |
| Australian reg. & S Pacific (E of 135°E) |
JTWC | nnP | 04P |
| S Pacific (E of 160°E) |
FMS | nnF | 11F |
| S Atlantic | NRL, NHC[lower-alpha 4] | nnQ | 01Q |
| UKMet | nnT[lower-alpha 5] | 02T | |
Notes:
| |||
Naming
The practice of using names to identify tropical cyclones goes back many years, with systems named after places or things they hit before the formal start of naming.[141][142] The system currently used provides positive identification of severe weather systems in a brief form, that is readily understood and recognized by the public.[141][142] The credit for the first usage of personal names for weather systems is generally given to the Queensland Government Meteorologist Clement Wragge who named systems between 1887 and 1907.[141][142] This system of naming weather systems subsequently fell into disuse for several years after Wragge retired, until it was revived in the latter part of World War II for the Western Pacific.[141][142] Formal naming schemes have subsequently been introduced for the North and South Atlantic, Eastern, Central, Western and Southern Pacific basins as well as the Australian region and Indian Ocean.[142]
At present, tropical cyclones are officially named by one of eleven meteorological services and retain their names throughout their lifetimes to provide ease of communication between forecasters and the general public regarding forecasts, watches, and warnings.[141] Since the systems can last a week or longer and more than one can be occurring in the same basin at the same time, the names are thought to reduce the confusion about what storm is being described.[141] Names are assigned in order from predetermined lists with one, three, or ten-minute sustained wind speeds of more than 65 km/h (40 mph) depending on which basin it originates.[41][43][44] However, standards vary from basin to basin with some tropical depressions named in the Western Pacific, while tropical cyclones have to have a significant amount of gale-force winds occurring around the center before they are named within the Southern Hemisphere.[44][45] The names of significant tropical cyclones in the North Atlantic Ocean, Pacific Ocean, and Australian region are retired from the naming lists and replaced with another name.[41][42][45]
Notable tropical cyclones
Tropical cyclones that cause extreme destruction are rare, although when they occur, they can cause great amounts of damage or thousands of fatalities.
The 1970 Bhola cyclone is considered to be the deadliest tropical cyclone on record, which killed around 300,000 people, after striking the densely populated Ganges Delta region of Bangladesh on November 13, 1970.[143] Its powerful storm surge was responsible for the high death toll.[144] The North Indian cyclone basin has historically been the deadliest basin.[103][145] Elsewhere, Typhoon Nina killed nearly 100,000 in China in 1975 due to a 100-year flood that caused 62 dams including the Banqiao Dam to fail.[146] The Great Hurricane of 1780 is the deadliest North Atlantic hurricane on record, killing about 22,000 people in the Lesser Antilles.[147] A tropical cyclone does not need to be particularly strong to cause memorable damage, primarily if the deaths are from rainfall or mudslides. Tropical Storm Thelma in November 1991 killed thousands in the Philippines,[148] although the strongest typhoon to ever make landfall on record was Typhoon Haiyan in November 2013, causing widespread devastation in Eastern Visayas, and killing at least 6,300 people in the Philippines alone. In 1982, the unnamed tropical depression that eventually became Hurricane Paul killed around 1,000 people in Central America.[149]
Hurricane Harvey and Hurricane Katrina are estimated to be the costliest tropical cyclones to impact the United States mainland, each causing damage estimated at $125 billion.[150] Harvey killed at least 90 people in August 2017 after making landfall in Texas as a low-end Category 4 hurricane. Hurricane Katrina is estimated as the second-costliest tropical cyclone worldwide,[151] causing $81.2 billion in property damage (2008 USD) alone,[152] with overall damage estimates exceeding $100 billion (2005 USD).[151] Katrina killed at least 1,836 people after striking Louisiana and Mississippi as a major hurricane in August 2005.[152] Hurricane Maria is the third most destructive tropical cyclone in U.S. history, with damage totaling $91.61 billion (2017 USD), and with damage costs at $68.7 billion (2012 USD), Hurricane Sandy is the fourth most destructive tropical cyclone in U.S history. The Galveston Hurricane of 1900 is the deadliest natural disaster in the United States, killing an estimated 6,000 to 12,000 people in Galveston, Texas.[153] Hurricane Mitch caused more than 10,000 fatalities in Central America, making it the second deadliest Atlantic hurricane in history. Hurricane Iniki in 1992 was the most powerful storm to strike Hawaii in recorded history, hitting Kauai as a Category 4 hurricane, killing six people, and causing U.S. $3 billion in damage.[154] Other destructive Eastern Pacific hurricanes include Pauline and Kenna, both causing severe damage after striking Mexico as major hurricanes.[155][156] In March 2004, Cyclone Gafilo struck northeastern Madagascar as a powerful cyclone, killing 74, affecting more than 200,000 and becoming the worst cyclone to affect the nation for more than 20 years.[157]

The most intense storm on record is Typhoon Tip in the northwestern Pacific Ocean in 1979, which reached a minimum pressure of 870 hectopascals (25.69 inHg) and maximum sustained wind speeds of 165 knots (85 m/s) or 190 miles per hour (310 km/h).[158] The highest maximum sustained wind speed ever recorded was 185 knots (95 m/s) or 215 miles per hour (346 km/h) in Hurricane Patricia in 2015—the most intense cyclone ever recorded in the Western Hemisphere.[159] Typhoon Nancy in 1961 also had recorded wind speeds of 185 knots (95 m/s) or 215 miles per hour (346 km/h), but recent research indicates that wind speeds from the 1940s to the 1960s were gauged too high, and thus it is no longer considered the storm with the highest wind speed on record.[160] Likewise, a surface-level gust caused by Typhoon Paka on Guam in late 1997 was recorded at 205 knots (105 m/s) or 235 miles per hour (378 km/h). Had it been confirmed, it would be the strongest non-tornadic wind ever recorded on the Earth's surface, but the reading had to be discarded since the anemometer was damaged by the storm.[161] The World Meteorological Organization established Barrow Island (Queensland) as the location of the highest non-tornado related wind gust at 408 kilometres per hour (254 mph)[162] on April 10, 1996, during Severe Tropical Cyclone Olivia.[163]
In addition to being the most intense tropical cyclone on record based on pressure, Tip is the largest cyclone on record, with tropical storm-force winds 2,170 kilometres (1,350 mi) in diameter. The smallest storm on record, Tropical Storm Marco, formed during October 2008 and made landfall in Veracruz. Marco generated tropical storm-force winds only 37 kilometres (23 mi) in diameter.[164]
Hurricane John is the longest-lasting tropical cyclone on record, lasting 31 days in 1994. Before the advent of satellite imagery in 1961, however, many tropical cyclones were underestimated in their durations.[165] John is also the longest-tracked tropical cyclone in the Northern Hemisphere on record, with a path of 8,250 mi (13,280 km).[166] Cyclone Rewa of the 1993–94 South Pacific and Australian region cyclone seasons had one of the longest tracks observed within the Southern Hemisphere, traveling a distance of over 5,545 mi (8,920 km) during December 1993 and January 1994.[166]
Long-term activity trends
While the number of storms in the Atlantic has increased since 1995, there is no obvious global trend; the annual number of tropical cyclones worldwide remains about 87 ± 10 (Between 77 and 97 tropical cyclones annually). However, the ability of climatologists to make long-term data analysis in certain basins is limited by the lack of reliable historical data in some basins, primarily in the Southern Hemisphere,[167] while noting that a significant downward trend in tropical cyclone numbers has been identified for the region near Australia (based on high quality data and accounting for the influence of the El Niño-Southern Oscillation).[168] In spite of that, there is some evidence that the intensity of hurricanes is increasing. Kerry Emanuel stated, "Records of hurricane activity worldwide show an upswing of both the maximum wind speed in and the duration of hurricanes. The energy released by the average hurricane (again considering all hurricanes worldwide) seems to have increased by around 70% in the past 30 years or so, corresponding to about a 15% increase in the maximum wind speed and a 60% increase in storm lifetime."[169]
Atlantic storms are becoming more destructive financially, as evidenced by the fact that the ten most expensive storms in United States history have occurred since 1990. According to the World Meteorological Organization, "recent increase in societal impact from tropical cyclones has been caused largely by rising concentrations of population and infrastructure in coastal regions."[170] Political scientist Pielke et al. (2008) normalized mainland US hurricane damage from 1900–2005 to 2005 values and found no remaining trend of increasing absolute damage. The 1970s and 1980s were notable because of the extremely low amounts of damage compared to other decades. The decade 1996–2005 was the second most damaging among the past 11 decades, with only the decade 1926–1935 surpassing its costs.
Often in part because of the threat of hurricanes, many coastal regions had sparse population between major ports until the advent of automobile tourism; therefore, the most severe portions of hurricanes striking the coast may have gone unmeasured in some instances. The combined effects of ship destruction and remote landfall severely limit the number of intense hurricanes in the official record before the era of hurricane reconnaissance aircraft and satellite meteorology. Although the record shows a distinct increase in the number and strength of intense hurricanes, therefore, experts regard the early data as suspect.[171]
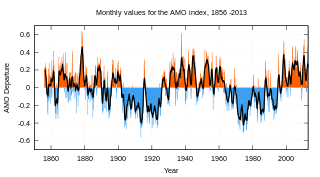
The number and strength of Atlantic hurricanes may undergo a 50–70 year cycle, also known as the Atlantic Multidecadal Oscillation. Nyberg et al. reconstructed Atlantic major hurricane activity back to the early 18th century and found five periods averaging 3–5 major hurricanes per year and lasting 40–60 years, and six other averaging 1.5–2.5 major hurricanes per year and lasting 10–20 years. These periods are associated with the Atlantic multidecadal oscillation. Throughout, a decadal oscillation related to solar irradiance was responsible for enhancing/dampening the number of major hurricanes by 1–2 per year.[172]
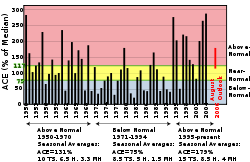
Although more common since 1995, few above-normal hurricane seasons occurred during 1970–94.[173] Destructive hurricanes struck frequently from 1926 to 1960, including many major New England hurricanes. Twenty-one Atlantic tropical storms formed in 1933, a record only recently exceeded in 2005, which saw 28 storms. Tropical hurricanes occurred infrequently during the seasons of 1900–25; however, many intense storms formed during 1870–99. During the 1887 season, 19 tropical storms formed, of which a record 4 occurred after November 1 and 11 strengthened into hurricanes. Few hurricanes occurred in the 1840s to 1860s; however, many struck in the early 19th century, including an 1821 storm that made a direct hit on New York City. Some historical weather experts say these storms may have been as high as Category 4 in strength.[174]
These active hurricane seasons predated satellite coverage of the Atlantic basin. Before the satellite era began in 1960, tropical storms or hurricanes went undetected unless a reconnaissance aircraft encountered one, a ship reported a voyage through the storm, or a storm hit land in a populated area.[171]
Proxy records based on paleotempestological research have revealed that major hurricane activity along the Gulf of Mexico coast varies on timescales of centuries to millennia.[175][176] Few major hurricanes struck the Gulf coast during 3000–1400 BC and again during the most recent millennium. These quiescent intervals were separated by a hyperactive period during 1400 BC and 1000 AD, when the Gulf coast was struck frequently by catastrophic hurricanes and their landfall probabilities increased by 3–5 times. This millennial-scale variability has been attributed to long-term shifts in the position of the Azores High,[176] which may also be linked to changes in the strength of the North Atlantic oscillation.[177]
According to the Azores High hypothesis, an anti-phase pattern is expected to exist between the Gulf of Mexico coast and the Atlantic coast. During the quiescent periods, a more northeasterly position of the Azores High would result in more hurricanes being steered towards the Atlantic coast. During the hyperactive period, more hurricanes were steered towards the Gulf coast as the Azores High was shifted to a more southwesterly position near the Caribbean. Such a displacement of the Azores High is consistent with paleoclimatic evidence that shows an abrupt onset of a drier climate in Haiti around 3200 14C years BP,[178] and a change towards more humid conditions in the Great Plains during the late-Holocene as more moisture was pumped up the Mississippi Valley through the Gulf coast. Preliminary data from the northern Atlantic coast seem to support the Azores High hypothesis. A 3000-year proxy record from a coastal lake in Cape Cod suggests that hurricane activity increased significantly during the past 500–1000 years, just as the Gulf coast was amid a quiescent period of the last millennium.
Climate change
The 2007 IPCC report noted many observed changes in the climate, including atmospheric composition, global average temperatures, ocean conditions, and others. The report concluded the observed increase in tropical cyclone intensity is larger than climate models predict. In addition, the report considered that it is likely that storm intensity will continue to increase through the 21st century, and declared it more likely than not that there has been some human contribution to the increases in tropical cyclone intensity.[179]
P.J. Webster and others published in 2005 an article in Science examining the "changes in tropical cyclone number, duration, and intensity" over the past 35 years, the period when satellite data has been available. Their main finding was although the number of cyclones decreased throughout the planet excluding the north Atlantic Ocean, there was a great increase in the number and proportion of very strong cyclones.[180] Projections currently show no consensus on how climate change will affect the overall frequency of tropical cyclones.[181]
According to 2006 studies by the National Oceanic and Atmospheric Administration, "the strongest hurricanes in the present climate may be upstaged by even more intense hurricanes over the next century as the earth's climate is warmed by increasing levels of greenhouse gases in the atmosphere".[182] A greater percentage (+13%) of tropical cyclones are expected to reach Category 4 and 5 strength with 2 °C warming.[181]
Studies published since 2008, by Kerry Emanuel from MIT, indicate that global warming is likely to increase the intensity but decrease the frequency of hurricane and cyclone activity.[183] In an article in Nature, Kerry Emanuel stated that potential hurricane destructiveness, a measure combining hurricane strength, duration, and frequency, "is highly correlated with tropical sea surface temperature, reflecting well-documented climate signals, including multidecadal oscillations in the North Atlantic and North Pacific, and global warming". Emanuel predicted "a substantial increase in hurricane-related losses in the twenty-first century".[184]
Research reported in the September 3, 2008 issue of Nature found that the strongest tropical cyclones are getting stronger, in particular over the North Atlantic and Indian oceans. Wind speeds for the strongest tropical storms increased from an average of 225 km/h (140 mph) in 1981 to 251 km/h (156 mph) in 2006, while the ocean temperature, averaged globally over all the regions where tropical cyclones form, increased from 28.2 °C (82.8 °F) to 28.5 °C (83.3 °F) during this period.[185][186]
A 2017 study looked at compounding effects from floods, storm surge, and terrestrial flooding (rivers), and projects an increase due to global warming.[187][188]
In 2020 a study was published, saying that climate change is increasing the likelihood of a storm of 3 category or above by 8% per decade.[189]
Related cyclone types
In addition to tropical cyclones, there are two other classes of cyclones within the spectrum of cyclone types. These kinds of cyclones, known as extratropical cyclones and subtropical cyclones, can be stages a tropical cyclone passes through during its formation or dissipation.[190] An extratropical cyclone is a storm that derives energy from horizontal temperature differences, which are typical in higher latitudes. A tropical cyclone can become extratropical as it moves toward higher latitudes if its energy source changes from heat released by condensation to differences in temperature between air masses; although not as frequently, an extratropical cyclone can transform into a subtropical storm, and from there into a tropical cyclone.[191] From space, extratropical storms have a characteristic "comma-shaped" cloud pattern.[192] Extratropical cyclones can also be dangerous when their low-pressure centers cause powerful winds and high seas.[193]
A subtropical cyclone is a weather system that has some characteristics of a tropical cyclone and some characteristics of an extratropical cyclone. They can form in a wide band of latitudes, from the equator to 50°. Although subtropical storms rarely have hurricane-force winds, they may become tropical in nature as their cores warm.[194] From an operational standpoint, a tropical cyclone is usually not considered to become subtropical during its extratropical transition.[195]
Popular culture
In popular culture, tropical cyclones have made several appearances in different types of media, including films, books, television, music, and electronic games.[196] These media often portray tropical cyclones that are either entirely fictional or based on real events.[196] For example, George Rippey Stewart's Storm, a best-seller published in 1941, is thought to have influenced meteorologists on their decision to assign female names to Pacific tropical cyclones.[142] Another example is the hurricane in The Perfect Storm, which describes the sinking of the Andrea Gail by the 1991 Perfect Storm.[197] Hurricanes have been featured in parts of the plots of series such as The Simpsons, Invasion, Family Guy, Seinfeld, Dawson's Creek, Burn Notice and CSI: Miami.[196][198][199][200][201][202] The 2004 film The Day After Tomorrow includes several mentions of actual tropical cyclones and features fantastical "hurricane-like", albeit non-tropical, Arctic storms.[203][204]
See also
- Disaster preparedness
- Extraterrestrial vortex
- History of Atlantic tropical cyclone warnings
- HURDAT (online database)
- Hurricane Alley
- Hypercane
- List of Atlantic hurricanes
- List of Category 4 Atlantic hurricanes
- List of Category 4 Pacific hurricanes
- List of Category 5 Atlantic hurricanes
- List of Category 5 Pacific hurricanes
- List of the most intense tropical cyclones
- List of tropical cyclone records
- List of wettest tropical cyclones by country
- Outline of tropical cyclones
- Secondary flow in tropical cyclones
- Whirlwind
Forecasting and preparation
- Catastrophe modeling
- Hurricane engineering
- Hurricane preparedness
- Hurricane-proof building
- Tropical cyclone watches and warnings
Tropical cyclone seasons
- current
- current
- Mediterranean tropical-like cyclone
- current
- Pacific hurricane season (current)
- Pacific typhoon season (current)
- current
- current
References
- "hurricane". Oxford dictionary. Archived from the original on October 6, 2014. Retrieved October 1, 2014.
- "Hurricane – Definition and More from the Free Merriam-Webster Dictionary". Archived from the original on September 12, 2017. Retrieved October 1, 2014.
- "Definition of "hurricane" – Collins English Dictionary". Archived from the original on October 6, 2014. Retrieved October 1, 2014.
- "What is the difference between a hurricane, a cyclone, and a typhoon?". OCEAN FACTS. National Ocean Service. Archived from the original on December 25, 2016. Retrieved December 24, 2016.
- "Oxford English Dictionary". OED Online. Oxford University Press. 2017. Retrieved September 10, 2017.
a general term for all storms or atmospheric disturbances in which the wind has a circular or whirling course.
- Henderson-Sellers, A.; Zhang, H.; Berz, G.; Emanuel, K.; Gray, W.; Landsea, C.; Holland, G.; Lighthill, J.; Shieh, S.L.; Webster, P.; McGuffie, K. (1998). "Tropical Cyclones and Global Climate Change: A Post-IPCC Assessment". Bulletin of the American Meteorological Society. 79 (1): 19–38. Bibcode:1998BAMS...79...19H. doi:10.1175/1520-0477(1998)079<0019:TCAGCC>2.0.CO;2.
- Landsea, Chris (July 13, 2005). "Why doesn't the South Atlantic Ocean experience tropical cyclones?". Atlantic Oceanographic and Meteorological Laboratory. National Oceanographic and Atmospheric Administration. Archived from the original on June 23, 2012. Retrieved June 9, 2018.
- Symonds, Steve (November 17, 2003). "Highs and Lows". Wild Weather. Australian Broadcasting Corporation. Archived from the original on October 11, 2007. Retrieved March 23, 2007.
- Atlantic Oceanographic and Meteorological Laboratory; Hurricane Research Division. "Frequently Asked Questions: What is an extra-tropical cyclone?". National Oceanic and Atmospheric Administration. Archived from the original on February 9, 2007. Retrieved March 23, 2007.
- National Hurricane Center (2016). "Glossary of NHC/TPC Terms". United States National Oceanic and Atmospheric Administration. Archived from the original on June 1, 2014. Retrieved April 30, 2016.
- Marine Meteorology Division. "Cirrus Cloud Detection" (PDF). Satellite Product Tutorials. Monterey, CA: United States Naval Research Laboratory. p. 1. Archived (PDF) from the original on February 16, 2013. Retrieved June 4, 2013.
- Frank, W.M. (1977). "The structure and energetics of the tropical cyclone I. Storm structure". Monthly Weather Review. 105 (9): 1119–1135. Bibcode:1977MWRv..105.1119F. doi:10.1175/1520-0493(1977)105<1119:TSAEOT>2.0.CO;2.
- National Weather Service (October 19, 2005). "Tropical Cyclone Structure". JetStream – An Online School for Weather. National Oceanic & Atmospheric Administration. Archived from the original on December 7, 2013. Retrieved May 7, 2009.
- Pasch, Richard J.; Eric S. Blake; Hugh D. Cobb III; David P. Roberts (September 28, 2006). "Tropical Cyclone Report: Hurricane Wilma: 15–25 October 2005" (PDF). National Hurricane Center. Retrieved December 14, 2006.
- Annamalai, H.; Slingo, J.M.; Sperber, K.R.; Hodges, K. (1999). "The Mean Evolution and Variability of the Asian Summer Monsoon: Comparison of ECMWF and NCEP–NCAR Reanalyses". Monthly Weather Review. 127 (6): 1157–1186. Bibcode:1999MWRv..127.1157A. doi:10.1175/1520-0493(1999)127<1157:TMEAVO>2.0.CO;2.
- American Meteorological Society. "AMS Glossary: C". Glossary of Meteorology. Allen Press. Archived from the original on January 26, 2011. Retrieved December 14, 2006.
- Atlantic Oceanographic and Hurricane Research Division. "Frequently Asked Questions: What are "concentric eyewall cycles" (or "eyewall replacement cycles") and why do they cause a hurricane's maximum winds to weaken?". National Oceanic and Atmospheric Administration. Archived from the original on December 6, 2006. Retrieved December 14, 2006.
- "Glossary of NHC Terms". United States National Oceanic and Atmospheric Administration's National Hurricane Center. Archived from the original on September 12, 2019. Retrieved June 2, 2019.
- Diana Engle. "Hurricane Structure and Energetics". Data Discovery Hurricane Science Center. Archived from the original on May 27, 2008. Retrieved October 26, 2008.
- "Q: What is the average size of a tropical cyclone?". Joint Typhoon Warning Center. 2009. Archived from the original on October 4, 2013. Retrieved May 7, 2009.
- "Global Guide to Tropical Cyclone Forecasting: chapter 2: Tropical Cyclone Structure". Bureau of Meteorology. May 7, 2009. Archived from the original on June 1, 2011. Retrieved May 6, 2009.
- Chavas, D.R.; Emanuel, K.A. (2010). "A QuikSCAT climatology of tropical cyclone size". Geophysical Research Letters. 37 (18): n/a. Bibcode:2010GeoRL..3718816C. doi:10.1029/2010GL044558. hdl:1721.1/64407.
- Merrill, Robert T (1984). "A comparison of Large and Small Tropical cyclones". Monthly Weather Review. 112 (7): 1408–1418. Bibcode:1984MWRv..112.1408M. doi:10.1175/1520-0493(1984)112<1408:ACOLAS>2.0.CO;2.
- Irish, J.L.; Resio, D.T.; Ratcliff, J.J. (2008). "The Influence of Storm Size on Hurricane Surge". Journal of Physical Oceanography. 38 (9): 2003–2013. Bibcode:2008JPO....38.2003I. doi:10.1175/2008JPO3727.1.
- Waco, D.E. (1970). "Temperatures and Turbulence at Tropopause Levels over Hurricane Beulah (1967)". Monthly Weather Review. 98 (10): 749–755. Bibcode:1970MWRv...98..749W. doi:10.1175/1520-0493(1970)098<0749:TATATL>2.3.CO;2.
- Emanuel, Kerry (February 8, 2006). "Anthropogenic Effects on Tropical Cyclone Activity". Massachusetts Institute of Technology. Archived from the original on March 30, 2009. Retrieved May 7, 2009.
- Emanuel, K A. (1986). "An Air-Sea Interaction Theory for Tropical Cyclones. Part I: Steady-State Maintenance". Journal of the Atmospheric Sciences. 43 (6): 585–605. Bibcode:1986JAtS...43..585E. doi:10.1175/1520-0469(1986)043<0585:AASITF>2.0.CO;2.
- "NOAA FAQ: How much energy does a hurricane release?". National Oceanic & Atmospheric Administration. August 2001. Archived from the original on June 22, 2012. Retrieved June 30, 2009.
- "Hurricanes: Keeping an eye on weather's biggest bullies". University Corporation for Atmospheric Research. March 31, 2006. Archived from the original on April 25, 2009. Retrieved May 7, 2009.
- Barnes, Gary. "Hurricanes and the equator". University of Hawaii. Archived from the original on August 5, 2013. Retrieved August 30, 2013.
- Bister, M.; Emanuel, K.A. (1998). "Dissipative heating and hurricane intensity". Meteorology and Atmospheric Physics. 65 (3–4): 233–240. Bibcode:1998MAP....65..233B. doi:10.1007/BF01030791.
- Emanuel, K. (2000). "A Statistical Analysis of Tropical Cyclone Intensity". Monthly Weather Review. 128 (4): 1139–1152. Bibcode:2000MWRv..128.1139E. doi:10.1175/1520-0493(2000)128<1139:ASAOTC>2.0.CO;2.
- Knutson, T.R.; McBride, J.L.; Chan, J.; Emanuel, K.; Holland, G.; Landsea, C.; Held, I.; Kossin, J.P.; Srivastava, A.K.; Sugi, M. (2010). "Tropical cyclones and climate change". Nature Geoscience. 3 (3): 157–163. Bibcode:2010NatGe...3..157K. doi:10.1038/ngeo779. hdl:11343/192963.
- Bister, M. (2002). "Low frequency variability of tropical cyclone potential intensity 1. Interannual to interdecadal variability". Journal of Geophysical Research. 107 (D24): 4801. Bibcode:2002JGRD..107.4801B. doi:10.1029/2001JD000776.
- Powell, M.D.; Vickery, P.J.; Reinhold, T.A. (2003). "Reduced drag coefficient for high wind speeds in tropical cyclones". Nature. 422 (6929): 279–83. Bibcode:2003Natur.422..279P. doi:10.1038/nature01481. PMID 12646913.
- Bell, M.M.; Montgomery, M.T.; Emanuel, K.A. (2012). "Air–Sea Enthalpy and Momentum Exchange at Major Hurricane Wind Speeds Observed during CBLAST". Journal of the Atmospheric Sciences. 69 (11): 3197–3222. Bibcode:2012JAtS...69.3197B. doi:10.1175/JAS-D-11-0276.1. hdl:1721.1/81202.
- Emanuel, K.; Sobel, A. (2013). "Response of tropical sea surface temperature, precipitation, and tropical cyclone-related variables to changes in global and local forcing". Journal of Advances in Modeling Earth Systems. 5 (2): 447–458. Bibcode:2013JAMES...5..447E. doi:10.1002/jame.20032.
- Woolnough, S. J.; Slingo, J. M.; Hoskins, B. J. (2000). "The Relationship between Convection and Sea Surface Temperature on Intraseasonal Timescales". Journal of Climate. 13 (12): 2086–2104. Bibcode:2000JCli...13.2086W. doi:10.1175/1520-0442(2000)013<2086:TRBCAS>2.0.CO;2.
- D'Asaro, Eric A. & Black, Peter G. (2006). "J8.4 Turbulence in the Ocean Boundary Layer Below Hurricane Dennis" (PDF). University of Washington. Archived from the original on March 30, 2012. Retrieved February 22, 2008.CS1 maint: unfit url (link)
- Fedorov, Alexey V.; Brierley, Christopher M.; Emanuel, Kerry (February 2010). "Tropical cyclones and permanent El Niño in the early Pliocene epoch". Nature. 463 (7284): 1066–1070. Bibcode:2010Natur.463.1066F. doi:10.1038/nature08831. hdl:1721.1/63099. ISSN 0028-0836. PMID 20182509.
- RA IV Hurricane Committee. Regional Association IV Hurricane Operational Plan 2019 (PDF) (Report). World Meteorological Organization. Retrieved July 2, 2019.
- WMO/ESCP Typhoon Committee (March 13, 2015). Typhoon Committee Operational Manual Meteorological Component 2015 (PDF) (Report No. TCP-23). World Meteorological Organization. pp. 40–41. Archived (PDF) from the original on September 4, 2015. Retrieved March 28, 2015.
- WMO/ESCAP Panel on Tropical Cyclones (November 2, 2018). Tropical Cyclone Operational Plan for the Bay of Bengal and the Arabian Sea 2018 (PDF) (Report No. TCP-21). World Meteorological Organization. pp. 11–12. Retrieved July 2, 2019.
- RA I Tropical Cyclone Committee (November 9, 2012). Tropical Cyclone Operational Plan for the South-West Indian Ocean: 2012 (PDF) (Report No. TCP-12). World Meteorological Organization. pp. 11–14. Archived (PDF) from the original on March 29, 2015. Retrieved March 29, 2015.
- RA V Tropical Cyclone Committee (October 11, 2018). Tropical Cyclone Operational Plan for the South-East Indian Ocean and the Southern Pacific Ocean 2018 (PDF) (Report). World Meteorological Organization. pp. I-4–II-9 (9–21). Archived from the original on October 12, 2018. Retrieved October 12, 2018.
- "Regional Specialized Meteorological Center". Tropical Cyclone Program (TCP). World Meteorological Organization. April 25, 2006. Archived from the original on August 14, 2010. Retrieved November 5, 2006.
- "Joint Typhoon Warning Center Mission Statement". Joint Typhoon Warning Center. November 9, 2007. Archived from the original on April 9, 2008. Retrieved May 7, 2009.
- "Mission Vision". Philippine Atmospheric, Geophysical and Astronomical Services Administration. February 24, 2008. Archived from the original on April 22, 2004. Retrieved May 7, 2009.
- "Canadian Hurricane Center". Canadian Hurricane Center. February 24, 2008. Archived from the original on July 25, 2019. Retrieved May 7, 2009.
- Marcelino, Emerson Vieira; Isabela Pena Viana de Oliveira Marcelino; Frederico de Moraes Rudorff (2004). "Cyclone Catarina: Damage and Vulnerability Assessment" (PDF). Santa Catarina Federal University. Archived from the original (PDF) on March 3, 2016. Retrieved December 24, 2006.
- Atlantic Oceanographic and Meteorological Laboratory, Hurricane Research Division. "Frequently Asked Questions: When is hurricane season?". National Oceanic and Atmospheric Administration. Archived from the original on May 5, 2009. Retrieved July 25, 2006.
- McAdie, Colin (May 10, 2007). "Tropical Cyclone Climatology". National Hurricane Center. Archived from the original on March 21, 2015. Retrieved June 9, 2007.
- Hurricane Research Division. "Frequently Asked Questions: What are the average, most, and least tropical cyclones occurring in each basin?". National Oceanic and Atmospheric Administration's Atlantic Oceanographic and Meteorological Laboratory. Retrieved December 5, 2012.
- http://www.rsmcnewdelhi.imd.gov.in/images/pdf/publications/annual-rsmc-report/rsmc-2018.pdf
- "Australian Tropical Cyclone Outlook for 2019 to 2020". Australian Bureau of Meteorology. October 11, 2019. Archived from the original on October 14, 2019. Retrieved October 14, 2019.
- 2019–20 Tropical Cyclone Season Outlook [in the] Regional Specialised Meteorological Centre Nadi – Tropical Cyclone Centre (RSMC Nadi – TCC) Area of Responsibility (AOR) (PDF) (Report). Fiji Meteorological Service. October 11, 2019. Archived (PDF) from the original on October 11, 2019. Retrieved October 11, 2019.
- Ross., Simon (1998). Natural Hazards (Illustrated ed.). Nelson Thornes. p. 96. ISBN 978-0-7487-3951-6. Retrieved May 7, 2009.
- Atlantic Oceanographic and Meteorological Laboratory, Hurricane Research Division. "Frequently Asked Questions: How do tropical cyclones form?". National Oceanic and Atmospheric Administration. Archived from the original on August 27, 2009. Retrieved July 26, 2006.
- Atlantic Oceanographic and Meteorological Laboratory, Hurricane Research Division. "Frequently Asked Questions: Why do tropical cyclones require 80 °F (27 °C) ocean temperatures to form?". National Oceanic and Atmospheric Administration. Archived from the original on August 23, 2006. Retrieved July 25, 2006.
- Ron McTaggart-Cowan; Canada Emily L.; Jonathan G. Fairman Jr.; Thomas J. Galarneau Jr.; David M. Schultz (2015). "Revisiting the 26.5°C Sea Surface Temperature Threshold for Tropical Cyclone Development". Bulletin of the American Meteorological Society. 96 (11): 1929–1943. Bibcode:2015BAMS...96.1929M. doi:10.1175/BAMS-D-13-00254.2. Archived from the original on June 13, 2017. Retrieved October 15, 2017.
- Kikuchi, Kazuyoshi; Wang, Bin; Fudeyasu, Hironori (2009). "Genesis of tropical cyclone Nargis revealed by multiple satellite observations" (PDF). Geophysical Research Letters. 36 (6): L06811. Bibcode:2009GeoRL..36.6811K. doi:10.1029/2009GL037296. Archived (PDF) from the original on December 29, 2010. Retrieved February 21, 2010.
- Korek, Fritz (November 21, 2000). "Marine Meteorological Glossary". Marine Knowledge Centre. Archived from the original on December 11, 2008. Retrieved May 6, 2009.
- "Formation of Tropical Cyclones". Philippine Atmospheric, Geophysical and Astronomical Services Administration. 2008. Archived from the original on September 2, 2012. Retrieved May 6, 2009.CS1 maint: unfit url (link)
- DeCaria, Alex (2005). "Lesson 5 – Tropical Cyclones: Climatology". ESCI 344 – Tropical Meteorology. Millersville University. Archived from the original on May 7, 2008. Retrieved February 22, 2008.
- Avila, L.A.; Pasch, R.J. (1995). "Atlantic Tropical Systems of 1993". Monthly Weather Review. 123 (3): 887–896. Bibcode:1995MWRv..123..887A. doi:10.1175/1520-0493(1995)123<0887:ATSO>2.0.CO;2.
- Atlantic Oceanographic and Meteorological Laboratory, Hurricane Research Division. "Frequently Asked Questions: What is an easterly wave?". National Oceanic and Atmospheric Administration. Archived from the original on July 18, 2006. Retrieved July 25, 2006.
- Landsea, C.W. (1993). "A Climatology of Intense (or Major) Atlantic Hurricanes". Monthly Weather Review. 121 (6): 1703–1713. Bibcode:1993MWRv..121.1703L. doi:10.1175/1520-0493(1993)121<1703:ACOIMA>2.0.CO;2.
- Dowdy, A.J.; Qi, L.; Jones, D.; Ramsay, H.; Fawcett, R.; Kuleshov, Y. (2012). "Tropical Cyclone Climatology of the South Pacific Ocean and Its Relationship to El Niño–Southern Oscillation". Journal of Climate. 25 (18): 6108–6122. Bibcode:2012JCli...25.6108D. doi:10.1175/JCLI-D-11-00647.1.
- Neumann, Charles J. "Worldwide Tropical Cyclone Tracks 1979–88". Global Guide to Tropical Cyclone Forecasting. Bureau of Meteorology. Archived from the original on June 2, 2011. Retrieved December 12, 2006.
- Henderson-Sellers; et al. (October 8, 2002). "Tropical Cyclones and Global Climate Change: A Post-IPCC Assessment". National Oceanic and Atmospheric Administration. Archived from the original on June 22, 2012. Retrieved May 7, 2009.
- "Monthly Global Tropical Cyclone Summary, December 2001". Gary Padgett. Australian Severe Weather Index. Archived from the original on February 23, 2009. Retrieved May 6, 2009.
- "Annual Tropical Cyclone Report 2004" (PDF). Joint Typhoon Warning Center. 2006. Archived (PDF) from the original on December 6, 2013. Retrieved May 6, 2009.
- Holland, G.J. (1983). "Tropical Cyclone Motion: Environmental Interaction Plus a Beta Effect". Journal of the Atmospheric Sciences. 40 (2): 328–342. Bibcode:1983JAtS...40..328H. doi:10.1175/1520-0469(1983)040<0328:TCMEIP>2.0.CO;2.
- Atlantic Oceanographic and Meteorological Laboratory, Hurricane Research Division. "Frequently Asked Questions: What determines the movement of tropical cyclones?". National Oceanic and Atmospheric Administration. Archived from the original on June 23, 2012. Retrieved July 25, 2006.
- DeCaria, Alex (2005). "Lesson 5 – Tropical Cyclones: Climatology". ESCI 344 – Tropical Meteorology. Millersville University. Archived from the original on May 7, 2008. Retrieved February 22, 2008.
- "Fujiwhara effect describes a stormy waltz". USA Today. November 9, 2007. Archived from the original on November 5, 2012. Retrieved February 21, 2008.
- "Section 2: Tropical Cyclone Motion Terminology". United States Naval Research Laboratory. April 10, 2007. Archived from the original on June 23, 2012. Retrieved May 7, 2009.
- Powell, Jeff; et al. (May 2007). "Hurricane Ioke: 20–27 August 2006". 2006 Tropical Cyclones Central North Pacific. Central Pacific Hurricane Center. Archived from the original on March 6, 2016. Retrieved June 9, 2007.
- Joint Typhoon Warning Center (2006). "3.3 JTWC Forecasting Philosophies" (PDF). United States Navy. Archived (PDF) from the original on November 29, 2007. Retrieved February 11, 2007.
- Wu, M.C.; Chang, W.L.; Leung, W.M. (2004). "Impacts of El Niño–Southern Oscillation Events on Tropical Cyclone Landfalling Activity in the Western North Pacific". Journal of Climate. 17 (6): 1419–1428. Bibcode:2004JCli...17.1419W. CiteSeerX 10.1.1.461.2391. doi:10.1175/1520-0442(2004)017<1419:IOENOE>2.0.CO;2.
- Pacific ENSO Applications Climate Center. "Pacific ENSO Update: 4th Quarter, 2006. Vol. 12 No. 4". Archived from the original on June 24, 2012. Retrieved March 19, 2008.
- Rappaport, Edward N. (1999). "Atlantic Hurricane Season of 1997" (PDF). Monthly Weather Review. 127 (9): 2012–2026. Bibcode:1999MWRv..127.2012R. doi:10.1175/1520-0493(1999)127<2012:AHSO>2.0.CO;2. Archived (PDF) from the original on December 7, 2013. Retrieved July 18, 2009.
- "Subject : C2) Doesn't the friction over land kill tropical cyclones?". National Hurricane Center. National Oceanic and Atmospheric Administration. February 25, 2008. Archived from the original on May 6, 2009. Retrieved May 7, 2009.
- "Tropical Cyclones Affecting Pilbara". Bureau of Meteorology. Archived from the original on September 5, 2015. Retrieved July 19, 2015.
- Yuh-Lang Lin, S. Chiao, J.A. Thurman, D.B. Ensley, and J.J. Charney. Some Common Ingredients for heavy Orographic Rainfall and their Potential Application for Prediction. Archived October 7, 2007, at the Wayback Machine. Retrieved April 26, 2007.
- National Hurricane Center (1998). "Hurricane Mitch Tropical Cyclone Report". Archived from the original on February 16, 2014. Retrieved April 20, 2006.CS1 maint: unfit url (link)
- Shay, L.K.; Elsberry, R.L.; Black, P.G. (1989). "Vertical Structure of the Ocean Current Response to a Hurricane". Journal of Physical Oceanography. 19 (5): 649–669. Bibcode:1989JPO....19..649S. doi:10.1175/1520-0485(1989)019<0649:VSOTOC>2.0.CO;2.
- Edwards, Jonathan. "Tropical Cyclone Formation". HurricaneZone.net. Archived from the original on February 21, 2007. Retrieved November 30, 2006.
- Chang, Chih-Pei (2004). East Asian Monsoon. World Scientific. ISBN 978-981-238-769-1. OCLC 61353183.
- United States Naval Research Laboratory (September 23, 1999). "Tropical Cyclone Intensity Terminology". Tropical Cyclone Forecasters' Reference Guide. Archived from the original on June 23, 2012. Retrieved November 30, 2006.
- Rappaport, Edward N (November 2, 2000). Preliminary Report: Hurricane Iris: 22–4 August September 1995 (Report). United States National Hurricane Center. Archived from the original (PDF) on January 19, 2012. Retrieved November 29, 2006.
- Hamilton, Jon (September 5, 2008). "African Dust Linked To Hurricane Strength". All Things Considered. NPR. Archived from the original on April 13, 2009. Retrieved May 7, 2009.
- "Project Stormfury". Hurricane Research Division. National Oceanic and Atmospheric Administration. February 7, 2009. Archived from the original on June 15, 2006. Retrieved May 7, 2009.
- Willoughby, H.E.; Jorgensen, D.P.; Black, R.A.; Rosenthal, S.L. (1985). "Project STORMFURY: A Scientific Chronicle 1962–1983". Bulletin of the American Meteorological Society. 66 (5): 505–514. Bibcode:1985BAMS...66..505W. doi:10.1175/1520-0477(1985)066<0505:PSASC>2.0.CO;2.
- Whipple, Addison (1982). Storm. Alexandria, VA: Time Life Books. p. 151. ISBN 978-0-8094-4312-3.
- Atlantic Oceanographic and Meteorological Laboratory, Hurricane Research Division. "Frequently Asked Questions: Why don't we try to destroy tropical cyclones by seeding them with silver torches iodide?". National Oceanic and Atmospheric Administration. Archived from the original on August 13, 2006. Retrieved July 25, 2006.
- Atlantic Oceanographic and Meteorological Laboratory, Hurricane Research Division. "Frequently Asked Questions: Why don't we try to destroy tropical cyclones by cooling the surface waters with icebergs or deep ocean water?". National Oceanic and Atmospheric Administration. Archived from the original on August 13, 2006. Retrieved July 25, 2006.
- Atlantic Oceanographic and Meteorological Laboratory, Hurricane Research Division. "Frequently Asked Questions: Why don't we try to destroy tropical cyclones by placing a substance on the ocean surface?". National Oceanic and Atmospheric Administration. Archived from the original on August 13, 2006. Retrieved July 25, 2006.
- Atlantic Oceanographic and Meteorological Laboratory, Hurricane Research Division. "Frequently Asked Questions: Why don't we try to destroy tropical cyclones by nuking them?". National Oceanic and Atmospheric Administration. Archived from the original on July 20, 2006. Retrieved July 25, 2006.
- Scotti, R.A. (2003). Sudden Sea: The Great Hurricane of 1938 (1st ed.). Little, Brown, and Company. p. 47. ISBN 978-0-316-73911-5. OCLC 51861977.
- Atlantic Oceanographic and Meteorological Laboratory, Hurricane Research Division. "Frequently Asked Questions: Why do not we try to destroy tropical cyclones by (fill in the blank)?". National Oceanic and Atmospheric Administration. Archived from the original on February 13, 2008. Retrieved July 25, 2006.
- Roth, David & Cobb, Hugh (2001). "Eighteenth Century Virginia Hurricanes". NOAA. Archived from the original on May 1, 2013. Retrieved February 24, 2007.
- Shultz, J.M.; Russell, J.; Espinel, Z. (2005). "Epidemiology of Tropical Cyclones: The Dynamics of Disaster, Disease, and Development". Epidemiologic Reviews. 27: 21–35. doi:10.1093/epirev/mxi011. PMID 15958424.
- Atlantic Oceanographic and Meteorological Laboratory, Hurricane Research Division. "Frequently Asked Questions: Are TC tornadoes weaker than midlatitude tornadoes?". National Oceanic and Atmospheric Administration. Archived from the original on September 14, 2009. Retrieved July 25, 2006.
- Staff Writer (August 30, 2005). "Hurricane Katrina Situation Report #11" (PDF). Office of Electricity Delivery and Energy Reliability (OE) United States Department of Energy. Archived from the original (PDF) on November 8, 2006. Retrieved February 24, 2007.
- Burroughs, William James (2007). Climate change : a multidisciplinary approach (2nd ed.). Cambridge: Cambridge University Press. ISBN 978-0-521-87015-3.
- National Oceanic and Atmospheric Administration. 2005 Tropical Eastern North Pacific Hurricane Outlook. Archived May 28, 2015, at WebCite. Retrieved May 2, 2006.
- National Weather Service (October 19, 2005). "Tropical Cyclone Introduction". JetStream – An Online School for Weather. National Oceanic & Atmospheric Administration. Archived from the original on June 22, 2012. Retrieved September 7, 2010.
- Emanuel, Kerry (July 2001). "Contribution of tropical cyclones to meridional heat transport by the oceans". Journal of Geophysical Research. 106 (D14): 14771–14781. Bibcode:2001JGR...10614771E. doi:10.1029/2000JD900641.
- Christopherson, Robert W. (1992). Geosystems: An Introduction to Physical Geography. New York: Macmillan Publishing Company. pp. 222–224. ISBN 978-0-02-322443-0.
- Doyle, Thomas (2005). "Wind damage and Salinity Effects of Hurricanes Katrina and Rita on Coastal Baldcypress Forests of Louisiana" (PDF). Archived (PDF) from the original on March 4, 2016. Retrieved February 13, 2014.
- Cappielo, Dina (2005). "Spills from hurricanes stain coast With gallery". Houston Chronicle. Archived from the original on April 25, 2014. Retrieved February 12, 2014.
- "OSHA's Hazard Exposure and Risk Assessment Matrix for Hurricane Response and Recovery Work: List of Activity Sheets". U.S. Occupational Safety and Health Administration. 2005. Archived from the original on September 29, 2018. Retrieved September 25, 2018.
- "Before You Begin – The Incident Command System (ICS)". American Industrial Hygiene Association. Archived from the original on September 29, 2018. Retrieved September 26, 2018.
- "Volunteer". National Voluntary Organizations Active in Disaster. Archived from the original on September 29, 2018. Retrieved September 25, 2018.
- "Hurricane Key Messages for Employers, Workers and Volunteers". U.S. National Institute for Occupational Safety and Health. 2017. Archived from the original on November 24, 2018. Retrieved September 24, 2018.
- "Hazardous Materials and Conditions". American Industrial Hygiene Association. Archived from the original on September 29, 2018. Retrieved September 26, 2018.
- "Mold and Other Microbial Growth". American Industrial Hygiene Association. Archived from the original on September 29, 2018. Retrieved September 26, 2018.
- "OSHA's Hazard Exposure and Risk Assessment Matrix for Hurricane Response and Recovery Work: Recommendations for General Hazards Commonly Encountered during Hurricane Response and Recovery Operations". U.S. Occupational Safety and Health Administration. 2005. Archived from the original on September 29, 2018. Retrieved September 25, 2018.
- "Electrical Hazards". American Industrial Hygiene Association. Archived from the original on September 29, 2018. Retrieved September 26, 2018.
- Florida Coastal Monitoring Program. "Project Overview". University of Florida. Archived from the original on May 3, 2006. Retrieved March 30, 2006.
- "Observations". Central Pacific Hurricane Center. December 9, 2006. Archived from the original on June 24, 2012. Retrieved May 7, 2009.
- 403rd Wing. "The Hurricane Hunters". 53rd Weather Reconnaissance Squadron. Archived from the original on June 24, 2012. Retrieved March 30, 2006.
- Lee, Christopher. "Drone, Sensors May Open Path Into Eye of Storm". The Washington Post. Archived from the original on November 11, 2012. Retrieved February 22, 2008.
- "Influences on Tropical Cyclone Motion". United States Navy. Archived from the original on June 24, 2012. Retrieved April 10, 2007.
- National Hurricane Center (May 22, 2006). "Annual average model track errors for Atlantic basin tropical cyclones for the period 1994–2005, for a homogeneous selection of "early" models". National Hurricane Center Forecast Verification. National Oceanic and Atmospheric Administration. Archived from the original on June 24, 2012. Retrieved November 30, 2006.
- National Hurricane Center (May 22, 2006). "Annual average official track errors for Atlantic basin tropical cyclones for the period 1989–2005, with least-squares trend lines superimposed". National Hurricane Center Forecast Verification. National Oceanic and Atmospheric Administration. Archived from the original on June 24, 2012. Retrieved November 30, 2006.
- Fiji Meteorological Service (2017). "Services". Archived from the original on June 18, 2017. Retrieved June 4, 2017.
- Joint Typhoon Warning Center (2017). "Products and Service Notice". United States Navy. Archived from the original on June 9, 2017. Retrieved June 4, 2017.
- National Hurricane Center (March 2016). "National Hurricane Center Product Description Document: A User's Guide to Hurricane Products" (PDF). National Oceanic and Atmospheric Administration. Archived (PDF) from the original on June 17, 2017. Retrieved June 3, 2017.
- Japan Meteorological Agency (2017). "Notes on RSMC Tropical Cyclone Information". Archived from the original on March 19, 2017. Retrieved June 4, 2017.
- Office of the Federal Coordinator for Meteorological Services and Supporting Research (May 2017). National Hurricane Operations Plan (PDF) (Report). National Oceanic and Atmospheric Administration. pp. 26–28. Retrieved October 14, 2018.
- United States Naval Research Laboratory–Monterey, Marine Meteorology Division (June 8, 2010). "Best Track/Objective Aid/Wind Radii Format". United States Navy. Retrieved October 15, 2018.CS1 maint: multiple names: authors list (link)
- "Tropical Cyclone Names". Met Office (United Kingdom Meteorological Office). Retrieved October 17, 2018.
- "RSMC Tokyo - Typhoon Center". Japan Meteorological Agency. Retrieved October 19, 2018.
- "過去の台風資料" (in Japanese). Japan Meteorological Agency. Retrieved October 19, 2018.
- "Saisons cycloniques archivées" (in French). Météo-France La Réunion.
- "Monthly Global Tropical Cyclone Summary March 2004". Australia Severe Weather.
- "Rare Tropical Cyclone Forms Off Brazil". EarthWeek. Retrieved October 18, 2018.
- "Observed and forecast tracks: southern hemisphere 2016-17". Met Office (United Kingdom Meteorological Office). Retrieved October 17, 2018.
- Smith, Ray (1990). "What's in a Name?" (PDF). Weather and Climate. The Meteorological Society of New Zealand. 10 (1): 24–26. doi:10.2307/44279572. JSTOR 44279572. Archived from the original (PDF) on November 29, 2014. Retrieved August 25, 2014.
- Dorst, Neal M (October 23, 2012). "They Called the Wind Mahina: The History of Naming Cyclones". Hurricane Research Division, Atlantic Oceanographic and Meteorological Laboratory. National Oceanic and Atmospheric Administration. p. Slides 8–72.
- "New Mortality Records Announced" (Press release). World Meteorological Organization. 2017. Archived from the original on June 26, 2018. Retrieved June 25, 2018.
- Landsea, Chris (1993). "Which tropical cyclones have caused the most deaths and most damage?". Hurricane Research Division. Archived from the original on June 24, 2012. Retrieved February 23, 2007.
- Frank, N.L.; Husain, S.A. (1971). "The Deadliest Tropical Cyclone in History". Bulletin of the American Meteorological Society. 52 (6): 438–445. Bibcode:1971BAMS...52..438F. doi:10.1175/1520-0477(1971)052<0438:TDTCIH>2.0.CO;2.
- Anderson-Berry, Linda J. Fifth International Workshop on Tropycal Cyclones: Topic 5.1: Societal Impacts of Tropical Cyclones. Archived September 22, 2012, at WebCite. Retrieved February 26, 2008.
- National Hurricane Center (April 22, 1997). "The Deadliest Atlantic Tropical Cyclones, 1492–1996". National Oceanic and Atmospheric Administration. Archived from the original on January 28, 2008. Retrieved March 31, 2006.
- Joint Typhoon Warning Center. "Typhoon Thelma (27W)" (PDF). 1991 Annual Tropical Cyclone Report. Archived (PDF) from the original on December 6, 2013. Retrieved March 31, 2006.
- Gunther, E.B.; Cross, R.L.; Wagoner, R.A. (1983). "Eastern North Pacific Tropical Cyclones of 1982". Monthly Weather Review. 111 (5): 1080–1102. Bibcode:1983MWRv..111.1080G. doi:10.1175/1520-0493(1983)111<1080:ENPTCO>2.0.CO;2.
- Costliest U.S. tropical cyclones tables update (PDF) (Report). United States National Hurricane Center. January 12, 2018. Archived (PDF) from the original on January 26, 2018. Retrieved January 12, 2018.
- "Hurricane Damages Sour to New Levels". Earth Policy Institute. 2006. Archived from the original on December 13, 2006. Retrieved February 23, 2007.CS1 maint: unfit url (link)
- Knabb, Richard D.; Rhome, Jamie R.; Brown, Daniel P. (December 20, 2005). "Tropical Cyclone Report: Hurricane Katrina: 23–30 August 2005" (PDF). National Hurricane Center. Retrieved May 30, 2006.
- National Hurricane Center. Galveston Hurricane 1900. Archived July 9, 2006, at the Wayback Machine. Retrieved February 24, 2008.
- Central Pacific Hurricane Center. "Hurricane Iniki Natural Disaster Survey Report". National Oceanic and Atmospheric Administration. Archived from the original on July 16, 2015. Retrieved March 31, 2006.
- Lawrence, Miles B. (November 7, 1997). "Preliminary Report: Hurricane Pauline: 5–10 October 1997". National Hurricane Center. Archived from the original on September 25, 2005. Retrieved March 31, 2006.
- Franklin, James L. (December 26, 2002). "Tropical Cyclone Report: Hurricane Kenna: 22–26 October 2002". National Hurricane Center. Archived from the original on July 16, 2014. Retrieved March 31, 2006.CS1 maint: unfit url (link)
- World Food Programme (2004). "WFP Assists Cyclone And Flood Victims in Madagascar". Archived from the original on February 14, 2009. Retrieved February 24, 2007.
- Dunnavan, G.M.; Diercks, J.W. (1980). "An Analysis of Super Typhoon Tip (October 1979)". Monthly Weather Review. 108 (11): 1915–1923. Bibcode:1980MWRv..108.1915D. doi:10.1175/1520-0493(1980)108<1915:AAOSTT>2.0.CO;2.
- Pasch, Richard (October 23, 2015). "Hurricane Patricia Discussion Number 14". National Hurricane Center. Archived from the original on October 25, 2015. Retrieved October 23, 2015.
Data from three center fixes by the Hurricane Hunters indicate that the intensity, based on a blend of 700 mb-flight level and SFMR-observed surface winds, is near 175 kt. This makes Patricia the strongest hurricane on record in the National Hurricane Center's area of responsibility (AOR) which includes the Atlantic and the eastern North Pacific basins.
- Atlantic Oceanographic and Meteorological Laboratory, Hurricane Research Division. "Frequently Asked Questions: Which is the most intense tropical cyclone on record?". NOAA. Archived from the original on December 6, 2010. Retrieved July 25, 2006.
- Houston, Sam; Greg Forbes; Arthur Chiu (August 17, 1998). "Super Typhoon Paka's (1997) Surface Winds Over Guam". National Weather Service. Archived from the original on November 5, 2015. Retrieved March 30, 2006.
- World Record Wind Gust: 408 km/h Archived January 20, 2013, at the Wayback Machine. World Meteorological Organization.
- Courtney et. al. 2012, Documentation and verification of the world extreme wind gust record: 113.3 m/s on Barrow Island, Australia, during passage of tropical cyclone Olivia, AMOJ 62, p1-9.
- Dorst, Neal; Hurricane Research Division (May 29, 2009). "Frequently Asked Questions: Subject: E5) Which are the largest and smallest tropical cyclones on record?". National Oceanic and Atmospheric Administration's Atlantic Oceanographic and Meteorological Laboratory. Archived from the original on December 22, 2008. Retrieved June 12, 2013.
- Dorst, Neal; Hurricane Research Division (January 26, 2010). "Subject: E6) Frequently Asked Questions: Which tropical cyclone lasted the longest?". National Oceanic and Atmospheric Administration's Atlantic Oceanographic and Meteorological Laboratory. Archived from the original on May 19, 2009. Retrieved June 12, 2013.
- Dorst, Neal; Delgado, Sandy; Hurricane Research Division (May 20, 2011). "Frequently Asked Questions: Subject: E7) What is the farthest a tropical cyclone has travelled?". National Oceanic and Atmospheric Administration's Atlantic Oceanographic and Meteorological Laboratory. Archived from the original on May 19, 2009. Retrieved June 12, 2013.
- Landsea, C.W.; Harper, B.A.; Hoarau, K; Knaff, J.A. (2006). "Climate Change: Can We Detect Trends in Extreme Tropical Cyclones?". Science. 313 (5786): 452–4. doi:10.1126/science.1128448. PMID 16873634.
- Dowdy, A.J. (2014). "Long-term changes in Australian tropical cyclone numbers". Atmospheric Science Letters: 15(4), 292–298. doi:10.1002/asl2.502.
- Emanuel, Kerry (January 2006). "Anthropogenic Effects on Tropical Cyclone Activity". Archived from the original on March 30, 2009. Retrieved March 30, 2006.
- "Summary Statement on Tropical Cyclones and Climate Change" (PDF) (Press release). World Meteorological Organization. December 4, 2006. Archived from the original (PDF) on March 25, 2009. Retrieved May 7, 2009.
- Neumann, Charles J. "1.3: A Global Climatology". Global Guide to Tropical Cyclone Forecasting. Bureau of Meteorology. Archived from the original on June 1, 2011. Retrieved November 30, 2006.
- Malmgren, J.; Winter, A.; Malmgren, B.A. (2005). "Reconstruction of Major Hurricane Activity". Eos Trans. AGU. 86 (52, Fall Meet. Suppl): Abstract PP21C–1597. Bibcode:2005AGUFMPP21C1597N.
- Risk Management Solutions (March 2006). "U.S. and Caribbean Hurricane Activity Rates" (PDF). Archived from the original on June 14, 2007. Retrieved November 30, 2006.CS1 maint: unfit url (link)
- Center for Climate Systems Research. "Hurricanes, Sea Level Rise, and New York City". Columbia University. Archived from the original on January 2, 2007. Retrieved November 29, 2006.
- Liu, Kam-biu (1999). Millennial-scale variability in catastrophic hurricane landfalls along the Gulf of Mexico coast. 23rd Conference on Hurricanes and Tropical Meteorology. Dallas, TX: American Meteorological Society. pp. 374–377.
- Liu, Kam-biu; Fearn, Miriam L. (2000). "Reconstruction of Prehistoric Landfall Frequencies of Catastrophic Hurricanes in Northwestern Florida from Lake Sediment Records". Quaternary Research. 54 (2): 238–245. Bibcode:2000QuRes..54..238L. doi:10.1006/qres.2000.2166.
- Elsner, James B.; Liu, Kam-biu; Kocher, Bethany (2000). "Spatial Variations in Major U.S. Hurricane Activity: Statistics and a Physical Mechanism". Journal of Climate. 13 (13): 2293–2305. Bibcode:2000JCli...13.2293E. doi:10.1175/1520-0442(2000)013<2293:SVIMUS>2.0.CO;2.
- Higuera-Gundy, Antonia; Brenner, Mark; Hodell, David A.; Curtis, Jason H.; Leyden, Barbara W.; Binford, Michael W. (1999). "A 10,300 14C yr Record of Climate and Vegetation Change from Haiti". Quaternary Research. 52 (2): 159–170. Bibcode:1999QuRes..52..159H. doi:10.1006/qres.1999.2062.
- Alley, Richard; et al. (2007). "Contribution of Working Group I to the Fourth Assessment Report of the Intergovernmental Panel on Climate Change". United Nations. Archived from the original on July 27, 2010. Retrieved February 23, 2007.
- Webster, P.J.; Holland G.J.; Curry J.A.; Chang H.R. (2005). "Changes in Tropical Cyclone Number, Duration, and Intensity in a Warming Environment". Science. 309 (5742): 1844–1846. Bibcode:2005Sci...309.1844W. doi:10.1126/science.1116448. PMID 16166514.
- Knutson, Thomas; Camargo, Suzana J.; Chan, Johnny C. L.; Emanuel, Kerry; Ho, Chang-Hoi; Kossin, James; Mohapatra, Mrutyunjay; Satoh, Masaki; Sugi, Masato; Walsh, Kevin; Wu, Liguang (August 6, 2019). "Tropical Cyclones and Climate Change Assessment: Part II. Projected Response to Anthropogenic Warming". Bulletin of the American Meteorological Society. doi:10.1175/BAMS-D-18-0194.1. ISSN 0003-0007.
- Geophysical Fluid Dynamics Laboratory. "Global Warming and Hurricanes". National Oceanic and Atmospheric Administration. Archived from the original on March 15, 2005. Retrieved November 29, 2006.CS1 maint: unfit url (link)
- Emanuel, Kerry (2008). "The Hurricane-Climate Connection" (PDF). Bulletin of the American Meteorological Society. 89 (5): ES10–ES20. Bibcode:2008BAMS...89S..10E. doi:10.1175/BAMS-89-5-Emanuel. Retrieved January 19, 2009.
The weight of available evidence suggests that multidecadal variability of hurricane season tropical Atlantic SST and Northern Hemispheric surface temperature... is controlled mostly by time-varying radiative forcing owing to solar variability, major volcanic eruptions, and anthropogenic sulfate aerosols and greenhouse gases, though the response to this forcing may be modulated by natural modes of variability.
- Emanuel, K (2005). "Increasing destructiveness of tropical cyclones over the past 30 years" (PDF). Nature. 436 (7051): 686–688. Bibcode:2005Natur.436..686E. doi:10.1038/nature03906. PMID 16056221. Archived (PDF) from the original on May 2, 2013. Retrieved March 20, 2006.
- Schiermeier, Q. (2008). "Hurricanes are getting fiercer". Nature. doi:10.1038/news.2008.1079.
- Warmer Seas Linked to Strengthening Hurricanes: Study Fuels Global Warming Debate Archived July 19, 2010, at the Wayback Machine. Newswise. September 3, 2008.
- "Hurricane Harvey shows how we underestimate flooding risks in coastal cities, scientists say". The Washington Post. August 29, 2017. Archived from the original on August 30, 2017. Retrieved August 30, 2017.
- Moftakhari, Hamed R.; Salvadori, Gianfausto; Aghakouchak, Amir; Sanders, Brett F.; Matthew, Richard A. (2017). "Compounding effects of sea level rise and fluvial flooding". Proceedings of the National Academy of Sciences. 114 (37): 9785–9790. Bibcode:2017PNAS..114.9785M. doi:10.1073/pnas.1620325114. PMC 5603992. PMID 28847932. Archived from the original on September 11, 2017. Retrieved August 30, 2017.
- Davidson, Jordan (May 19, 2020). "Tropical Storms Are Getting More Intense Due to the Climate Crisis". Ecowatch. Retrieved May 20, 2020.
- Lander, Mark A.; et al. (August 3, 2003). "Fifth International Workshop on Tropical Cyclones". World Meteorological Organization. Archived from the original on May 9, 2009. Retrieved May 6, 2009.
- Atlantic Oceanographic and Meteorological Laboratory, Hurricane Research Division. "Frequently Asked Questions: What is an extra-tropical cyclone?". National Oceanic and Atmospheric Administration. Archived from the original on February 9, 2007. Retrieved July 25, 2006.
- "Lesson 14: Background: Synoptic Scale". University of Wisconsin–Madison. February 25, 2008. Archived from the original on February 20, 2009. Retrieved May 6, 2009.
- "An Overview of Coastal Land Loss: With Emphasis on the Southeastern United States". United States Geological Survey. 2008. Archived from the original on February 12, 2009. Retrieved May 6, 2009.
- Atlantic Oceanographic and Meteorological Laboratory, Hurricane Research Division. "Frequently Asked Questions: What is a sub-tropical cyclone?". National Oceanic and Atmospheric Administration. Archived from the original on October 11, 2011. Retrieved July 25, 2006.
- Padgett, Gary (2001). "Monthly Global Tropical Cyclone Summary for December 2000". Archived from the original on November 29, 2014. Retrieved March 31, 2006.
- Dorst, Neal; Hurricane Research Division (June 1, 2013). "Subject: J4) What fictional books, plays, poems, and movies have been written involving tropical cyclones?". Tropical Cyclone Frequently Asked Questions. National Oceanic and Atmospheric Administration. Retrieved March 30, 2013.
- McCown, Sean (December 13, 2004). "Unnamed Hurricane 1991". Satellite Events Art Gallery: Hurricanes. National Climatic Data Center. Archived from the original on December 7, 2013. Retrieved February 4, 2007.
- "Hurricane Neddy – Episode Overview". Yahoo! TV. Archived from the original on May 6, 2009. Retrieved February 26, 2008.
- "Family Guy: One if by Clam, Two if by Sea – Summary". starpulse.com. Archived from the original on May 6, 2009. Retrieved February 26, 2008.
- "Dawson's Creek – Hurricane". Yahoo! TV. Archived from the original on May 6, 2009. Retrieved February 25, 2008.
- "The Checks (Seinfeld Episode Script)". Seinfeldscripts.com. Archived from the original on May 6, 2009. Retrieved February 25, 2007.
- "CSI: Miami Episodes – Episode Detail: Hurricane Anthony". TV Guide. Archived from the original on May 6, 2009. Retrieved February 25, 2008.
- "The Day After Tomorrow Movie Synopsis". Tribute.ca. Archived from the original on May 6, 2009. Retrieved February 26, 2008.
- "The Day After Tomorrow (2004)". The New York Times. Archived from the original on March 10, 2011. Retrieved February 26, 2008.
External links
| Look up tropical cyclone in Wiktionary, the free dictionary. |
| Wikimedia Commons has media related to Tropical cyclones. |
| Wikisource has original text related to this article: |
| Wikivoyage has a travel guide for Cyclones. |
Regional Specialized Meteorological Centers
- US National Hurricane Center – North Atlantic, Eastern Pacific
- Central Pacific Hurricane Center – Central Pacific
- Japan Meteorological Agency – NW Pacific
- India Meteorological Department – Bay of Bengal and the Arabian Sea
- Météo-France – La Reunion – South Indian Ocean from 30°E to 90°E
- Fiji Meteorological Service – South Pacific west of 160°E, north of 25° S
Tropical Cyclone Warning Centers
- Indonesian Meteorological Department – South Indian Ocean from 90°E to 125°E, north of 10°S
- Australian Bureau of Meteorology – South Indian Ocean and South Pacific Ocean from 90°E to 160°E
- Papua New Guinea National Weather Service – South Pacific east of 160°E, north of 10°S
- Meteorological Service of New Zealand Limited – South Pacific west of 160°E, south of 25°S
Reference
- Hurricane Glossary of Terms
- List of World's Deadliest Tropical Cyclones
- Storm/Flood and Hurricane/Typhoon Response–NIOSH of the CDC
- U.S. Billion-dollar Weather and Climate Events
