Effects of global warming
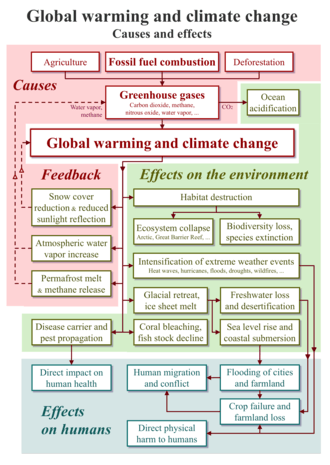
The effects of global warming or climate damage include far-reaching and long-lasting changes to the natural environment, to ecosystems and human societies caused directly or indirectly by human emissions of greenhouse gases. It also includes the economic and social changes which stem from living in a warmer world. Human caused climate change is one of the threats to sustainability[6][7].
| Some effects of climate change |
| Lua error: Section 'Biosphere' not found. |
Many physical impacts of global warming are already visible, including extreme weather events, glacier retreat,[8] changes in the timing of seasonal events[8] (e.g., earlier flowering of plants),[9] sea level rise, and declines in Arctic sea ice extent.[10] The future impact of global warming depends on the extent to which nations implement prevention efforts and reduce greenhouse gas emissions. Ocean acidification is not a consequence of global warming, but instead has the same cause: increasing atmospheric carbon dioxide.
Climate change has already impacted ecosystems and humans as well.[11] In combination with climate variability, it makes food insecurity worse in many places[12] and puts pressure on fresh water supply. This in combination with extreme weather events, leads to negative effects on human health. Rising temperatures threaten development because of negative effects on economic growth in developing countries.[12] The social impact of climate change will be further affected by society's efforts to prepare and adapt.[13][14] Global warming already contributes to migration in different parts of the world.[15]
Near-term climate change policies significantly affect long-term climate change impacts.[13][16] Stringent mitigation policies might be able to limit global warming (in 2100) to around 2 °C or below, relative to pre-industrial levels.[17][18] Without mitigation, increased energy demand and extensive use of fossil fuels[19] might lead to global warming of around 4 °C.[20][21] Higher magnitudes of global warming would be more difficult to adapt to,[22] and would increase the risk of negative impacts.[23]
Observed and future warming
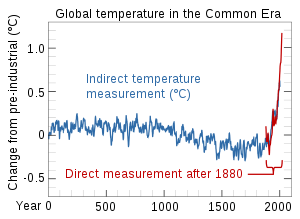
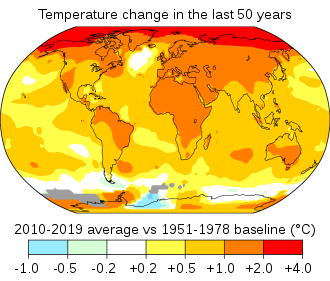
Global warming refers to the long-term rise in the average temperature of the Earth's climate system. It is a major aspect of climate change, and has been demonstrated by the instrumental temperature record which shows global warming of around 1 °C since the pre-industrial period,[26] although the bulk of this (0.9°C) has occurred since 1970.[27] A wide variety of temperature proxies together prove that the 20th century was the hottest recorded in the last 2,000 years. Compared to climate variability in the past, current warming is also more globally coherent, affecting 98% of the planet.[24][28] The impact on the environment, ecosystems, the animal kingdom, society and humanity depends on how much more the Earth warms.[29]
The Intergovernmental Panel on Climate Change (IPCC) Fifth Assessment Report concluded, "It is extremely likely that human influence has been the dominant cause of the observed warming since the mid-20th century."[30] This has been brought about primarily through the burning of fossil fuels which has led to a significant increase in the concentration of GHGs in the atmosphere.[31]
Emission scenarios
Individual consumers, corporate decision makers, the fossil fuel industries, government responses and the extent to which different countries agree to cooperate all have a profound impact on how much greenhouse gases the worlds emits. As the crisis and modelling techniques have evolved, the IPCC and other climate scientists have tried a number of different tools to estimate likely greenhouse gas emissions in the future.
Representative Concentration Pathways” (RCPs) were based on possible differences in radiative forcing occurring in the next 100 years but do not include socioeconomic “narratives” to go alongside them.[32] Another group of climate scientists, economists and energy system modellers took a different approach known as Shared Socioeconomic Pathways (SSPs); this is based on how socioeconomic factors such as population, economic growth, education, urbanisation and the rate of technological development might change over the next century. The SSPs describe five different trajectories which describe future climactic developments in the absence of new environmental policies beyond those in place today. They also explore the implications of different climate change mitigation scenarios.[33]
Warming projections
The range in temperature projections partly reflects the choice of emissions scenario, and the degree of "climate sensitivity".[34] The projected magnitude of warming by 2100 is closely related to the level of cumulative emissions over the 21st century (i.e. total emissions between 2000–2100).[35] The higher the cumulative emissions over this time period, the greater the level of warming is projected to occur.[35] Climate sensitivity reflects uncertainty in the response of the climate system to past and future GHG emissions.[34] Higher estimates of climate sensitivity lead to greater projected warming, while lower estimates lead to less projected warming.[36]
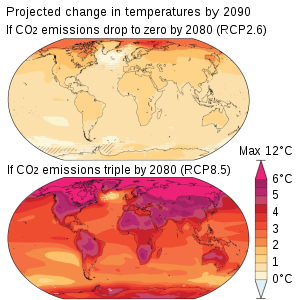
The IPCC's Fifth Report, released in 2014, states that relative to the average from year 1850 to 1900, global surface temperature change by the end of the 21st century is likely to exceed 1.5 °C and may well exceed 2 °C for all RCP scenarios except RCP2.6. It is likely to exceed 2°C for RCP6.0 and RCP8.5, and more likely than not to exceed 2°C for RCP4.5. The IPCC says the pathway with the highest greenhouse gas emissions, RCP 8.5, will lead to a temperature increase of about 4.3˚C by 2100.[37] Warming will continue beyond 2100 under all RCP scenarios except RCP2.6.[38]
The Climate Action Tracker also says mitigation policies currently in place around the world will result in about 3.0°C warming above pre-industrial levels. However, if current plans are not actually implemented, global warming is expected to reach 4.1°C to 4.8°C by 2100. CAT goes on to say there is a substantial gap between national plans and commitments and actual actions so far taken by governments around the world.[39]
Even if emissions were drastically reduced overnight, the warming process is irreversible because CO
2 takes hundreds of years to break down, and global temperatures will remain close to their highest level for at least the next 1,000 years.[40][41]
Warming in context of Earth's past
One of the methods scientists use to predict the effects of human-caused climate change, is to investigate past natural changes in climate.[42] Scientists have used various "proxy" data to assess changes in Earth's past climate or paleoclimate.[43] Sources of proxy data include historical records such as tree rings, ice cores, corals, and ocean and lake sediments.[43] The data shows that recent warming has surpassed anything in the last 2,000 years.[44]
By the end of the 21st century, temperatures may increase to a level not experienced since the mid-Pliocene, around 3 million years ago.[45] At that time, mean global temperatures were about 2–4 °C warmer than pre-industrial temperatures, and the global mean sea level was up to 25 meters higher than it is today.[46]
Physical impacts
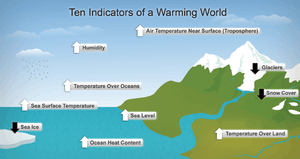
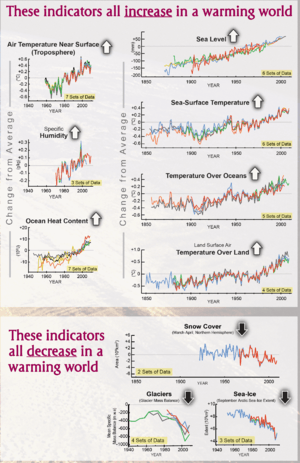
A broad range of evidence shows that the climate system has warmed.[48] Evidence of global warming is shown in the graphs (below right) from the US National Oceanic and Atmospheric Administration (NOAA). Some of the graphs show a positive trend, e.g., increasing temperature over land and the ocean, and sea level rise. Other graphs show a negative trend, such as decreased snow cover in the Northern Hemisphere, and declining Arctic sea ice, both of which are indicative of global warming. Evidence of warming is also apparent in living (biological) systems such as changes in distribution of flora and fauna towards the poles.[49]
Human-induced warming could lead to large-scale, abrupt and/or irreversible changes in physical systems.[50][51] An example of this is the melting of ice sheets, which contributes to sea level rise.[52] The probability of warming having unforeseen consequences increases with the rate, magnitude, and duration of climate change.[53]
Effects on weather
The main impact of global warming on the weather is an increase in extreme weather events such as heat waves, droughts, cyclones, blizzards and rainstorms. Of the 20 costliest climate and weather disasters that have occurred in the United States since 1980, eight have taken place since 2010, four of these in 2017 alone.[54] Such events will continue to occur more often and with greater intensity.[55] Episodes of intense precipitation contribute to flooding, soil erosion, landslides, and damage to structures and crops.[56]
Precipitation
Higher temperatures lead to increased evaporation and surface drying. As the air warms, its water-holding capacity also increases, particularly over the oceans. In general the air can hold about 7% more moisture for every 1 °C of temperature rise.[34] In the tropics, there's more than a 10% increase in precipitation for a 1 °C increase in temperature.[57] Changes have already been observed in the amount, intensity, frequency, and type of precipitation. Extreme precipitation events are sometimes the result of atmospheric rivers - wide paths of atmospheric moisture composed of condensed water vapor.[58] Widespread increases in heavy precipitation have occurred even in places where total rain amounts have decreased.[59]
Projections of future changes in precipitation show overall increases in the global average, but with substantial shifts in where and how precipitation falls.[34] Projections suggest a reduction in rainfall in the subtropics, and an increase in precipitation in subpolar latitudes and some equatorial regions.[60] In other words, regions which are dry at present will in general become even drier, while regions that are currently wet will in general become even wetter.[60] This projection does not apply to every locale, and in some cases can be modified by local conditions.[60] Although increased rainful will not occur everywhere, models suggest most of the world will have a 16-24% increase in heavy precipitation intensity by 2100.[61]
Temperatures
Over most land areas since the 1950s, it is very likely that at all times of year both days and nights have become warmer due to human activities.[62] There may have been changes in other climate extremes (e.g., floods, droughts and tropical cyclones) but these changes are more difficult to identify.[62] Projections suggest changes in the frequency and intensity of some extreme weather events.[62] In the U.S. since 1999, two warm weather records have been set or broken for every cold one.[63][64]
Some changes (e.g. more frequent hot days) will probably be evident in the near term (2016–2035), while other near-term changes (e.g. more intense droughts and tropical cyclones) are more uncertain.[62]
Future climate change will include more very hot days and fewer very cold days.[62] The frequency, length and intensity of heat waves will very likely increase over most land areas.[62] Higher growth in anthropogenic GHG emissions would cause more frequent and severe temperature extremes.[65] If GHG emissions grow a lot (IPCC scenario RCP8.5), already dry regions may have more droughts and less soil moisture.[66] Over most of the mid-latitude land masses and wet tropical regions, extreme precipitation events will very likely become more intense and frequent.[62]
Heat waves
Global warming boosts the probability of extreme weather events such as heat waves[67][68] where the daily maximum temperature exceeds the average maximum temperature by 5 °C (9 °F) for more than five consecutive days.[69]
In the last 30–40 years, heat waves with high humidity have become more frequent and severe. Extremely hot nights have doubled in frequency. The area in which extremely hot summers are observed has increased 50-100 fold. These changes are not explained by natural variability, and are attributed by climate scientists to the influence of anthropogenic climate change. Heat waves with high humidity pose a big risk to human health while heat waves with low humidity lead to dry conditions that increase wildfires. The mortality from extreme heat is larger than the mortality from hurricanes, lightning, tornadoes, floods, and earthquakes together.[70]
Tropical cyclones
Global warming not only causes changes in tropical cyclones, it may also make some impacts from them worse via sea level rise. The intensity of tropical cyclones (hurricanes, typhoons, etc.) is projected to increase globally, with the proportion of Category 4 and 5 tropical cyclones increasing. Furthermore, the rate of rainfall is projected to increase, but trends in the future frequency on a global scale are not yet clear.[71][72] Changes in tropical cyclones will probably vary by region.[71]
On land
Flooding
Warmer air holds more water vapor. When this turns to rain, it tends to come in heavy downpours potentially leading to more floods. A 2017 study found that peak precipitation is increasing between 5 and 10% for every one degree Celsius increase.[73] In the United States and many other parts of the world there has been a marked increase in intense rainfall events which have resulted in more severe flooding.[74] Estimates of the number of people at risk of coastal flooding from climate-driven sea-level rise varies from 190 million,[75] to 300 million or even 640 million in a worst-case scenario related to the instability of the Antarctic ice sheet.[76][77]
Wildfires
Prolonged periods of warmer temperatures typically cause soil and underbrush to be drier for longer periods, increasing the risk of wildfires. Hot, dry conditions increase the likelihood that wildfires will be more intense and burn for longer once they start.[78] Global warming has increased summertime air temperatures in California by over 3.5 degrees Fahrenheit such that the fire season (the time before the winter rains dampen the vegetation) has lengthened by 75 days over previous decades. As a result, since the 1980s, both the size and ferocity of fires in California have increased dramatically. Since the 1970s, the size of the area burned has increased fivefold while fifteen of the 20 largest fires in California have occurred since 2000.[79]
In Australia, the annual number of hot days (above 35°C) and very hot days (above 40°C) has increased significantly in many areas of the country since 1950. The country has always had bushfires but in 2019, the extent and ferocity of these fires increased dramatically.[80] For the first time catastrophic bushfire conditions were declared for Greater Sydney. New South Wales and Queensland declared a state of emergency but fires were also burning in South Australia and Western Australia.[81]
Cryosphere
The cryosphere is made up of those parts of the planet which are so cold, they are frozen and covered by snow or ice. This includes ice and snow on land such as the continental ice sheets in Greenland and Antarctica, as well as glaciers and areas of snow and permafrost; and ice found on water including frozen parts of the ocean, such as the waters surrounding Antarctica and the Arctic.[82] The cryosphere, especially the polar regions, is extremely sensitive to changes in global climate.[83]
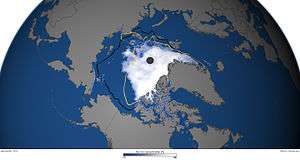
Arctic sea ice began to decline at the beginning of the twentieth century but the rate is accelerating. Since 1979, satellite records indicate the decline in summer sea ice coverage has been about 13% per decade.[84][85] The thickness of sea ice has also decreased by 66% or 2.0 m over the last six decades with a shift from permanent ice to largely seasonal ice cover.[86] While ice-free summers are expected to be rare at 1.5 °C degrees of warming, they are set to occur at least once every decade at a warming level of 2.0 °C.[87]
Since the beginning of the twentieth century, there has also been a widespread retreat of alpine glaciers,[88] and snow cover in the Northern Hemisphere.[89] During the 21st century, glaciers[90] and snow cover are projected to continue their widespread retreat.[91] The melting of the Greenland and West Antarctic ice sheets will continue to contribute to sea level rise over long time-scales.[92]
Changes in the cryosphere are projected to have social impacts.[93] For example, in some regions, glacier retreat could increase the risk of reductions in seasonal water availability.[94] Barnett et al. (2005)[95] estimated that more than one-sixth of the world's population rely on glaciers and snowpack for their water supply.
Oceans
Global warming is projected to have a number of effects on the oceans. Ongoing effects include rising sea levels due to thermal expansion and melting of glaciers and ice sheets, and warming of the ocean surface, leading to increased temperature stratification.[96] Other possible effects include large-scale changes in ocean circulation. The oceans also serve as a sink for carbon dioxide, taking up much that would otherwise remain in the atmosphere, but increased levels of CO
2 have led to ocean acidification. Furthermore, as the temperature of the oceans increases, they become less able to absorb excess CO
2. The oceans have also acted as a sink in absorbing extra heat from the atmosphere.[97]:4
Oxygen depletion
Warmer water cannot contain as much oxygen as cold water, so heating is expected to lead to less oxygen in the ocean. Other processes also play a role: stratification may lead to increases in respiration rates of organic matter, further decreasing oxygen content. The ocean has already lost oxygen, throughout the entire water column and oxygen minimum zones are expanding worldwide.[96] This has adverse consequences for ocean life.[98][99]
Ocean heat uptake
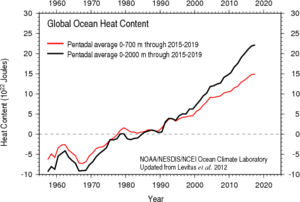
Oceans have taken up over 90% of the excess heat accumulated on Earth due to global warming.[100] The warming rate varies with depth: at a depth of a thousand metres the warming occurs at a rate of almost 0.4 °C per century (data from 1981-2019), whereas the warming rate at two kilometres depth is only half.[101] The increase in ocean heat content is much larger than any other store of energy in the Earth's heat balance and accounts for more than 90% of the increase in heat content of the Earth system, and has accelerated in the 1993-2017 period compared to 1969-1993.[102] In 2019 a paper published in the journal Science found the oceans are heating 40% faster than the IPCC predicted just five years before.[103][104]
As well as having effects on ecosystems (e.g. by melting sea ice affecting algae that grow on its underside), warming reduces the ocean's ability to absorb CO
2.[105] It is likely that the oceans warmed faster between 1993-2017 compared to the period starting in 1969.[106]
Sea level rise
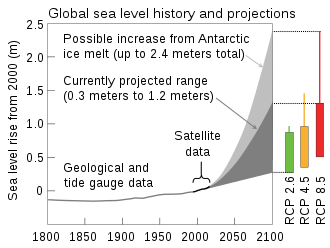
The IPCC's Special Report on the Ocean and Cryosphere concluded that global mean sea level rose by 0.16 metres between 1901 and 2016.[108] The rate of sea level rise since the industrial revolution in the 19th century has been larger than the rate during the previous two thousand years.[109]
Global sea level rise is accelerating, rising 2.5 times faster between 2006 and 2016 than it did during the 20th century.[110][111] Two main factors contribute to the rise. The first is thermal expansion: as ocean water warms, it expands. The second is from the melting of land-based ice in glaciers and ice sheets due to global warming.[112] Prior to 2007, thermal expansion was the largest component in these projections, contributing 70–75% of sea level rise.[113] As the impact of global warming has accelerated, melting from glaciers and ice sheets has become the main contributor.[114]
Even if emission of greenhouse gases stops overnight, sea level rise will continue for centuries to come.[115] In 2015, a study by Professor James Hansen of Columbia University and 16 other climate scientists said a sea level rise of three metres could be a reality by the end of the century.[116] Another study by scientists at the Royal Netherlands Meteorological Institute in 2017 using updated projections of Antarctic mass loss and a revised statistical method also concluded that, although it was a low probability, a three-metre rise was possible.[117] Rising sea levels will put hundreds of millions of people at risk in low-lying coastal areas in countries such as China, Bangladesh, India and Vietnam.[118]
Regional effects
Regional effects of global warming vary in nature. Some are the result of a generalised global change, such as rising temperature, resulting in local effects, such as melting ice. In other cases, a change may be related to a change in a particular ocean current or weather system. In such cases, the regional effect may be disproportionate and will not necessarily follow the global trend.
There are three major ways in which global warming will make changes to regional climate: melting or forming ice, changing the hydrological cycle (of evaporation and precipitation) and changing currents in the oceans and air flows in the atmosphere. The coast can also be considered a region, and will suffer severe impacts from sea level rise.
The Arctic, Africa, small islands, Asian megadeltas and the Middle East are regions that are likely to be especially affected by climate change.[119][120] Low-latitude, less-developed regions are at most risk of experiencing negative impacts due to climate change.[121] Developed countries are also vulnerable to climate change.[122] For example, developed countries will be negatively affected by increases in the severity and frequency of some extreme weather events, such as heat waves.[122]
Projections of future climate changes at the regional scale do not hold as high a level of scientific confidence as projections made at the global scale.[123]:9 It is, however, expected that future warming will follow a similar geographical pattern to that seen already, with the greatest warming over land and high northern latitudes, and least over the Southern Ocean and parts of the North Atlantic Ocean.[124] Land areas warm faster than ocean, and this feature is even stronger for extreme temperatures. For hot extremes, regions with the most warming include Central and South Europe and Western and central Asia.[125]
On humans
The effects of climate change, in combination with the sustained increases in greenhouse gas emissions, have led scientists to characterize it as a climate emergency.[126][127][128] Some climate researchers[129][130] and activists[131] have called it an existential threat to civilization.

The vulnerability and exposure of humans to climate change varies from one economic sector to another and will have different impacts in different countries. Wealthy industrialised countries, which have emitted the most CO2, have more resources and so are the least vulnerable to global warming.[134] Economic sectors that are likely to be affected include agriculture, human health, fisheries, forestry, energy, insurance, financial services, tourism, and recreation.[135] The quality and quantity of freshwater will likely be affected almost everywhere. Some people may be particularly at risk from climate change, such as the poor, young children and the elderly.[121][136]
According to a study published in May 2020, for every degree of temperature rise there will be 1 billion people that will live in areas with temperatures considered as too high for a normal life.[137][138]
Food security
Climate change will impact agriculture and food production around the world due to the effects of elevated CO2 in the atmosphere; higher temperatures; altered precipitation and transpiration regimes; increased frequency of extreme events; and modified weed, pest, and pathogen pressure.[140] Climate change is projected to negatively affect all four pillars of food security: not only how much food is available, but also how easy food is to access (prices), food quality and how stable the food system is.[141]
Food availability
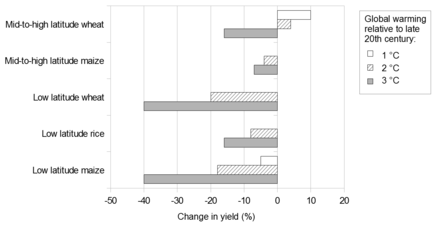
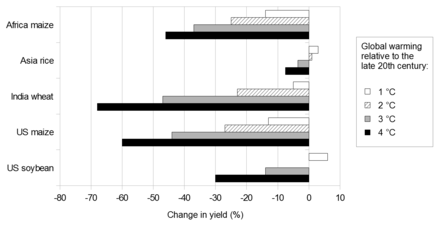
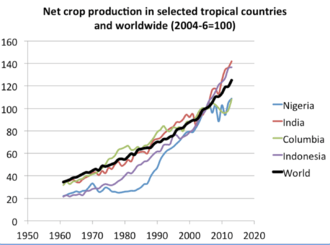
As of 2019, negative impacts have been observed for some crops in low-latitudes (maize and wheat), while positive impacts of climate change have been observed in some crops in high-latitudes (maize, wheat, and sugar beets).[143]
Using different methods to project future crop yields, a consistent picture emerges of global decreases in yield. Maize and soybean decrease with any warming, whereas rice and wheat production might peak at 3 °C of warming.[144]
In many areas, fisheries have already seen their catch decrease because of global warming and changes in biochemical cycles. In combination with overfishing, warming waters decrease the maximum catch potential.[145] Global catch potential is projected to reduce further in 2050 by less than 4% if emissions are reduced strongly, and by about 8% for very high future emissions, with growth in the Arctic Ocean.[146]
Other aspects of food security
Climate change impacts depend strongly on projected future social and economic development. As of 2019, an estimated 831 million people are undernourished.[147] Under a high emission scenario (RCP6.0), cereals are projected to become 1-29% more expensive in 2050 depending on the socioeconomic pathway, particularly affecting low-income consumers.[147] Compared to a no climate change scenario, this would put between 1-181 million extra people at risk of hunger.[147]
While CO
2 is expected to be good for crop productivity at lower temperatures, it does reduce the nutritional values of crops, with for instance wheat having less protein and less of some minerals.[148] It is difficult to project the impact of climate change on volatility of food prices and use, but most models projecting the future indicate that prices will become more volatile.[149]
Droughts and agriculture
Some evidence suggests that droughts have been occurring more frequently because of global warming; and they are expected to become more frequent and intense in Africa, southern Europe, the Middle East, most of the Americas, Australia, and Southeast Asia.[150] However, other research suggests that there has been little change in drought over the past 60 years.[151] Their impacts are aggravated because of increased water demand, population growth, urban expansion, and environmental protection efforts in many areas.[152] Droughts result in crop failures and the loss of pasture for livestock.[153]
Water security

A number of climate-related trends have been observed that affect water resources. These include changes in precipitation, the cryosphere and surface waters (e.g., changes in river flows).[154] Observed and projected impacts of climate change on freshwater systems and their management are mainly due to changes in temperature, sea level and precipitation variability.[155] Changes in temperature are correlated with variability in precipitation because the water cycle is reactive to temperature.[156] Temperature increases change precipitation patterns. Excessive precipitation leads to excessive sediment deposition, nutrient pollution, and concentration of minerals in aquifers.
The rising global temperature will cause sea level rise and will extend areas of salinization of groundwater and estuaries, resulting in a decrease in freshwater availability for humans and ecosystems in coastal areas. The rising sea level will push the salt gradient into freshwater deposits and will eventually pollute freshwater sources. The 2014 fifth IPCC assessment report concluded that:
- Water resources are projected to decrease in most dry subtropical regions and mid-latitudes, but increase in high latitudes. As streamflow becomes more variable, even regions with increased water resources can experience additional short-term shortages.[157]
- Per degree warming, a model average of 7% of the world population is expected to have at least 20% less renewable water resource.[158]
- Climate change is projected to reduce water quality before treatment. Even after conventional treatments, risks remain. The quality reduction is a consequence of higher temperatures, more intense rainfall, droughts and disruption of treatment facilities during floods.[158]
- Droughts that stress water supply are expected to increase in southern Europe and the Mediterranean region, central Europe, central and southern North America, Central America, northeast Brazil, and southern Africa.[159]
Health
Humans are exposed to climate change through changing weather patterns (temperature, precipitation, sea-level rise and more frequent extreme events) and indirectly through changes in water, air and food quality and changes in ecosystems, agriculture, industry and settlements and the economy.[160] Air pollution, wildfires, and heat waves caused by global warming have significantly affected human health,[161] and in 2007, the World Health Organization estimated 150,000 people were being killed by climate-change-related issues every year.[162]
A study by the World Health Organization[163] concluded that climate change was responsible for 3% of diarrhoea, 3% of malaria, and 3.8% of dengue fever deaths worldwide in 2004. Total attributable mortality was about 0.2% of deaths in 2004; of these, 85% were child deaths. The effects of more frequent and extreme storms were excluded from this study.
Projections
A 2014 study by the World Health Organization[164] estimated the effect of climate change on human health. Not all of the effects of climate change were included in their estimates, for example, the effects of more frequent and extreme storms were excluded. The report further assumed continued progress in health and growth. Even so, climate change was projected to cause an additional 250 000 additional deaths per year between 2030 and 2050.[165]
With high confidence, authors of the IPCC AR4 Synthesis report[166]:48 projected that climate change would bring some benefits in temperate areas, such as fewer deaths from cold exposure, and some mixed effects such as changes in range and transmission potential of malaria in Africa. Benefits were projected to be outweighed by negative health effects of rising temperatures, especially in developing countries.
Economic development is an important component of possible adaptation to climate change. Economic growth on its own, however, is not sufficient to insulate the world's population from disease and injury due to climate change.[160] Future vulnerability to climate change will depend not only on the extent of social and economic change, but also on how the benefits and costs of change are distributed in society.[167] For example, in the 19th century, rapid urbanization in western Europe led to heath plummeting.[167] Other factors important in determining the health of populations include education, the availability of health services, and public-health infrastructure.[160]
On mental health
In 2018, the American Psychological Association issued a report about the impact of climate change on mental health. It said that "gradual, long-term changes in climate can also surface a number of different emotions, including fear, anger, feelings of powerlessness, or exhaustion".[168] Generally this is likely to have the greatest impact on young people. California social scientist, Renee Lertzman, likens the climate-related stress now affecting teenagers and those in their 20s to Cold War fears that gripped young baby boomers who came of age under the threat of nuclear annihilation.[169] A 2018 study found that unusually hot days have profound effects on mental health and that global warming could contribute to approximately 26,000 more suicides in the U.S. by 2050.[170]
Migration
Gradual but pervasive environmental change and sudden natural disasters both influence the nature and extent of human migration but in different ways.
Slow onset
Slow-onset disasters and gradual environmental erosion such as desertification, reduction of soil fertility, coastal erosion and sea-level rise are likely to induce long term migration.[171] Migration related to desertification and reduced soil fertility is likely to be predominantly from rural areas in developing countries to towns and cities.[172]
Displacement and migration related to sea level rise will mostly affect those who live in cities near the coast. More than 90 US coastal cities are already experiencing chronic flooding and that number is expected to double by 2030.[173] Numerous cities in Europe will be affected by rising sea levels; especially in the Netherlands, Spain and Italy.[174] Coastal cities in Africa are also under threat due to rapid urbanization and the growth of informal settlements along the coast.[175] According to the World Economic Forum: "The coming decades will be marked by the rise of ex-cities and climate migrants."[176]
Low lying Pacific island nations including Fiji, Kiribati, Nauru, Micronesia, the Marshall Islands, the Solomon Islands, Vanuatu, Timor Leste and Tonga are especially vulnerable to rising seas. In July 2019, they issued a declaration "affirming that climate change poses the single greatest threat to the human rights and security of present and future generations of Pacific Island peoples"[177] and claim their lands could become uninhabitable as early as 2030.[178]
The United Nations says there are already 64 million human migrants in the world fleeing wars, hunger, persecution and the effects of global warming.[179] In 2018, the World Bank estimated that climate change will cause internal migration of between 31 and 143 million people as they escape crop failures, water scarcity, and sea level rise. The study only included Sub-Saharan Africa, South Asia, and Latin America.[180][181]
A 2020 study projects that regions inhabited by a third of the human population could become as hot as the hottest parts of the Sahara within 50 years without a change in patterns of population growth and migration, unless greenhouse gas emissions are reduced. The projected annual average temperature of above 29 °C for these regions would be outside the "human temperature niche" and the most affected regions have little adaptive capacity as of 2020.[182][183][184][185] The following matrix shows their projections for population-sizes outside the "human temperature niche" – and therefore potential emigrants of their regions – in different climate change scenarios and projections of population growth:[186]
| Demographic scenario (SSPs) | World population growth (billion) | World population size (billion) | Climate scenario | ||
|---|---|---|---|---|---|
| RCP 2.6 | RCP 4.5 | RCP 8.5 | |||
| mean projected global temperature rise of ~1.5 °C | - | mean projected global temperature rise of ~3.2 °C | |||
| Outside "human climate niche" (bn) | Outside "human climate niche" (bn) | Outside "human climate niche" (bn) | |||
| Zero growth | 0.00 | 7.26 | 1.06±0.30 | 1.62±0.42 | 2.37±0.43 |
| SSP1 | 0.98 | 8.24 | 1.20±0.34 | 1.84±0.48 | 2.69±0.49 |
| SSP2 | 2.20 | 9.46 | 1.38±0.39 | 2.12±0.55 | 3.09±0.56 |
| SSP3 | 3.88 | 11.14 | 1.63±0.46 | 2.49±0.65 | 3.64±0.66 |
| SSP4 | 2.20 | 9.46 | 1.38±0.39 | 2.12±0.55 | 3.09±0.56 |
| SSP5 | 1.21 | 8.47 | 1.24±0.35 | 1.89±0.49 | 2.76±0.50 |
Sudden onset
Sudden-onset natural disasters tend to create mass displacement, which may only be short term. However, Hurricane Katrina demonstrated that displacement can last a long time. Estimates suggest that a quarter of the one million people[187] displaced in the Gulf Coast region by Hurricane Katrina had not returned to their homes five years after the disaster.[188] Mizutori, the U.N. secretary-general's special representative on disaster risk reduction, says millions of people are also displaced from their homes every year as result of sudden-onset disasters such as intense heatwaves, storms and flooding. She says 'climate crisis disasters' are happening at the rate of one a week.[189]
Conflict
A 2013 study found that significant climatic changes were associated with a higher risk of conflict worldwide, and predicted that "amplified rates of human conflict could represent a large and critical social impact of anthropogenic climate change in both low- and high-income countries."[190] Similarly, a 2014 study found that higher temperatures were associated with a greater likelihood of violent crime, and predicted that global warming would cause millions of such crimes in the United States alone during the 21st century.[191]
However, a 2018 study in the journal Nature Climate Change found that previous studies on the relationship between climate change and conflict suffered from sampling bias and other methodological problems.[192] Factors other than climate change may be more important in affecting conflict. For example, Wilbanks et al. (2007)[193] suggested that major environmentally influenced conflicts in Africa were more to do with the relative abundance of resources, e.g., oil and diamonds, than with resource scarcity.
Despite these issues, military planners are concerned that global warming is a "threat multiplier". "Whether it is poverty, food and water scarcity, diseases, economic instability, or threat of natural disasters, the broad range of changing climatic conditions may be far reaching. These challenges may threaten stability in much of the world".[194] For example, the onset of the Arab Spring in 2010 was partly the result of a spike in wheat prices following crop losses from the 2010 Russian heat wave.[195][196]
Economic impact
Economic forecasts of the impact of global warming vary considerably. Researchers have warned that current economic modelling may seriously underestimate the impact of potentially catastrophic climate change, and point to the need for new models that give a more accurate picture of potential damages. Nevertheless, one recent study has found that potential global economic gains if countries implement mitigation strategies to comply with the 2°C target set at the Paris Agreement are in the vicinity of US$17 trillion per year up to 2100 compared to a very high emission scenario.[197]
Observed impacts
Global losses reveal rapidly rising costs due to extreme weather events since the 1970s.[198] Socio-economic factors have contributed to the observed trend of global losses, such as population growth and increased wealth.[199] Part of the growth is also related to regional climatic factors, e.g., changes in precipitation and flooding events. It is difficult to quantify the relative impact of socio-economic factors and climate change on the observed trend.[199] The trend does, however, suggest increasing vulnerability of social systems to climate change.[199][200]
A 2019 modelling study found that climate change had contributed towards global economic inequality. Wealthy countries in colder regions had either felt little overall economic impact from climate change, or possibly benefited, whereas poor hotter countries countries very likely grew less than if global warming had not occurred.[201] In 2019 global warming contributed to at least 15 sudden onset events that cost more than $1bn each in damage, with more than half of those costing more than $10bn each.[202]
Projected impacts
The total economic impacts from climate change are difficult to estimate, but increase for higher temperature changes.[203] For instance, total damages are estimated to be 90% less if global warming is limited to 1.5 °C compared to 3.66 °C, a warming level chosen to represent no mitigation.[204] One study found a 3.5% reduction in global GDP by the end of the century if warming is limited to 3 °C, excluding the potential effect of tipping points. Another study noted that global economic impact is underestimated by a factor of two to eight when tipping points are excluded from consideration.[204]
In 2019 the National Bureau of Economic Research found that an increase in average global temperature of 0.04 °C per year, without mitigation policies, would reduce world real GDP per person by 7.22% by 2100. Following the Paris Agreement, thereby limiting the temperature increase to 0.01 °C per year, reduces the loss to 1.07%.[205]
According to Oxford economics in high emission scenario the temperature will rise by 2 degrees, by the year 2050 what will reduce global GDP by 2.5% - 7.5%. By the year 2100 in this case, the temperature will rise by 4 degrees, what can reduce the global GDP by 30% in the worst case.[206]
Biological systems
.png)
Recent warming has strongly affected natural biological systems.[49] Species worldwide are moving poleward to colder areas. On land, species move to higher elevations, whereas marine species find colder water at greater depths.[208] Of the drivers with the biggest global impact on nature, climate change came third over the five decades before 2020, with change in land use and sea use, and direct exploitation of organisms having a larger impact.[209]
Significant disruptions of ecosystems are projected to increase with future climate change.[210] Examples of disruptions include disturbances such as fire, drought, pest infestation, invasion of species, storms, and coral bleaching events. The stresses caused by climate change, added to other stresses on ecological systems (e.g. land conversion, land degradation, harvesting, and pollution), threaten substantial damage to or complete loss of some unique ecosystems, and extinction of some critically endangered species.[210][211] Key interactions between species within ecosystems are often disrupted because species from one location do not move to colder habitats at the same rate, giving rise to rapid changes in the functioning of the ecosystem.[208]
Terrestrial and wetland systems
Climate change has been estimated to be a major driver of biodiversity loss in cool conifer forests, savannas, mediterranean-climate systems, tropical forests, and the Arctic tundra.[212] In other ecosystems, land-use change may be a stronger driver of biodiversity loss, at least in the near-term.[212] Beyond the year 2050, climate change may be the major driver for biodiversity loss globally.[212] Climate change interacts with other pressures such as habitat modification, pollution and invasive species. Interacting with these pressures, climate change increases extinction risk for a large fraction of terrestrial and freshwater species.[213] Between 1% and 50% of species in different groups were assessed to be at substantially higher risk of extinction due to climate change.[214]
For increases in global average temperature exceeding 1.5 to 2.5 °C (relative to global temperatures over the years 1980–1999)[215] and in concomitant atmospheric CO
2 concentrations, projected changes in ecosystems will have predominantly negative consequences for biodiversity and ecosystems goods and services, e.g. water and food supply.[216]
Ocean ecosystems
.jpg)
Warm water coral reefs are very sensitive to global warming and ocean acidification. Coral reefs provide a habitat for thousands of species and ecosystem services such as coastal protection and food. The resilience of reefs can be improved by curbing local pollution and overfishing: but most warm water coral reefs will disappear even if warming is kept to 1.5 °C.[217] Coral reefs are not the only framework organisms, organisms that build physical structures that form habitats for other sea creatures affected by climate change: mangroves and seagrass are considered to be at moderate risk for lower levels of global warming according to a literature assessment in the Special Report on the Ocean and Cryosphere in a Changing Climate.[218]
Abrupt or irreversible changes
Self-reinforcing feedbacks amplify and accelerate climate change.[219] The climate system exhibits threshold behaviour or tipping points when these feedbacks lead parts of the Earth system into a new state, such as the runaway loss of ice sheets or the destruction of too many forests.[220][221] Tipping points are studied using data from Earth's distant past and by physical modelling.[220] There is already moderate risk of global tipping points at 1 °C above pre-industrial temperatures, and that risk becomes high at 2.5 °C.[222]
Tipping points are "perhaps the most ‘dangerous’ aspect of future climate changes", leading to irreversible impacts on society.[223] Many tipping points are interlinked, so that triggering one may lead to a cascade of effects.[224] A 2018 study states that 45% of the environmental problems, including those caused by climate change are interconnected and make the risk of a "domino effect" bigger.[225][226]
Amazon rain forest
Rainfall that falls on the Amazon rainforest is recycled when it evaporates back into the atmosphere instead of running off away from the rainforest. This water is essential for sustaining the rainforest. Due to deforestation the rainforest is losing this ability, exacerbated by climate change which brings more frequent droughts to the area. The higher frequency of droughts seen in the first two decades of the 21st century signal that a tipping point from rainforest to savanna might be close.[227]
Greenland and West Antarctic Ice sheets
Future melt of the West Antarctic ice sheet is potentially abrupt under a high emission scenario, as a consequence of a partial collapse.[228] Part of the ice sheet is grounded on bedrock below sea level, making it possibly vulnerable to the self-enhancing process of marine ice sheet instability. A further hypothesis is that marine ice cliff instability would also contribute to a partial collapse, but limited evidence is available for its importance.[229] A partial collapse of the ice sheet would lead to rapid sea level rise and a local decrease in ocean salinity. It would be irreversible on a timescale between decades and millennia.[228]
In contrast to the West Antarctic ice sheet, melt of the Greenland ice sheet is projected to be taking place more gradually over millennia.[228] Sustained warming between 1 °C (low confidence) and 4 °C (medium confidence) would lead to a complete loss of the ice sheet, contributing 7 m to sea levels globally.[230] The ice loss could become irreversible due to a further self-enhancing feedback: the elevation-surface mass balance feedback. When ice melts on top of the ice sheet, the elevation drops. As air temperature is higher at lower altitude, this promotes further melt.[231]
Atlantic Meridional Overturning Circulation
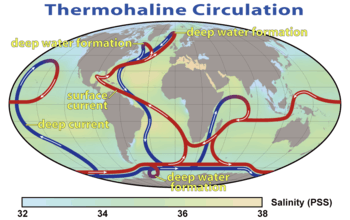
The Atlantic Meridional Overturning Circulation (AMOC). an important component of the Earth's climate system, is a northward flow of warm, salty water in the upper layers of the Atlantic and a southward flow of colder water in the deep Atlantic.[233]:5 Potential impacts associated with AMOC changes include reduced warming or (in the case of abrupt change) absolute cooling of northern high-latitude areas near Greenland and north-western Europe, an increased warming of Southern Hemisphere high-latitudes, tropical drying, as well as changes to marine ecosystems, terrestrial vegetation, oceanic CO
2 uptake, oceanic oxygen concentrations, and shifts in fisheries.[234]
According to a 2019 assessment in the IPCC's Special Report on the Ocean and Cryosphere in a Changing Climate it is very likely (greater than 90% probability, based on expert judgement) that the strength of the AMOC will decrease further over the course of the 21st century.[235] Warming is still expected to occur over most of the European region downstream of the North Atlantic Current in response to increasing GHGs, as well as over North America. With medium confidence, the IPCC stated that it is very unlikely (less than 10% probability) that the AMOC will collapse in the 21st century.[235] The potential consequences of such a collapse could be severe.[233]:5
Irreversibilities
Warming commitment to CO
2 concentrations.
2 concentrations.
If emissions of CO
2 were to be abruptly stopped and no negative emission technologies deployed, the Earth's climate would not start moving back to its pre-industrial state. Instead, temperatures would stay elevated at the same level for several centuries. After about a thousand years, 20% to 30% of human-emitted CO
2 will remain in the atmosphere, not taken up by the ocean or the land, committing the climate to warming long after emissions have stopped.[236] Techniques to remove CO
2 from the atmosphere, carbon dioxide removal, are a form of geoengineering. Pathways that keep global warming under 1.5 °C rely on large-scale removal of CO
2, which is uncertain and has clear risks.[237]
Irreversible impacts
There are a number of examples of climate change impacts that may be irreversible, at least over the timescale of many human generations.[238] These include the large-scale singularities such as the melting of the Greenland and West Antarctic ice sheets, and changes to the AMOC.[238] In biological systems, the extinction of species would be an irreversible impact.[238] In social systems, unique cultures may be lost due to climate change.[238] For example, humans living on atoll islands face risks due to sea level rise, sea surface warming, and increased frequency and intensity of extreme weather events.[239]
See also
- Anthropocene
- Risks to civilization, humans and planet Earth
- Indigenous Peoples Climate Change Assessment Initiative
- Environmental sociology
- Regional effects of global warming
- Arctic Climate Impact Assessment
- Effects of global warming on Australia
- Effects of global warming in China
- Effects of global warming on India
- Effects of global warming on South Asia
- Effects of global warming in Thailand
Citations
- NASA: The Causes of Climate Change 2019.
- NCA4: Climate Science Special Report 2017.
- IPCC SROCC 2019, p. 6.
- NASA: The Study of Earth as an Integrated System 2016.
- Kevin E. Trenberth and John T. Fasullo (5 October 2016). "Insights into Earth's Energy Imbalance from Multiple Sources". Journal of Climate. 29 (20): 7495–7505. Bibcode:2016JCli...29.7495T. doi:10.1175/JCLI-D-16-0339.1.
- Perspectives on climate change and sustainability. Climate Change 2007: Impacts, Adaptation and Vulnerability. Contribution of Working Group II to the Fourth Assessment Report of the Intergovernmental Panel on Climate Change (PDF). Cambridge, UK: IPCC. 2007. p. 819. Retrieved 12 June 2020.
- Rockström, Johan; et al. (2009). "Planetary Boundaries: Exploring the Safe Operating Space for Humanity". Ecology and Society. 14 (2). doi:10.5751/ES-03180-140232.
- Cramer, W., et al., Executive summary, in: Chapter 18: Detection and attribution of observed impacts (archived 18 October 2014), pp.982–984, in IPCC AR5 WG2 A 2014
- Settele, J., et al., Section 4.3.2.1: Phenology, in: Chapter 4: Terrestrial and inland water systems (archived 20 October 2014), p.291, in IPCC AR5 WG2 A 2014
- Hegerl, G.C.; et al. "Ch 9: Understanding and Attributing Climate Change". Executive Summary.CS1 maint: ref=harv (link), in IPCC AR4 WG1 2007
- IPCC (2018). "Summary for Policymakers" (PDF). IPCC SR15 2018. p. 5.
- Siegmund, Peter; Abermann, Jakob; Baddour, Omar; Canadell, Pep (2019). The Global Climate in 2015–2019. World Meteorological Society. p. 3.
- Oppenheimer, M., et al., Section 19.7.1: Relationship between Adaptation Efforts, Mitigation Efforts, and Residual Impacts, in: Chapter 19: Emergent risks and key vulnerabilities (archived 20 October 2014), pp.1080–1085, in IPCC AR5 WG2 A 2014
- Oppenheimer, M., et al., Section 19.6.2.2. The Role of Adaptation and Alternative Development Pathways, in: Chapter 19: Emergent risks and key vulnerabilities (archived 20 October 2014), pp.1072–1073, in IPCC AR5 WG2 A 2014
- Climate Change Is Already Driving Mass Migration Around the Globe, Natural Resources Defense Council, 25 January 2019
- Field, C.B., et al., Section A-3. The Decision-making Context, in: Technical summary (archived 18 October 2014), p.55, in IPCC AR5 WG2 A 2014
- SPM.4.1 Long‐term mitigation pathways, in: IPCC (2014). "Summary for Policymakers" (PDF). IPCC AR5 WG3 2014. p. 12.
- IPCC (2018). "Summary for Policymakers" (PDF). IPCC SR15 2018. p. 15.
- Clarke, L., et al., Section 6.3.1.3 Baseline emissions projections from fossil fuels and industry (pp.17–18 of final draft), in: Chapter 6: Assessing Transformation Pathways (archived 20 October 2014), in: IPCC AR5 WG3 2014
- Greenhouse Gas Concentrations and Climate Implications, p.14, in Prinn & Reilly 2014. The range given by Prinn and Reilly is 3.3 to 5.5 °C, with a median of 3.9 °C.
- SPM.3 Trends in stocks and flows of greenhouse gases and their drivers, in: Summary for Policymakers, p.8 (archived 2 July 2014), in IPCC AR5 WG3 2014. The range given by the Intergovernmental Panel on Climate Change is 3.7 to 4.8 °C, relative to pre-industrial levels (2.5 to 7.8 °C including climate uncertainty).
- Field, C.B., et al., Box TS.8: Adaptation Limits and Transformation, in: Technical summary (archived 18 October 2014), p.89, in IPCC AR5 WG2 A 2014
- Field, C.B., et al., Section B-1. Key Risks across Sectors and Regions, in: Technical summary (archived 18 October 2014), p.62, in IPCC AR5 WG2 A 2014
- Neukom, Raphael; Steiger, Nathan; Gómez-Navarro, Juan José; Wang, Jianghao; et al. (2019). "No evidence for globally coherent warm and cold periods over the preindustrial Common Era" (PDF). Nature. 571 (7766): 550–554. Bibcode:2019Natur.571..550N. doi:10.1038/s41586-019-1401-2. ISSN 1476-4687. PMID 31341300. .
- Kennedy, John; Ramasamy, Selvaraju; Andrew, Robbie; Arico, Salvatore; Bishop, Erin; Braathen, Geir (2019). WMO statement on the State of the Global Climate in 2018. Geneva: Chairperson, Publications Board, World Meteorological Organization. p. 6. ISBN 978-92-63-11233-0.
- Even 50-year-old climate models correctly predicted global warming, Science, American Association for the Advancement of Science, 4 December 2019
- Dunne, Daisy (2019-07-24). "Global extent of climate change is 'unparalleled' in past 2,000 years". Carbon Brief. Retrieved 2019-11-24.
- Schneider; et al., "Chapter 19: Assessing key vulnerabilities and the risk from climate change", Contribution of Working Group II to the Fourth Assessment Report of the Intergovernmental Panel on Climate Change, 2007, Sec. 19.3.1 Introduction to Table 19.1, in IPCC AR4 WG2 2007.
- IPCC (2013). "Summary for Policymakers" (PDF). IPCC AR5 WG1 2013.
- IPCC, "Summary for Policymakers", Human and Natural Drivers of Climate Change, Human and Natural Drivers of Climate Change, in IPCC AR4 WG1 2007.
- Explainer: How 'Shared Socioeconomic Pathways’ explore future climate change, Carbon Brief, 19 April 2018
- Riahi, Keywan; van Vuuren, Detlef P.; Kriegler, Elmar; Edmonds, Jae; O'Neill, Brian C.; Fujimori, Shinichiro; Bauer, Nico; Calvin, Katherine; Dellink, Rob; Fricko, Oliver; Lutz, Wolfgang; Popp, Alexander; Crespo Cuaresma, Jesus; Samir, KC; Leimbach, Marian; Jiang, Leiwen; Kram, Tom; Rao, Shilpa; Emmerling, Johannes; Ebi, Kristie; Hasegawa, Tomoko; Havlik, Petr; Humpenöder, Florian; Aleluia Da Silva, Lara; Smith, Steve; Stehfest, Elke; Bosetti, Valentina; Eom, Jiyong; Gernaat, David; Masui, Toshihiko; Rogelj, Joeri; Strefler, Jessica; Drouet, Laurent; Krey, Volker; Luderer, Gunnar; Harmsen, Mathijs; Takahashi, Kiyoshi; Baumstark, Lavinia; Doelman, Jonathan C.; Kainuma, Mikiko; Klimont, Zbigniew; Marangoni, Giacomo; Lotze-Campen, Hermann; Obersteiner, Michael; Tabeau, Andrzej; Tavoni, Massimo (2017). "The Shared Socioeconomic Pathways and their energy, land use, and greenhouse gas emissions implications: An overview". Global Environmental Change. 42: 153–168. doi:10.1016/j.gloenvcha.2016.05.009.
- Karl 2009 (ed.). "Global Climate Change" (PDF). Global Climate Change Impacts in the United States. pp. 22–24.
- United Nations Environment Programme (UNEP) (November 2010), "Ch 2: Which emissions pathways are consistent with a 2 °C or a 1.5 °C temperature limit?: Sec 2.2 What determines long-term temperature?" (PDF), The Emissions Gap Report: Are the Copenhagen Accord pledges sufficient to limit global warming to 2 °C or 1.5 °C? A preliminary assessment (advance copy), UNEP, archived from the original (PDF) on 2011-05-27, p.28. This publication is also available in e-book format Archived 2010-11-25 at the Library of Congress Web Archives
- "Box 8.1 Likelihood of exceeding a temperature increase at equilibrium, in: Ch 8: The Challenge of Stabilisation" (PDF), In Stern 2006, p. 195
- RCP 8.5: Business-as-usual or a worst-case scenario, Climate Nexus, retrieved from https://climatenexus.org/climate-change-news/rcp-8-5-business-as-usual-or-a-worst-case-scenario/
- IPCC, 2013: Summary for Policymakers. In: Climate Change 2013: The Physical Science Basis. Contribution of Working Group I to the Fifth Assessment Report of the Intergovernmental Panel on Climate Change p.20
- Temperatures, Climate Action Tracker
- Solomon, S.; et al. (January 28, 2009). "Irreversible climate change due to carbon dioxide emissions". Proceedings of the National Academy of Sciences of the United States of America. US National Academy of Sciences. 106 (6): 1704–9. Bibcode:2009PNAS..106.1704S. doi:10.1073/pnas.0812721106. PMC 2632717. PMID 19179281.
- Meehl, G.A.; et al., "Ch 10: Global Climate Projections", In IPCC AR4 WG1 2007, Sec 10.7.2 Climate Change Commitment to Year 3000 and Beyond to Equilibrium
- Joyce, Christopher (30 August 2018). "To Predict Effects Of Global Warming, Scientists Looked Back 20,000 Years". NPR.org. Retrieved 2019-12-29.
- Overpeck, J.T. (20 August 2008), NOAA Paleoclimatology Global Warming – The Story: Proxy Data, NOAA Paleoclimatology Program – NCDC Paleoclimatology Branch
- The 20th century was the hottest in nearly 2,000 years, studies show, 25 July 2019
- Jansen, E.; Overpeck, J.; Briffa, K. R.; Duplessy, J.-C.; et al. "Chapter 6: Palaeoclimate". In IPCC AR4 WG1 2007. Sec. 6.3.2 What Does the Record of the Mid-Pliocene Show?.
- Oppenheimer, M.; Glavovic, B.; Hinkel, J.; van de Wal, R.; et al. (2019). "Chapter 4: Sea Level Rise and Implications for Low Lying Islands, Coasts and Communities" (PDF). IPCC SROCC 2019. p. 323.
- NOAA 2010, p. 3
- Solomon; et al., "Technical Summary", Consistency Among Observations, TS.3.4 Consistency Among Observations, in IPCC AR4 WG1 2007.
- Rosenzweig; et al., "Chapter 1: Assessment of Observed Changes and Responses in Natural and Managed Systems", IPCC AR4 WG2 2007, Executive summary
-
IPCC, "Summary for Policymakers" Check
|chapter-url=value (help), Sec. 3. Projected climate change and its impacts Missing or empty|title=(help), in IPCC AR4 SYR 2007. - ESRL web team (26 January 2009). "ESRL News: New Study Shows Climate Change Largely Irreversible" (Press release). US Department of Commerce, NOAA, Earth System Research Laboratory (ESRL).
-
IPCC, "Summary for Policymakers", Magnitudes of impact Missing or empty
|title=(help), p.17, IPCC AR4 WG2 2007. - Executive Summary (PHP). Abrupt Climate Change: Inevitable Surprises. United States National Academy of Sciences. June 2002.
- The science connecting extreme weather to climate change, Fact sheet: Union of Concerned Scientists, June 2018.
- Effects of Global Warming, Live Science, 12 August 2017
- Early Warning Signs of Global Warming: Downpours, Heavy Snowfalls, and Flooding, Union of Concerned Scientists, 10 November 2003
- Global warming is increasing rainfall rates, The Guardian, 22 March 2017
- Atmospheric River Change, Climate Signals, 4 December 2018
- "Summary for policymakers", In IPCC SREX 2012, p. 8
- NOAA (February 2007), "Will the wet get wetter and the dry drier?" (PDF), GFDL Climate Modeling Research Highlights, Princeton, NJ: National Oceanic and Atmospheric Administration (NOAA) Geophysical Fluid Dynamics Laboratory (GFDL), 1 (5). Revision 10/15/2008, 4:47:16 PM.
- Explainer: What climate models tell us about future rainfall, Carbon Brief 19 January 2018
- IPCC (2013), Table SPM.1, in Summary for Policymakers, p. 5 (archived PDF), in IPCC AR5 WG1 2013
- Press, Associated (2019-03-19). "Record high US temperatures outpace record lows two to one, study finds". the Guardian. Retrieved 2019-03-19.
- Freedman, Andrew (2019-03-19). "The ratio of warm and cold temperature records is increasingly skewed - Axios". Axios. Retrieved 2019-03-19.
- Stocker, T.F., et al. (2013), Temperature Extremes, Heat Waves and Warm Spells, in: TFE.9, in: Technical Summary, p. 111 (archived PDF), in IPCC AR5 WG1 2013
- Stocker, T.F., et al. (2013), Floods and Droughts, in: TFE.9, in: Technical Summary, p. 112 (archived PDF), in IPCC AR5 WG1 2013
- Global Warming Makes Heat Waves More Likely, Study Finds 10 July 2012 NYT
- Hansen, J; Sato, M; Ruedy, R (2012). "Perception of climate change". Proceedings of the National Academy of Sciences. 109 (37): E2415–23. Bibcode:2012PNAS..109E2415H. doi:10.1073/pnas.1205276109. PMC 3443154. PMID 22869707.
- Heat wave: meteorology. Encyclopedia Britannica. Retrieved 1 April 2019.
- "Heat Waves: The Details". Climate Communication. Retrieved 16 August 2018.
- Christensen, J.H.,et al. (2013), Cyclones, in: Executive Summary, in: Chapter 14: Climate Phenomena and their Relevance for Future Regional Climate Change, p. 1220 (archived PDF), in IPCC AR5 WG1 2013
- Collins, M.; Sutherland, M.; Bouwer, L.; Cheong, S. M.; et al. (2019). "Chapter 6: Extremes, Abrupt Changes and Managing Risks" (PDF). IPCC SROCC 2019. p. 592.
- The peak structure and future changes of the relationships between extreme precipitation and temperature, Nature Climate Change volume 7, pp 268–274 (2017)
- Global warming is increasing rainfall rates, The Guardian, 22 March 2017
- Climate change: Sea level rise to affect 'three times more people', BBC News, 30 October 2019
- Rising sea levels pose threat to homes of 300m people – study, The Guardian, 29 October 2019
- New elevation data triple estimates of global vulnerability to sea-level rise and coastal flooding, Nature Communications, Vol 10, Article number: 4844 (2019)
- Is Global Warming Fueling Increased Wildfire Risks? Union of Concerned Scientists, 24 July 2018
- climate change is contributing to California’s fires, National Geographic
- As Smoke From Bushfires Chokes Sydney, Australian Prime Minister Dodges on Climate Change, Time 21 November 2019.
- The facts about bushfires and climate change, Climate Council, 13 November 2019
- What is the cryosphere? National ocean Service
- Getting to Know the Cryosphere, Earth Labs
- Impacts of a melting cryosphere ice loss around the world, Carbon Brief, 9 June 2011
- 2011 Arctic Sea Ice Minimum, archived from the original on 2013-06-14, retrieved 2013-03-20, in Kennedy 2012
- Kwok, R. (2018-10-12). "Arctic sea ice thickness, volume, and multiyear ice coverage: losses and coupled variability (1958–2018)". Environmental Research Letters. 13 (10): 105005. doi:10.1088/1748-9326/aae3ec. ISSN 1748-9326.
- IPCC (2018). "Summary for Policymakers" (PDF). IPCC SR15 2018. p. 8.
- Mass Balance of Mountain Glaciers in 2011, archived from the original on 2013-06-14, retrieved 2013-03-20, in Kennedy 2012
- 2011 Snow Cover in Northern Hemisphere, archived from the original on 2013-06-13, retrieved 2013-03-20, in Kennedy 2012
- Meehl, G.A.; et al., "Ch 10: Global Climate Projections", In IPCC AR4 WG1 2007, p. 776, Box 10.1: Future Abrupt Climate Change, ‘Climate Surprises’, and Irreversible Changes: Glaciers and ice caps.
- Meehl, G.A.; et al., "Ch 10: Global Climate Projections", In IPCC AR4 WG1 2007, pp. 770, 772, Sec 10.3.3.2 Changes in Snow Cover and Frozen Ground.
- Glavovic, B.; Oppenheimer, M.; Abd-Elgawad, A.; Cai, R.; et al. (2019). "Chapter 4: Sea Level Rise and Implications for Low Lying Islands, Coasts and Communities" (PDF). IPCC SROCC 2019. p. 234.
-
Some of these impacts are included in table SPM.2: "Summary for Policymakers", 3 Projected climate change and its impacts: Table SPM.2 Missing or empty
|title=(help), in IPCC AR4 SYR 2007, pp. 11–12 -
"Ch 3: Fresh Water Resources and their Management", Sec 3.4.3 Floods and droughts Missing or empty
|title=(help), in IPCC AR4 WG2 2007, p. 187 - Barnett, T.P.; et al. (17 November 2005), "Potential impacts of a warming climate on water availability in snow-dominated regions: Abstract" (PDF), Nature, 438 (7066): 303–9, Bibcode:2005Natur.438..303B, doi:10.1038/nature04141, PMID 16292301, archived from the original (PDF) on 1 October 2018, retrieved 20 March 2013
- Bindoff, N. L.; Cheung, W. W. L.; Kairo, J. G.; Arístegui, J.; et al. (2019). "Chapter 5: Changing Ocean, Marine Ecosystems, and Dependent Communities" (PDF). IPCC SROCC 2019. p. 471.
- State of the Climate in 2009, as appearing in the July 2010 issue (Vol. 91) of the Bulletin of the American Meteorological Society (BAMS). Supplemental and Summary Materials: Report at a Glance: Highlights (PDF). Website of the US National Oceanic and Atmospheric Administration: National Climatic Data Center. July 2010. Archived from the original (PDF) on 2011-02-22. Retrieved 2011-06-06.
- Crowley, T. J.; North, G. R. (May 1988). "Abrupt Climate Change and Extinction Events in Earth History". Science. 240 (4855): 996–1002. Bibcode:1988Sci...240..996C. doi:10.1126/science.240.4855.996. PMID 17731712.
- Shaffer, G. .; Olsen, S. M.; Pedersen, J. O. P. (2009). "Long-term ocean oxygen depletion in response to carbon dioxide emissions from fossil fuels". Nature Geoscience. 2 (2): 105–109. Bibcode:2009NatGe...2..105S. doi:10.1038/ngeo420.
- Bindoff, N. L.; Cheung, W. W. L.; Kairo, J. G.; Arístegui, J.; et al. (2019). "Chapter 5: Changing Ocean, Marine Ecosystems, and Dependent Communities" (PDF). IPCC SROCC 2019. p. 457.
- Bindoff, N. L.; Cheung, W. W. L.; Kairo, J. G.; Arístegui, J.; et al. (2019). "Chapter 5: Changing Ocean, Marine Ecosystems, and Dependent Communities" (PDF). IPCC SROCC 2019. p. 463.
- Bindoff, N. L.; Cheung, W. W. L.; Kairo, J. G.; Arístegui, J.; et al. (2019). "Chapter 5: Changing Ocean, Marine Ecosystems, and Dependent Communities" (PDF). IPCC SROCC 2019. p. 457.
- SHOOT, BRITTANY (11 January 2019). "New Climate Change Report Says Ocean Warming Is Far Worse Than Expected". Fortune. Retrieved 11 January 2019.
- Cheng, Lijing; Abraham, John; Hausfather, Zeke; E. Trenberth, Kevin (11 January 2019). "How fast are the oceans warming?". Science. 363 (6423): 128–129. doi:10.1126/science.aav7619. Retrieved 11 January 2019.
- Riebesell, Ulf; Körtzinger, Arne; Oschlies, Andreas (2009). "Sensitivities of marine carbon fluxes to ocean change". PNAS. 106 (49): 20602–20609. doi:10.1073/pnas.0813291106.
- Bindoff, N. L.; Cheung, W. W. L.; Kairo, J. G.; Arístegui, J.; Guinder, V. A.; et al. (2019). "Chapter 5: Changing Ocean, Marine Ecosystems, and Dependent Communities" (PDF). IPCC SROCC 2019. p. 450.
- NOAA 2017.
- IPCC (2019). "Summary for Policymakers" (PDF). IPCC SROCC 2019.
- IPCC AR% Summary for Policy Makers
- The Oceans We Know Won’t Survive Climate Change, The Atlantic, 25 September 2019
- Glavovic, B.; Oppenheimer, M.; Abd-Elgawad, A.; Cai, R.; et al. (2019). "Chapter 4: Sea Level Rise and Implications for Low Lying Islands, Coasts and Communities" (PDF). IPCC SROCC 2019. p. 4-3.
- Glavovic, B.; Oppenheimer, M.; Abd-Elgawad, A.; Cai, R.; et al. (2019). "Chapter 4: Sea Level Rise and Implications for Low Lying Islands, Coasts and Communities" (PDF). IPCC SROCC 2019. p. 4-9.
- Meehl; et al., "Chapter 10: Global Climate Projections", In IPCC AR4 WG1 2007, Executive summary.
- Glavovic, B.; Oppenheimer, M.; Abd-Elgawad, A.; Cai, R.; et al. (2019). "Chapter 4: Sea Level Rise and Implications for Low Lying Islands, Coasts and Communities" (PDF). IPCC SROCC 2019. p. 232.
- Mengel, Matthias; Nauels, Alexander; Rogelj, Joeri; Schleussner, Carl-Friedrich (2018-02-20). "Committed sea-level rise under the Paris Agreement and the legacy of delayed mitigation action". Nature Communications. 9 (1): 1–10. doi:10.1038/s41467-018-02985-8. ISSN 2041-1723.
- Simulation shows ‘unavoidable’ 3m Auckland sea level rise. TVNZ 25 July 2015.
- Sea levels could rise by more than three metres, shows new study, PhysOrg, 26 April 2017
- Amos, Jonathan (2019-10-30). "Sea level rise to affect 'three times more people'". Retrieved 2019-11-26.
- IPCC, "Synthesis report", Sec. 3.3.3 Especially affected systems, sectors and regions Missing or empty
|title=(help), in IPCC AR4 SYR 2007. - Waha, Katharina (April 2017). "Climate change impacts in the Middle East and Northern Africa (MENA) region and their implications for vulnerable population groups". Regional Environmental Change. doi:10.1007/s10113-017-1144-2. Retrieved 25 May 2020.
- Schneider, S.H.; et al., "Ch 19: Assessing Key Vulnerabilities and the Risk from Climate Change", In IPCC AR4 WG2 2007, p. 796, Distribution of Impacts, in: Sec 19.3.7 Update on 'Reasons for Concern'
- Schneider, S.H.; et al., "Ch 19: Assessing Key Vulnerabilities and the Risk from Climate Change", Sec 19.3.3 Regional vulnerabilities Missing or empty
|title=(help), in IPCC AR4 WG2 2007, p. 792 - US NRC (2008). Understanding and Responding to Climate Change. A brochure prepared by the US National Research Council (US NRC) (PDF). Washington DC: Board on Atmospheric Sciences and Climate, National Academy of Sciences. External link in
|publisher=(help) - IPCC, "Summary for Policymakers", Projections of Future Changes in Climate Missing or empty
|title=(help), in IPCC AR4 WG1 2007. - Hoegh-Guldberg, O.; Jacob, D.; Taylor, M.; Bindi, M.; et al. (2018). "Chapter 3: Impacts of 1.5ºC Global Warming on Natural and Human Systems" (PDF). IPCC SR15 2018. p. 190.
- World Scientists’ Warning of a Climate Emergency, In press with Bioscience Magazine.
- World Scientists’ Warning of a Climate Emergency, William J Ripple, Christopher Wolf, Thomas M Newsome, Phoebe Barnard, William R Moomaw. BioScience, biz088, https://doi.org/10.1093/biosci/biz088. A correction has been published: BioScience, biz152, https://doi.org/10.1093/biosci/biz152
- Scientists Around the World Declare ‘Climate Emergency’, Smithsonian Magazine, 5 November 2019
- Climate change could pose 'existential threat' by 2050: report, CNN, 5 June 2019.
- Climate tipping points — too risky to bet against, Nature, 27 November 2019.
- Greta Thunberg showed the world what it means to lead, The Guardian, 25 September 2019
- Xu, Chi; M. Lenton, Timothy; Svenning, Jens-Christian; Scheffer, Marten (26 May 2020). "Future of the human climate niche (figure 3)". Proceedings of the National Academy of Sciences of the United States of America. 117 (21): 11350–11355. doi:10.1073/pnas.1910114117. PMID 32366654. Retrieved 4 June 2020.
- Supplementary Materials Future of the human climate niche (PDF). p. 21. Retrieved 14 June 2020.
- Director, International (2018-10-15). "The Industries and Countries Most Vulnerable to Climate Change". International Director. Retrieved 2019-12-15.
- Hoegh-Guldberg, O.; Jacob, D.; Taylor, M.; Bindi, M.; et al. (2018). "Chapter 3: Impacts of 1.5ºC Global Warming on Natural and Human Systems" (PDF). IPCC SR15 2018. pp. 212–213, 228, 252.
- Wilbanks, T.J.; et al., "Ch 7: Industry, Settlement and Society", IPCC AR4 WG2 2007, pp. 373–376, Sec 7.4.2.5 Social issues and Sec 7.4.3 Key vulnerabilities
- Watts, Jonathan (5 May 2020). "One billion people will live in insufferable heat within 50 years – study". Guardian. Retrieved 7 May 2020.
- Xu, Chi; M. Lenton, Timothy; Svenning, Jens-Christian; Scheffer, Marten (26 May 2020). "Future of the human climate niche". Proceedings of the National Academy of Sciences of the United States of America. doi:10.1073/pnas.1910114117. Retrieved 4 June 2020.
- "FAOSTAT". faostat3.fao.org.
- Easterling; et al., "Chapter 5: Food, Fibre, and Forest Products", In IPCC AR4 WG2 2007, p. 282
- Mbow, C.; Rosenzweig, C.; Barioni, L. G.; Benton, T.; et al. (2019). "Chapter 5: Food Security" (PDF). IPCC SRCCL 2019. p. 442.
- Figure 5.1, p.161, in: Sec 5.1 FOOD PRODUCTION, PRICES, AND HUNGER, in: Ch 5: Impacts in the Next Few Decades and Coming Centuries, in: US NRC 2011
- IPCC (2019). "Summary for Policymakers" (PDF). IPCC SRCCL 2019. p. 8.
- Mbow, C.; Rosenzweig, C.; Barioni, L. G.; Benton, T.; Herrero, M.; et al. (2019). "Chapter 5: Food Security" (PDF). IPCC SRCCL 2019. p. 453.
- IPCC (2019). "Summary for Policymakers" (PDF). IPCC SROCC 2019. p. 12.
- Bindoff, N. L.; Cheung, W. W. L.; Kairo, J. G.; Arístegui, J.; Guinder, V. A.; et al. (2019). "Chapter 5: Changing Ocean, Marine Ecosystems, and Dependent Communities" (PDF). IPCC SROCC 2019. p. 504.
- Mbow, C.; Rosenzweig, C.; Barioni, L. G.; Benton, T.; et al. (2019). "Chapter 5: Food Security" (PDF). IPCC SRCCL 2019. p. 439.
- Mbow, C.; Rosenzweig, C.; Barioni, L. G.; Benton, T.; et al. (2019). "Chapter 5: Food Security" (PDF). IPCC SRCCL 2019. p. 439.
- Myers, Samuel S.; Smith, Matthew R.; Guth, Sarah; Golden, Christopher D.; Vaitla, Bapu; Mueller, Nathaniel D.; Dangour, Alan D.; Huybers, Peter (2017-03-20). "Climate Change and Global Food Systems: Potential Impacts on Food Security and Undernutrition". Annual Review of Public Health. 38 (1): 259–277. doi:10.1146/annurev-publhealth-031816-044356. ISSN 0163-7525.
- Dai, A. (2011). "Drought under global warming: A review". Wiley Interdisciplinary Reviews: Climate Change. 2: 45–65. Bibcode:2011AGUFM.H42G..01D. doi:10.1002/wcc.81.
- Sheffield, J.; Wood, E. F.; Roderick, M. L. (2012). "Little change in global drought over the past 60 years". Nature. 491 (7424): 435–438. Bibcode:2012Natur.491..435S. doi:10.1038/nature11575. PMID 23151587.
- Mishra, A. K.; Singh, V. P. (2011). "Drought modeling – A review". Journal of Hydrology. 403 (1–2): 157–175. Bibcode:2011JHyd..403..157M. doi:10.1016/j.jhydrol.2011.03.049.
- Ding, Y.; Hayes, M. J.; Widhalm, M. (2011). "Measuring economic impacts of drought: A review and discussion". Disaster Prevention and Management. 20 (4): 434–446. doi:10.1108/09653561111161752.
- Kundzewicz; et al., "Chapter 3: Fresh Water Resources and their Management", IPCC AR4 WG2 2007, Sec. 3.2 Current sensitivity/vulnerability
- Kundzewicz; et al., "Chapter 3: Fresh Water Resources and their Management", IPCC AR4 WG2 2007, Sec. 3.3 Executive summary
- "Freshwater (Lakes and Rivers) - The Water Cycle". usgs.gov. Retrieved 2019-05-01.
- Jiménez Cisneros, B. E.; Oki, T.; Arnell, N. W.; Benito, G.; et al. (2014). "Chapter 3: Freshwater Resources" (PDF). IPCC AR5 WG2 A 2014. p. 251.
- Jiménez Cisneros, B. E.; Oki, T.; Arnell, N. W.; Benito, G.; et al. (2014). "Chapter 3: Freshwater Resources" (PDF). IPCC AR5 WG2 A 2014. p. 232.
- Jiménez Cisneros, B. E.; Oki, T.; Arnell, N. W.; Benito, G.; et al. (2014). "Chapter 3: Freshwater Resources" (PDF). IPCC AR5 WG2 A 2014. p. 247.
- Confalonieri; et al., "Chapter 8: Human health", In IPCC AR4 WG2 2007, Executive summary, p. 393.
- Takaro, Tim K; Knowlton, Kim; Balmes, John R (August 2013). "Climate change and respiratory health: current evidence and knowledge gaps". Expert Review of Respiratory Medicine. 7 (4): 349–361. doi:10.1586/17476348.2013.814367. ISSN 1747-6348.
- The Top 100 Effects of Global Warming, Centre for American Progress, 24 September 2007
- WHO (2009). "Ch. 2, Results: 2.6 Environmental risks" (PDF). Global health risks: mortality and burden of disease attributable to selected major risks (PDF). Geneva, Switzerland: WHO Press. p. 24. ISBN 978-92-4-156387-1.
- World Health Organization (2014). Quantitative risk assessment of the effects of climate change on selected causes of death, 2030s and 2050s. World Health Organization. ISBN 978-92-4-150769-1.CS1 maint: uses authors parameter (link)
- COP24 special report: health and climate change. Geneva: World Health Organization; 2018. p.24. Cataloguing-in-Publication (CIP) data. CIP data are available at http://apps.who.int/iris.
- IPCC AR4 SYR 2007.
- Confalonieri; et al., "Chapter 8: Human health", In IPCC AR4 WG2 2007, Sec. 8.3.2 Future vulnerability to climate change
- Climate Change's Toll On Mental Health, APA, 29 March 2017
- 'Climate grief' takes toll on younger generations, SC Times, 21 April 2019.
- "Climate Change May Cause 26,000 More U.S. Suicides by 2050". The Atlantic. 2018-07-23.
- Environmental Migrants: Up To 1 Billion By 2050, Centro Euro-Mediterraneo sui Cambiamenti Climactici (CMCC)
- The World Bank, "Part One: Chapter 2: Reducing Human Vulnerability: Helping People Help Themselves" (PDF), Managing social risks: Empower communities to protect themselves, p. 109, WDR 2010.
- The world’s coastal cities are going under. Here’s how some are fighting back. World Economic Forum 16 January 2019
- Rising sea levels threat: a shrinking European coastline in 2100? Euronews 2 February 2018
- African countries aren’t doing enough to prepare for rising sea levels. The Conversation 16 September, 2018
- The world’s coastal cities are going under. Here’s how some are fighting back. World Economic Forum 16 January 2019
- Nadi Bay Declaration on the Climate Change Crisis in the Pacific, Nadi Bay, Fiji, 30 July 2019
- There's a Climate Threat Facing Pacific Islands That's More Dire Than Losing Land, Science Alert 19 September 2019
- Environmental Migrants: Up To 1 Billion By 2050, Centro Euro-Mediterraneo sui Cambiamenti Climactici (CMCC)
- 143 Million People May Soon Become Climate Migrants, National Geographic, 19 March 2018
- Kumari Rigaud, Kanta; de Sherbinin, Alex; Jones, Bryan; et al. (2018). Groundswell: preparing for internal climate migration (PDF). Washington DC: The World Bank. pp. xxi.
- "Climate change: More than 3bn could live in extreme heat by 2070". BBC News. 5 May 2020. Retrieved 6 May 2020.
- "'Near-unlivable' heat for one-third of humans within 50 years if greenhouse gas emissions are not cut". University of Exeter. 4 May 2020. Retrieved 6 May 2020.
- "Billions projected to suffer nearly unlivable heat in 2070". Phys.org. 4 May 2020. Retrieved 6 May 2020.
- Xu, Chi; Kohler, Timothy A.; Lenton, Timothy M.; Svenning, Jens-Christian; Scheffer, Marten (26 May 2020). "Future of the human climate niche". Proceedings of the National Academy of Sciences. 117 (21): 11350–11355. doi:10.1073/pnas.1910114117. ISSN 0027-8424. Retrieved 6 May 2020.
- "Future of the human climate niche" (PDF). Retrieved 25 June 2020.
- Facts for Features: Katrina Impact, The Data Centre, 26 August 2016
- Natural Disasters, Conflict, and Human Rights: Tracing the Connections, Brookings 3 March 2010.
- One Climate Crisis Disaster Occurs Every Week, U.N. Official Warns, The Smithsonian magazine, 8 July 2019
- Hsiang SM, Burke M, Miguel E (September 2013). "Quantifying the influence of climate on human conflict". Science. 341 (6151): 1235367. doi:10.1126/science.1235367. PMID 24031020.
- Ranson, M. (2014). "Crime, weather, and climate change". Journal of Environmental Economics and Management. 67 (3): 274–302. doi:10.1016/j.jeem.2013.11.008.
- Adams, Courtland; Ide, Tobias; Barnett, Jon; Detges, Adrien (2018-02-12). "Sampling bias in climate–conflict research". Nature Climate Change. 8 (3): 200–203. Bibcode:2018NatCC...8..200A. doi:10.1038/s41558-018-0068-2. ISSN 1758-6798.
-
Wilbanks; et al., "Chapter 7: Industry, settlement and society", Sec. 7.4.1 General effects: Box 7.2. Environmental migration Missing or empty
|title=(help), in IPCC AR4 WG2 2007. - Spaner, J S; LeBali, H (October 2013). "The Next Security Frontier". Proceedings of the United States Naval Institute. 139 (10): 30–35. Retrieved 23 Nov 2015.
- Perez, Ines (March 4, 2013). "Climate Change and Rising Food Prices Heightened Arab Spring". Republished with permission by Scientific American. Environment & Energy Publishing, LLC.
- Winkler, Elizabeth (July 27, 2017). "How the climate crisis could become a food crisis overnight". Washington Post.
- Kompas, Tom; Pham, Van Ha; Che, Tuong Nhu (2018). "The Effects of Climate Change on GDP by Country and the Global Economic Gains From Complying With the Paris Climate Accord". Earth's Future. 6 (8): 1153–1173. Bibcode:2018EaFut...6.1153K. doi:10.1029/2018EF000922. ISSN 2328-4277.
- Rosenzweig; et al., "Chapter 1: Assessment of observed changes and responses in natural and managed systems", Contribution of Working Group II to the Fourth Assessment Report of the Intergovernmental Panel on Climate Change, 2007, Sec. 1.3.8.5 Summary of disasters and hazards, in IPCC AR4 WG2 2007.
- IPCC, "Synthesis Report", Synthesis Report, Question 2, Sections 2.25 and 2.26, p. 55, IPCC TAR SYR 2001.
- Billion-Dollar Weather and Climate Disasters
- Diffenbaugh, Noah S.; Burke, Marshall (2019). "Global warming has increased global economic inequality". Proceedings of the National Academy of Sciences. 116 (20): 201816020. doi:10.1073/pnas.1816020116. ISSN 0027-8424.
- Climate crisis linked to at least 15 $1bn-plus disasters in 2019, The Guardian, 27 December 2019
-
- IPCC (2014). "Summary for Policymakers" (PDF). IPCC AR5 WG2 A 2014. p. 12.
- Hoegh-Guldberg, O.; Jacob, D.; Taylor, M.; Bindi, M.; et al. (2018). "Chapter 3: Impacts of 1.5ºC Global Warming on Natural and Human Systems" (PDF). IPCC SR15 2018. p. 256.
- E. Kahn, Matthew; Mohaddes, Kamiar; N.C. Ng, Ryan; Pesaran, M. Hashem; Raissi, Mehdi; Yang, Jui-Chung. "Long-Term Macroeconomic Effects of Climate Change: A Cross-Country Analysis". Retrieved 21 August 2019. Cite journal requires
|journal=(help) - Koning Beals, Rachel. "Global GDP will suffer at least a 3% hit by 2050 from unchecked climate change, say economists". MarketWatch. Retrieved 29 March 2020.
- Rosenzweig, C. (December 2008). "Science Briefs: Warming Climate is Changing Life on Global Scale". Website of the US National Aeronautics and Space Administration, Goddard Institute for Space Studies. Retrieved 2011-07-08.
- Pecl, Gretta T.; Araújo, Miguel B.; Bell, Johann D.; Blanchard, Julia; Bonebrake, Timothy C.; Chen, I.-Ching; Clark, Timothy D.; Colwell, Robert K.; Danielsen, Finn; Evengård, Birgitta; Falconi, Lorena (2017-03-31). "Biodiversity redistribution under climate change: Impacts on ecosystems and human well-being". Science. 355 (6332). doi:10.1126/science.aai9214. ISSN 0036-8075. PMID 28360268.
- Díaz, S.; et al. (2019). Summary for policymakers of the global assessment report on biodiversity and ecosystem services of the Intergovernmental Science-Policy Platform on Biodiversity and Ecosystem Services (PDF). Bonn, Germany: ISBES secretariat. p. 12.
- IPCC, "Synthesis Report, Question 3", In IPCC TAR SYR 2001, Sec. 3.18
- Van Riper, Charles. (2014) Projecting Climate Effects on Birds and Reptiles of the Southwestern United States. Reston, Va.: U.S. Department of the Interior, U.S. Geological Survey.
-
Fischlin; et al., "Chapter 4: Ecosystems, their properties, goods and services", Sec. 4.4.11 Global synthesis including impacts on biodiversity Missing or empty
|title=(help), in IPCC AR4 WG2 2007. - Settele, J.; Scholes, R.; Betts, R.; Bunn, S.; et al. (2014). "Chapter 4: Terrestrial and Inland Water Systems" (PDF). IPCC AR5 WG2 A 2014. p. 275.
- Settele, J.; Scholes, R.; Betts, R.; Bunn, S.; et al. (2014). "Chapter 4: Terrestrial and Inland Water Systems" (PDF). IPCC AR5 WG2 A 2014. p. 300.
-
IPCC, "Section 3: Projected climate change and its impacts" Check
|chapter-url=value (help), Sec. 3.3 Impacts of future climate changes Missing or empty|title=(help), in IPCC AR4 SYR 2007. -
IPCC, "Section 3: Projected climate change and its impacts" Check
|chapter-url=value (help), Sec. 3.3.1 Impacts on systems and sectors: Ecosystems Missing or empty|title=(help), in IPCC AR4 SYR 2007. - Hoegh-Guldberg, O.; Jacob, D.; Taylor, M.; Bindi, M.; et al. (2018). "Chapter 3: Impacts of 1.5ºC Global Warming on Natural and Human Systems" (PDF). IPCC SR15 2018. p. 179.
- Hoegh-Guldberg, O.; Jacob, D.; Taylor, M.; Bindi, M.; et al. (2018). "Chapter 3: Impacts of 1.5ºC Global Warming on Natural and Human Systems" (PDF). IPCC SR15 2018. p. 266.
- Kopp, R. E.; Hayhoe, K.; Easterling, D.R.; Hall, T.; et al. (2017). "Chapter 15: Potential Surprises: Compound Extremes and Tipping Elements". In USGCRP 2017. US National Climate Assessment. p. 411. Archived from the original on 20 August 2018.
- Kopp, R. E.; Hayhoe, K.; Easterling, D.R.; Hall, T.; et al. (2017). "Chapter 15: Potential Surprises: Compound Extremes and Tipping Elements". In USGCRP 2017. US National Climate Assessment. p. 417. Archived from the original on 20 August 2018.
- Carrington, Damian (27 November 2019). "Climate emergency: world 'may have crossed tipping points'". The Guardian.
- Hoegh-Guldberg, O.; Jacob, D.; Taylor, M.; Bindi, M.; et al. (2018). "Chapter 3: Impacts of 1.5ºC Global Warming on Natural and Human Systems" (PDF). IPCC SR15 2018. pp. 254, 258.
- Lontzek, Thomas S.; Cai, Yongyang; Judd, Kenneth L.; Lenton, Timothy M. (2015). "Stochastic integrated assessment of climate tipping points indicates the need for strict climate policy". Nature Climate Change. 5 (5): 441–444. doi:10.1038/nclimate2570. hdl:10871/35041. ISSN 1758-6798.
- Lenton, Timothy M.; Rockström, Johan; Gaffney, Owen; Rahmstorf, Stefan; Richardson, Katherine; Steffen, Will; Schellnhuber, Hans Joachim (2019). "Climate tipping points — too risky to bet against". Nature. 575 (7784): 592–595. Bibcode:2019Natur.575..592L. doi:10.1038/d41586-019-03595-0. PMID 31776487.
- C. Rocha, Juan; Peterson, Garry; Bodin, Örjan; Levin, Simon (21 December 2018). "Cascading regime shifts within and across scales". Science. 362 (6421): 1379. Bibcode:2018Sci...362.1379R. doi:10.1126/science.aat7850.
- Watts, Jonathan (20 December 2018). "Risks of 'domino effect' of tipping points greater than thought, study says". The Guardian. Retrieved 24 December 2018.
- Lovejoy, Thomas E.; Nobre, Carlos (2019). "Amazon tipping point: Last chance for action". Science Advances. 5 (12): eaba2949. doi:10.1126/sciadv.aba2949.
- Collins, M.; Sutherland, M.; Bouwer, L.; Cheong, S. M.; Frölicher, T.; et al. (2019). "Chapter 6: Extremes, Abrupt Changes and Managing Risks" (PDF). IPCC SROCC 2019. pp. 595–596.
- Meredith, M.; Sommerkorn, M.; Cassotta, S.; Derksen, C.; Ekaykin, A.; et al. (2019). "Chapter 3: Polar Regions" (PDF). IPCC SROCC 2019. pp. 244–246.
- Glavovic, B.; Oppenheimer, M.; Abd-Elgawad, A.; Cai, R.; et al. (2019). "Chapter 4: Sea Level Rise and Implications for Low Lying Islands, Coasts and Communities" (PDF). IPCC SROCC 2019. p. 363.
- Glavovic, B.; Oppenheimer, M.; Abd-Elgawad, A.; Cai, R.; Cifuentes-Jara, M.; et al. (2019). "Chapter 4: Sea Level Rise and Implications for Low Lying Islands, Coasts and Communities" (PDF). IPCC SROCC 2019. p. 362.
- Riebeek, H.. design by R. Simmon (May 9, 2006). "Paleoclimatology: Explaining the Evidence: Explaining Rapid Climate Change: Tales from the Ice". NASA Earth Observatory. Retrieved 2011-10-16.
- CCSP (2008b). Abrupt Climate Change. A report by the US Climate Change Science Program (CCSP) and the Subcommittee on Global Change Research. Reston, VA: US Geological Survey. Archived from the original on 2013-05-04.
- Schneider; et al., "Chapter 19: Assessing key vulnerabilities and the risk from climate change", In IPCC AR4 WG2 2007, Sec. 19.3.5.3 Possible changes in the North Atlantic meridional overturning circulation (MOC)
- Collins, M.; Sutherland, M.; Bouwer, L.; Cheong, S. M.; et al. (2019). "Chapter 6: Extremes, Abrupt Changes and Managing Risks" (PDF). IPCC SROCC 2019. p. 592.
- Collins, M.; Knutti, R.; Arblaster, J. M.; Dufresne, J.-L.; et al. (2013). "Chapter 12: Long-term Climate Change: Projections, Commitments and Irreversibility" (PDF). IPCC AR5 WG1 2013. p. 1104.
- Rogelj, J.; Shindell, D.; Jiang, K.; Fifta, S.; et al. (2018). "Chapter 2: Mitigation Pathways Compatible with 1.5°C in the Context of Sustainable Development" (PDF). IPCC SR15 2018. p. 95.
- Schneider; et al., "Chapter 19: Assessing key vulnerabilities and the risk from climate change", In IPCC AR4 WG2 2007, Sec.19.2 Criteria for selecting ‘key’ vulnerabilities: Persistence and reversibility
- Barnett, J; WN Adger (2003). "Climate dangers and atoll countries" (PDF). Climatic Change. Kluwer Academic Publishers. 61 (3): 321–337. doi:10.1023/b:clim.0000004559.08755.88. Archived from the original (PDF) on 2012-10-31. Retrieved 2011-10-31. This paper was published in 2001 as Tyndall Centre Working Paper 9 Archived 2012-06-16 at the Wayback Machine
References
- "Climate Science Special Report / Fourth National Climate Assessment (NCA4), Volume I". science2017.globalchange.gov. U.S. Global Change Research Program. Archived from the original on December 14, 2019.
- Committee on Ecological Impacts of Climate Change, US National Research Council (NRC) (2008). Ecological Impacts of Climate Change. 500 Fifth Street, NW Washington, DC 20001: The National Academies Press. ISBN 978-0-309-12710-3.CS1 maint: location (link)
- IPCC TAR WG1 (2001), Houghton, J.T.; Ding, Y.; Griggs, D.J.; Noguer, M.; van der Linden, P.J.; Dai, X.; Maskell, K.; Johnson, C.A. (eds.), Climate Change 2001: The Scientific Basis, Contribution of Working Group I to the Third Assessment Report of the Intergovernmental Panel on Climate Change, Cambridge University Press, ISBN 978-0-521-80767-8 (pb: 0-521-01495-6).
- IPCC AR4 WG1 (2007), Solomon, S.; Qin, D.; Manning, M.; Chen, Z.; Marquis, M.; Averyt, K.B.; Tignor, M.; Miller, H.L. (eds.), Climate Change 2007: The Physical Science Basis, Contribution of Working Group I to the Fourth Assessment Report of the Intergovernmental Panel on Climate Change, Cambridge University Press, ISBN 978-0-521-88009-1 (pb: 978-0-521-70596-7).
- IPCC AR4 WG2 (2007), Parry, M.L.; Canziani, O.F.; Palutikof, J.P.; van der Linden, P.J.; Hanson, C.E. (eds.), Climate Change 2007: Impacts, Adaptation and Vulnerability, Contribution of Working Group II to the Fourth Assessment Report of the Intergovernmental Panel on Climate Change, Cambridge University Press, ISBN 978-0-521-88010-7 (pb: 978-0-521-70597-4).
- IPCC AR4 SYR (2007), Core Writing Team; Pachauri, R.K; Reisinger, A. (eds.), Climate Change 2007: Synthesis Report, Contribution of Working Groups I, II and III to the Fourth Assessment Report of the Intergovernmental Panel on Climate Change, Geneva, Switzerland: IPCC, ISBN 978-92-9169-122-7.
- IPCC SREX (2012), Field, C.B.; et al. (eds.), Managing the Risks of Extreme Events and Disasters to Advance Climate Change Adaptation (SREX), Cambridge University Press, archived from the original on 2012-12-19. Summary for Policymakers available in Arabic, Chinese, French, Russian, and Spanish.
- IPCC AR5 WG1 (2013), Stocker, T.F.; et al. (eds.), Climate Change 2013: The Physical Science Basis. Working Group 1 (WG1) Contribution to the Intergovernmental Panel on Climate Change (IPCC) 5th Assessment Report (AR5), Cambridge University PressCS1 maint: ref=harv (link). Climate Change 2013 Working Group 1 website.
- IPCC AR5 WG2 A (2014), Field, C.B.; et al. (eds.), Climate Change 2014: Impacts, Adaptation, and Vulnerability. Part A: Global and Sectoral Aspects. Contribution of Working Group II (WG2) to the Fifth Assessment Report (AR5) of the Intergovernmental Panel on Climate Change (IPCC), Cambridge University Press, archived from the original on 16 April 2014CS1 maint: BOT: original-url status unknown (link). Archived
- IPCC AR5 WG3 (2014), Edenhofer, O.; et al. (eds.), Climate Change 2014: Mitigation of Climate Change. Contribution of Working Group III (WG3) to the Fifth Assessment Report (AR5) of the Intergovernmental Panel on Climate Change (IPCC), Cambridge University Press, archived from the original on 29 October 2014CS1 maint: BOT: original-url status unknown (link). Archived
- IPCC (2018). Masson-Delmotte, V.; Zhai, P.; Pörtner, H. O.; Roberts, D.; et al. (eds.). Global Warming of 1.5°C. An IPCC Special Report on the impacts of global warming of 1.5°C above pre-industrial levels and related global greenhouse gas emission pathways, in the context of strengthening the global response to the threat of climate change, sustainable development, and efforts to eradicate poverty (PDF). Intergovernmental Panel on Climate Change.
- IPCC (2019). Pörtner, H.-O.; Roberts, D.C.; Masson-Delmotte, V.; Zhai, P.; et al. (eds.). IPCC Special Report on the Ocean and Cryosphere in a Changing Climate (PDF). IPCC.
- IPCC (2019). Shukla, P.R.; Skea, J.; Calvo Biendia, E.; Masson-Delmotte, V.; et al. (eds.). Climate Change and Land. An IPCC Special Report on Climate Change, Desertification, Land Degradation, Sustainable Land Management, Food Security, and Greenhouse gas fluxes in Terrestrial Ecosystems (PDF). In press.
- Karl, Thomas R.; Melillo, Jerry M.; Peterson, Thomas C., eds. (2009). Global Climate Change Impacts in the United States (PDF). New York: Cambridge University Press. ISBN 978-0-521-14407-0.

- "The Causes of Climate Change". climate.nasa.gov. NASA. Archived from the original on December 21, 2019.
- "The Study of Earth as an Integrated System". nasa.gov. NASA. 2016. Archived from the original on November 2, 2016.
- Prinn, R.G.; J.M. Reilly (2014), 2014 Energy and Climate Outlook (PDF), Cambridge, Massachusetts: MIT Joint Program on the Science and Policy of Global Change, archived from the original on 22 October 2014CS1 maint: BOT: original-url status unknown (link). Archived . Report website (archived 2 November 2014).
- Stern, N. (2006), Stern Review Report on the Economics of Climate Change (pre-publication edition), London, UK: HM Treasury, archived from the original on 2010-04-07
- UK Royal Society and US National Academy of Sciences (2014), Climate Change: Evidence and Causes (PDF), archived from the original on 7 March 2014, retrieved 8 June 2014CS1 maint: BOT: original-url status unknown (link). . Report website (archived 31 May 2014).
- Staff of the International Bank for Reconstruction and Development / The World Bank (2010). World Development Report 2010: Development and Climate Change. 1818 H Street NW, Washington DC 20433: International Bank for Reconstruction and Development / The World Bank. doi:10.1596/978-0-8213-7987-5. ISBN 978-0-8213-7987-5.CS1 maint: location (link)
- US NRC (2011), Climate Stabilization Targets: Emissions, Concentrations, and Impacts over Decades to Millennia. A report by the US National Research Council (NRC), Washington, D.C.: National Academies Press, archived from the original on 2014-03-27CS1 maint: BOT: original-url status unknown (link) Archived
- USGCRP (2017). Wuebbles, D. J.; Fahey, D. W.; Hibbard, K. A.; Dokken, D. J.; Stewart, B. C.; Maycock, T. K. (eds.). Climate Science Special Report: Fourth National Climate Assessment, Volume I (Report). Washington, DC, USA: U.S. Global Change Research Program.
Further reading
- Watkins, K.; et al. (2007), Ugaz, C. (ed.), Human Development Report 2007/8: Fighting climate change: Human solidarity in a divided world, Basingstoke, UK: Palgrave Macmillan, ISBN 978-0-230-54704-9
- National Academies of Sciences, Engineering, and Medicine (2016). Attribution of Extreme Weather Events in the Context of Climate Change (Report). Washington, DC: The National Academies Press. doi:10.17226/21852.CS1 maint: uses authors parameter (link)
External links
| Wikimedia Commons has media related to Effects of global warming. |
- Physical impacts
- "Climate Change" at the Library of Congress Web Archives (archived 2014-12-08). World Meteorological Organization.
- NASA Nex Climate Data and Prediction Models
- Social, economic and ecological impacts
- Climate change on the United Nations Economic and Social Development (UNESD) Division for Sustainable Development website.
- General
- List of United Nations Functional Commissions and Expert Bodies related to climate change
- ClimateClock: time left to reaching the 1,5°C threshold
- IRIN, the humanitarian news and analysis service of the UN Office for the Coordination of Humanitarian Affairs: "What climate change does", "How climate change works", and "Gathering Storm – the humanitarian impact of climate change"
- Videos:
- "Educational Forum: Arctic Climate Impact". Panel discussion with James J. McCarthy, Professor at Harvard University, and Author; Paul R. Epstein, M.D., instructor in medicine at Harvard Medical School; and Ross Gelbspan, Pulitzer Prize–winning journalist and author. Massachusetts School of Law.
- "How we know humans are changing the climate and Why climate change is a clear and present danger". Interviews with Christopher Field and Michael MacCracken. Christopher Field is the director of the Department of Global Ecology at the Carnegie Institution of Washington, professor of biology and environmental earth system science at Stanford University, and the Working Group II Co-Chair for the Intergovernmental Panel on Climate Change. Michael MacCracken is the chief scientist for Climate Change Programs at the Climate Institute and a co-author and contributing author for various chapters in the IPCC assessment reports. Climate Progress website, February 5, 2010.
- 25 Devastating Effects Of Climate Change—Business Insider (October 11, 2014)
| |||||||||||||
| |||||||||||||
| |||||||||||||
| |||||||||||||
| |||||||||||||
| |||||||||||||
| |||||||||||||