Radiative forcing
Radiative forcing or climate forcing is the difference between insolation (sunlight) absorbed by the Earth and energy radiated back to space.[1] Changes to Earth's radiative equilibrium, that cause temperatures to rise or fall over decadal periods, are called climate forcings.[2] Positive radiative forcing means Earth receives more incoming energy from sunlight than it radiates to space. This net gain of energy will cause warming. Conversely, negative radiative forcing means that Earth loses more energy to space than it receives from the sun, which produces cooling. A system in thermal equilibrium has zero radiative forcing.
Radiative forcing is meaningfully quantified at the tropopause and at the top of the stratosphere as flux of watts per square meter of the Earth's surface. Radiative forcing varies with insolation, the atmospheric concentrations of radiatively active gases, commonly known as greenhouse gases, and aerosols.
Radiation balance
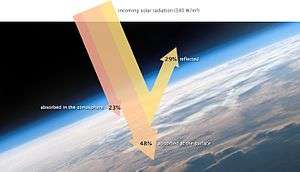
Almost all of the energy that affects Earth's climate is received as radiant energy from the Sun. The planet and its atmosphere absorb and reflect some of the energy, while long-wave energy is radiated back into space. The balance between absorbed and radiated energy determines the average global temperature. Because the atmosphere absorbs some of the re-radiated long-wave energy, the planet is warmer than it would be in the absence of the atmosphere: see greenhouse effect.
The radiation balance is altered by such factors as the intensity of solar energy, reflectivity of clouds or gases, absorption by various greenhouse gases or surfaces and heat emission by various materials. Any such alteration is a radiative forcing, and changes the balance. This happens continuously as sunlight hits the surface, clouds and aerosols form, the concentrations of atmospheric gases vary and seasons alter the groundcover.
IPCC usage
The Intergovernmental Panel on Climate Change (IPCC) AR4 report defines radiative forcings as:[4]
"Radiative forcing is a measure of the influence a factor has in altering the balance of incoming and outgoing energy in the Earth-atmosphere system and is an index of the importance of the factor as a potential climate change mechanism. In this report radiative forcing values are for changes relative to preindustrial conditions defined at 1750 and are expressed in Watts per square meter (W/m2)."
In simple terms, radiative forcing is "...the rate of energy change per unit area of the globe as measured at the top of the atmosphere."[5] In the context of climate change, the term "forcing" is restricted to changes in the radiation balance of the surface-troposphere system imposed by external factors, with no changes in stratospheric dynamics, no surface and tropospheric feedbacks in operation (i.e., no secondary effects induced because of changes in tropospheric motions or its thermodynamic state), and no dynamically induced changes in the amount and distribution of atmospheric water (vapour, liquid, and solid forms).
Climate sensitivity
Radiative forcing can be used to estimate a subsequent change in steady-state (often denoted "equilibrium") surface temperature (ΔTs) arising from that forcing via the equation:

where λ is commonly denoted the climate sensitivity parameter, usually with units K/(W/m2), and ΔF is the radiative forcing in W/m2.[6] A typical value of λ, 0.8 K/(W/m2), gives an increase in global temperature of about 1.6 K above the 1750 reference temperature due to the increase in CO
2 over that time (278 to 405 ppm, for a forcing of 2.0 W/m2), and predicts a further warming of 1.4 K above present temperatures if the CO
2 mixing ratio in the atmosphere were to become double its pre-industrial value; both of these calculations assume no other forcings.[7]
Historically, radiative forcing displays the best predictive capacity for specific types of forcing such as greenhouse gases.[8] It is less effective for other anthropogenic influences like soot. A new framework called ‘effective radiative forcing’ or ERF removes the effect of rapid adjustments within the atmosphere that are unrelated to longer term surface temperature responses[8]. ERF means different factors driving climate change can be placed onto a level playing field to enable comparison of their effects and a more consistent view of how global surface temperature responds to various types of human forcing[8].
Sample calculations

2, as calculated by radiative transfer code Modtran. Red lines are Planck curves.
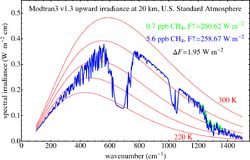
4, as calculated by radiative transfer code Modtran.
Solar forcing
Radiative forcing (measured in watts per square meter) can be estimated in different ways for different components. For solar irradiance (i.e. "solar forcing"), the radiative forcing is simply the change in the average amount of solar energy absorbed per square meter of the Earth's area. Approximating the Earth as a sphere, the Earth's cross-sectional area exposed to the Sun () is equal to 1/4 of the surface area of the Earth (), the solar input per unit area is one quarter the change in solar intensity. Since some radiation is reflected, this must be multiplied by the fraction of incident sunlight that is absorbed, , where R is the reflectivity (albedo) of the Earth —approximately 0.3, so F is approximately equal to 0.7. Thus, the solar forcing is the change in the solar intensity divided by 4 and multiplied by 0.7.


Likewise, a change in albedo will produce a solar forcing equal to the change in albedo divided by 4 multiplied by the solar constant.
Forcing due to atmospheric gas
For a greenhouse gas, such as carbon dioxide, radiative transfer codes that examine each spectral line for atmospheric conditions can be used to calculate the change ΔF as a function of changing concentration. These calculations might be simplified into an algebraic formulation that is specific to that gas.
For instance, a proposed simplified first-order approximation expression for carbon dioxide would be:

where C is the CO
2 concentration in parts per million by volume and C0 is the reference concentration.[9] The relationship between carbon dioxide and radiative forcing is logarithmic,[10] at concentrations up to around eight times the current value, and thus increased concentrations have a progressively smaller warming effect. Some claim that at higher concentrations, however, it becomes supra-logarithmic so that there is no saturation in the absorption of infrared radiation by CO
2.[11]
A different formula might apply for other greenhouse gases such as methane and N
2O (square-root dependence) or CFCs (linear), with coefficients that may be found e.g. in the IPCC reports.[12] While recently a [13] suggests a significant revision of methane IPCC formula.
Related measures
Radiative forcing is a useful way to compare different causes of perturbations in a climate system. Other possible tools can be constructed for the same purpose: for example Shine et al.[14] say "...recent experiments indicate that for changes in absorbing aerosols and ozone, the predictive ability of radiative forcing is much worse... we propose an alternative, the 'adjusted troposphere and stratosphere forcing'. We present GCM calculations showing that it is a significantly more reliable predictor of this GCM's surface temperature change than radiative forcing. It is a candidate to supplement radiative forcing as a metric for comparing different mechanisms...". In this quote, GCM stands for "global circulation model", and the word "predictive" does not refer to the ability of GCMs to forecast climate change. Instead, it refers to the ability of the alternative tool proposed by the authors to help explain the system response.
Therefore, the concept of radiative forcing has been evolving from the initial proposal, named nowadays instantaneous radiative forcing (IRF), to other proposals that aims to relate better the radiative imbalance with global warming (global surface mean temperature). In this sense the adjusted radiative forcing, in its different calculation methodologies, estimates the imbalance once the stratosphere temperatures has been modified to achieve a radiative equilibrium in the stratosphere (in the sense of zero radiative heating rates). This new methodology is not estimating any adjustment or feedback that could be produced on the troposphere (in addition to stratospheric temperature adjustments), for that goal another definition, named effective radiative forcing has been introduced.[15] In general the ERF is the recommendation of the CMIP6 radiative forcing analysis [16] although the stratospherically adjusted methodologies are still being applied in those cases where the adjustments and feedbacks on the troposphere are considered not critical, like in the well mixed greenhouse gases and ozone.[17][18] A methodology named radiative kernel approach allows to estimate the climate feedbacks within an offline calculation based on a linear approximation [19]
History
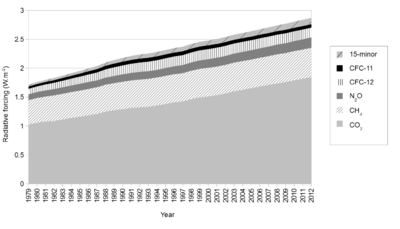
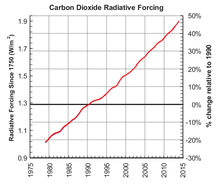
The table below (derived from atmospheric radiative transfer models) shows changes in radiative forcing between 1979 and 2018.[20] The table includes the contribution to radiative forcing from carbon dioxide (CO
2), methane (CH
4), nitrous oxide (N
2O); chlorofluorocarbons (CFCs) 12 and 11; and fifteen other minor, long-lived, halogenated gases.[21] The table includes the contribution to radiative forcing of long-lived greenhouse gases. It does not include other forcings, such as aerosols and changes in solar activity.
| Year | CO 2 | CH 4 | N 2O | CFC-12 | CFC-11 | 15-minor | Total | CO 2-eq ppm | AGGI 1990 = 1 | AGGI % change |
|---|---|---|---|---|---|---|---|---|---|---|
| 1979 | 1.027 | 0.419 | 0.104 | 0.092 | 0.039 | 0.031 | 1.712 | 383 | 0.786 | |
| 1980 | 1.058 | 0.426 | 0.104 | 0.097 | 0.042 | 0.034 | 1.761 | 386 | 0.808 | 2.8 |
| 1981 | 1.077 | 0.433 | 0.107 | 0.102 | 0.044 | 0.036 | 1.799 | 389 | 0.826 | 2.2 |
| 1982 | 1.089 | 0.440 | 0.111 | 0.108 | 0.046 | 0.038 | 1.831 | 391 | 0.841 | 1.8 |
| 1983 | 1.115 | 0.443 | 0.113 | 0.113 | 0.048 | 0.041 | 1.873 | 395 | 0.860 | 2.2 |
| 1984 | 1.140 | 0.446 | 0.116 | 0.118 | 0.050 | 0.044 | 1.913 | 397 | 0.878 | 2.2 |
| 1985 | 1.162 | 0.451 | 0.118 | 0.123 | 0.053 | 0.047 | 1.953 | 401 | 0.897 | 2.1 |
| 1986 | 1.184 | 0.456 | 0.122 | 0.129 | 0.056 | 0.049 | 1.996 | 404 | 0.916 | 2.2 |
| 1987 | 1.211 | 0.460 | 0.120 | 0.135 | 0.059 | 0.053 | 2.039 | 407 | 0.936 | 2.2 |
| 1988 | 1.250 | 0.464 | 0.123 | 0.143 | 0.062 | 0.057 | 2.099 | 412 | 0.964 | 3.0 |
| 1989 | 1.274 | 0.468 | 0.126 | 0.149 | 0.064 | 0.061 | 2.144 | 415 | 0.984 | 2.1 |
| 1990 | 1.293 | 0.472 | 0.129 | 0.154 | 0.065 | 0.065 | 2.178 | 418 | 1.000 | 1.6 |
| 1991 | 1.313 | 0.476 | 0.131 | 0.158 | 0.067 | 0.069 | 2.213 | 420 | 1.016 | 1.6 |
| 1992 | 1.324 | 0.480 | 0.133 | 0.162 | 0.067 | 0.072 | 2.238 | 422 | 1.027 | 1.1 |
| 1993 | 1.334 | 0.481 | 0.134 | 0.164 | 0.068 | 0.074 | 2.254 | 424 | 1.035 | 0.7 |
| 1994 | 1.356 | 0.483 | 0.134 | 0.166 | 0.068 | 0.075 | 2.282 | 426 | 1.048 | 1.3 |
| 1995 | 1.383 | 0.485 | 0.136 | 0.168 | 0.067 | 0.077 | 2.317 | 429 | 1.064 | 1.5 |
| 1996 | 1.410 | 0.486 | 0.139 | 0.169 | 0.067 | 0.078 | 2.350 | 431 | 1.079 | 1.4 |
| 1997 | 1.426 | 0.487 | 0.142 | 0.171 | 0.067 | 0.079 | 2.372 | 433 | 1.089 | 0.9 |
| 1998 | 1.465 | 0.491 | 0.145 | 0.172 | 0.067 | 0.080 | 2.419 | 437 | 1.111 | 2.0 |
| 1999 | 1.495 | 0.494 | 0.148 | 0.173 | 0.066 | 0.082 | 2.458 | 440 | 1.128 | 1.6 |
| 2000 | 1.513 | 0.494 | 0.151 | 0.173 | 0.066 | 0.083 | 2.481 | 442 | 1.139 | 0.9 |
| 2001 | 1.535 | 0.494 | 0.153 | 0.174 | 0.065 | 0.085 | 2.506 | 444 | 1.150 | 1.0 |
| 2002 | 1.564 | 0.494 | 0.156 | 0.174 | 0.065 | 0.087 | 2.539 | 447 | 1.166 | 1.3 |
| 2003 | 1.601 | 0.496 | 0.158 | 0.174 | 0.064 | 0.088 | 2.580 | 450 | 1.185 | 1.6 |
| 2004 | 1.627 | 0.496 | 0.160 | 0.174 | 0.063 | 0.090 | 2.610 | 453 | 1.198 | 1.1 |
| 2005 | 1.655 | 0.495 | 0.162 | 0.173 | 0.063 | 0.092 | 2.640 | 455 | 1.212 | 1.2 |
| 2006 | 1.685 | 0.495 | 0.165 | 0.173 | 0.062 | 0.095 | 2.675 | 458 | 1.228 | 1.3 |
| 2007 | 1.710 | 0.498 | 0.167 | 0.172 | 0.062 | 0.097 | 2.706 | 461 | 1.242 | 1.1 |
| 2008 | 1.739 | 0.500 | 0.170 | 0.171 | 0.061 | 0.100 | 2.742 | 464 | 1.259 | 1.3 |
| 2009 | 1.760 | 0.502 | 0.172 | 0.171 | 0.061 | 0.103 | 2.768 | 466 | 1.271 | 1.0 |
| 2010 | 1.791 | 0.504 | 0.174 | 0.170 | 0.060 | 0.106 | 2.805 | 470 | 1.288 | 1.3 |
| 2011 | 1.818 | 0.505 | 0.178 | 0.169 | 0.060 | 0.109 | 2.838 | 473 | 1.303 | 1.2 |
| 2012 | 1.846 | 0.507 | 0.181 | 0.168 | 0.059 | 0.111 | 2.873 | 476 | 1.319 | 1.2 |
| 2013 | 1.884 | 0.509 | 0.184 | 0.167 | 0.059 | 0.114 | 2.916 | 479 | 1.338 | 1.5 |
| 2014 | 1.909 | 0.500 | 0.187 | 0.166 | 0.058 | 0.116 | 2.936 | 481 | 1.356 | 1.6 |
| 2015 | 1.938 | 0.504 | 0.19 | 0.165 | 0.058 | 0.118 | 2.973 | 485 | 1.374 | 1.8 |
| 2016 | 1.985 | 0.507 | 0.193 | 0.164 | 0.057 | 0.122 | 3.028 | 490 | 1.399 | 2.5 |
| 2017 | 2.013 | 0.509 | 0.195 | 0.163 | 0.057 | 0.124 | 3.062 | 493 | 1.374 | 1.6 |
| 2018 | 2.044 | 0.512 | 0.199 | 0.162 | 0.057 | 0.127 | 3.101 | 496 | 1.433 | 1.8 |

The table shows that CO
2 dominates the total forcing, with methane and chlorofluorocarbons (CFC) becoming relatively smaller contributors to the total forcing over time.[20] The five major greenhouse gases account for about 96% of the direct radiative forcing by long-lived greenhouse gas increases since 1750. The remaining 4% is contributed by the 15 minor halogenated gases.
It might be observed that the total forcing for year 2016, 3.027 W m−2, together with the commonly accepted value of climate sensitivity parameter λ, 0.8 K /(W m−2), results in an increase in global temperature of 2.4 K, much greater than the observed increase, about 1.2 K.[22] Part of this difference is due to lag in the global temperature achieving steady state with the forcing. The remainder of the difference is due to negative aerosol forcing[23] and/or climate sensitivity being less than the commonly accepted value, or some combination thereof.[24]
The table also includes an "Annual Greenhouse Gas Index" (AGGI), which is defined as the ratio of the total direct radiative forcing due to long-lived greenhouse gases for any year for which adequate global measurements exist to that which was present in 1990.[20] 1990 was chosen because it is the baseline year for the Kyoto Protocol. This index is a measure of the inter-annual changes in conditions that affect carbon dioxide emission and uptake, methane and nitrous oxide sources and sinks, the decline in the atmospheric abundance of ozone-depleting chemicals related to the Montreal Protocol. and the increase in their substitutes (hydrogenated CFCs (HCFCs) and hydrofluorocarbons (HFC). Most of this increase is related to CO
2. For 2013, the AGGI was 1.34 (representing an increase in total direct radiative forcing of 34% since 1990). The increase in CO
2 forcing alone since 1990 was about 46%. The decline in CFCs considerably tempered the increase in net radiative forcing.
An alternative table prepared for use in climate model intercomparisons conducted under the auspices of IPCC and including all forcings, not just those of greenhouse gases, is available at http://www.climatechange2013.org/images/report/WG1AR5_AIISM_Datafiles.xlsx[25]
See also
- Climate sensitivity
- Anthropogenic heat
- Emission standard
- Global warming potential
- Sulfate
References
- Shindell, Drew (2013). "Radiative Forcing in the AR5" (PDF). Retrieved 15 September 2016.
- Rebecca, Lindsey (14 January 2009). "Climate and Earth's Energy Budget : Feature Articles". earthobservatory.nasa.gov. Retrieved 3 April 2018.
- "NASA: Climate Forcings and Global Warming". 14 January 2009.
- "Climate Change 2007: Synthesis Report" (PDF). ipcc.ch. Retrieved 3 April 2018.
- Rockström, Johan; Steffen, Will; Noone, Kevin; Persson, Asa; Chapin, F. Stuart; Lambin, Eric F.; Lenton, Timothy F.; Scheffer, M; et al. (23 September 2009). "A safe operating space for humanity". Nature. 461 (7263): 472–475. Bibcode:2009Natur.461..472R. doi:10.1038/461472a. PMID 19779433.
- "IPCC Third Assessment Report - Climate Change 2001". Archived from the original on 30 June 2009.
- "Atmosphere Changes". Archived from the original on 10 May 2009.
- Nauels, A.; Rosen, D.; Mauritsen, T.; Maycock, A.; McKenna, C.; Rogelj, J.; Schleussner, C.-F.; Smith, E.; Smith, C. (2019-12-02). "ZERO IN ON the remaining carbon budget and decadal warming rates. The CONSTRAIN Project Annual Report 2019". constrain-eu.org. doi:10.5518/100/20. Retrieved 2020-01-20.
- Myhre, G.; Highwood, E.J.; Shine, K.P.; Stordal, F. (1998). "New estimates of radiative forcing due to well mixed greenhouse gases" (PDF). Geophysical Research Letters. 25 (14): 2715–8. Bibcode:1998GeoRL..25.2715M. doi:10.1029/98GL01908.
- Huang, Yi; Bani Shahabadi, Maziar (28 November 2014). "Why logarithmic?". J. Geophys. Res. Atmospheres. 119 (24): 13, 683–89. Bibcode:2014JGRD..11913683H. doi:10.1002/2014JD022466.
- Zhong, Wenyi; Haigh, Joanna D. (27 March 2013). "The greenhouse effect and carbon dioxide". Weather. 68 (4): 100–5. Bibcode:2013Wthr...68..100Z. doi:10.1002/wea.2072. ISSN 1477-8696.
- IPCC WG-1 Archived 13 December 2007 at the Wayback Machine report
- Etminan, M.; Myhre, G.; Highwood, E. J.; Shine, K. P. (2016-12-27). "Radiative forcing of carbon dioxide, methane, and nitrous oxide: A significant revision of the methane radiative forcing". Geophysical Research Letters. 43 (24): 12, 614–12, 623. Bibcode:2016GeoRL..4312614E. doi:10.1002/2016gl071930. ISSN 0094-8276.
- Shine, Keith P.; Cook, Jolene; Highwood, Eleanor J.; Joshi, Manoj M. (23 October 2003). "An alternative to radiative forcing for estimating the relative importance of climate change mechanisms". Geophysical Research Letters. 30 (20): 2047. Bibcode:2003GeoRL..30.2047S. doi:10.1029/2003GL018141.
- Sherwood, Steven C.; Bony, Sandrine; Boucher, Olivier; Bretherton, Chris; Forster, Piers M.; Gregory, Jonathan M.; Stevens, Bjorn (2015-02-01). "Adjustments in the Forcing-Feedback Framework for Understanding Climate Change" (PDF). Bulletin of the American Meteorological Society. 96 (2): 217–228. Bibcode:2015BAMS...96..217S. doi:10.1175/bams-d-13-00167.1. ISSN 0003-0007.
- Forster, Piers M.; Richardson, Thomas; Maycock, Amanda C.; Smith, Christopher J.; Samset, Bjorn H.; Myhre, Gunnar; Andrews, Timothy; Pincus, Robert; Schulz, Michael (2016-10-27). "Recommendations for diagnosing effective radiative forcing from climate models for CMIP6" (PDF). Journal of Geophysical Research: Atmospheres. 121 (20): 12, 460–12, 475. Bibcode:2016JGRD..12112460F. doi:10.1002/2016jd025320. ISSN 2169-897X.
- Stevenson, D. S.; Young, P. J.; Naik, V.; Lamarque, J.-F.; Shindell, D. T.; Voulgarakis, A.; Skeie, R. B.; Dalsoren, S. B.; Myhre, G. (2013-03-15). "Tropospheric ozone changes, radiative forcing and attribution to emissions in the Atmospheric Chemistry and Climate Model Intercomparison Project (ACCMIP)" (PDF). Atmospheric Chemistry and Physics. 13 (6): 3063–3085. Bibcode:2013ACP....13.3063S. doi:10.5194/acp-13-3063-2013. ISSN 1680-7316.
- Checa-Garcia, Ramiro; Hegglin, Michaela I.; Kinnison, Douglas; Plummer, David A.; Shine, Keith P. (2018-04-06). "Historical Tropospheric and Stratospheric Ozone Radiative Forcing Using the CMIP6 Database" (PDF). Geophysical Research Letters. 45 (7): 3264–3273. Bibcode:2018GeoRL..45.3264C. doi:10.1002/2017gl076770. ISSN 0094-8276.
- Soden, Brian J.; Held, Isaac M.; Colman, Robert; Shell, Karen M.; Kiehl, Jeffrey T.; Shields, Christine A. (2008-07-01). "Quantifying Climate Feedbacks Using Radiative Kernels". Journal of Climate. 21 (14): 3504–3520. Bibcode:2008JCli...21.3504S. CiteSeerX 10.1.1.141.653. doi:10.1175/2007jcli2110.1. ISSN 0894-8755.
-

|journal=(help) -
CFC-113, tetrachloromethane (CCl
4), 1,1,1-trichloroethane (CH
3CCl
3); hydrochlorofluorocarbons (HCFCs) 22, 141b and 142b; hydrofluorocarbons (HFCs) 134a, 152a, 23, 143a, and 125; sulfur hexafluoride (SF
6), and halons 1211, 1301 and 2402) - Hansen, J.E.; et al. "GISS Surface Temperature Analysis: Analysis Graphs and Plots". Goddard Institute for Space Studies, National Aeronautics and Space Administration.
- Particulates#Climate effects
- Schwartz, Stephen E.; Charlson, Robert J.; Kahn, Ralph A.; Ogren, John A.; Rodhe, Henning (2010). "Why hasn't Earth warmed as much as expected?" (PDF). Journal of Climate (published 15 May 2010). 23 (10): 2453–64. Bibcode:2010JCli...23.2453S. doi:10.1175/2009JCLI3461.1.
- IPCC, 2013: Climate Change 2013: The Physical Science Basis. Contribution of Working Group I to the Fifth Assessment Report of the Intergovernmental Panel on Climate Change [Stocker, T.F., D. Qin, G.-K. Plattner, M. Tignor, S.K. Allen, J. Boschung, A. Nauels, Y. Xia, V. Bex and P.M. Midgley (eds.)]. Cambridge University Press, Cambridge, United Kingdom and New York, NY, USA, 1535 pp., 31 January 2014.,
External links
- IPCC glossary
- CO2: The Thermostat that Controls Earth's Temperature by NASA's Goddard Institute for Space Studies, October, 2010, Forcing vs. Feedbacks
- Intergovernmental Panel on Climate Change’s Fourth Assessment Report (2007), Chapter 2, "Changes in Atmospheric Constituents and Radiative Forcing," pp. 133–134 (PDF, 8.6 MB, 106 pp.).
- U.S. EPA (2009), Climate Change – Science. Explanation of climate change topics including radiative forcing.
- United States National Research Council (2005), Radiative Forcing of Climate Change: Expanding the Concept and Addressing Uncertainties, Board on Atmospheric Sciences and Climate
- Small volcanoes add up to cooler climate; Airborne particles help explain why temperatures rose less last decade August 13, 2011; Vol.180 #4 (p. 5) Science News
- NASA: The Atmosphere’s Energy Budget
- Energy balance: the simplest climate model
- Explore Mann's climate projections from Scientific American
| |||||||||||||
| |||||||||||||
| |||||||||||||
| |||||||||||||
| |||||||||||||
| |||||||||||||
| |||||||||||||