Local government areas of South Australia
Local government in the Australian state of South Australia describes the organisations and processes by which towns and districts can manage their own affairs to the extent permitted by section 64A of Constitution Act 1934 (SA).[1]
LGAs sorted by region
The organisations, often called local government areas (LGAs) are constituted and managed in accordance with the Local Government Act 1999 (South Australia). They are grouped below by region, as defined by the Local Government Association of South Australia.[2] Of the areas Maralinga Tjarutja and Anangu Pitjantjatjara Yankunytjatjara aboriginal councils both located in the remote north of the state are by far the largest South Australian LGAs, both exceding 100,000 km2.[3] Other than these Coorong District Council and Loxton Waikerie are the next largest LGAs.[3] The smallest LGA is Walkerville and then Prospect, both occupying less than 10 km2 each.[3] The area with the largest population growth was Playford in Adealide's northern suburbs with a net increase of 1,363 people in the 12 months to June 2018.[3] This was closely followed by Charles Sturt with 1,353 at the same time.[3] Whyalla had the largest net reduction in population of 238,[3] while Port Augusta had a fall of 163. The fastest growth of an LGA in South Australia was found in Maralinga Tjarutja at 4.9 percent, although off a very small base of 61. Other than that, Mount Barker was the next fastest growing at 2.4% followed by City of Adelaide at 2.3%[3]
Metropolitan Adelaide
This group of areas are found around Metropolitan Adelaide along a 70 km stretch of the Gulf St Vincent coast and up to 50 km inland.
| Local government area | Council seat | Year est. | Land area | Population | Notes | Map | |||
|---|---|---|---|---|---|---|---|---|---|
| km² | sq mi | Density (2018)[3] | 2013[4] | 2018[4][3] | |||||
| City of Adelaide | Adelaide | 1840 | 16 | 6 | 1592 | 22,143 | 24,794 | Capital city of South Australia 1840 Established as Adelaide Corporation 1843 Managed by the Colonial government, and then a commission 1852 Re-established 1919 Office of Mayor raised to Lord Mayor |  |
| Adelaide Hills Council | Woodside | 1997 | 795 | 307 | 50 | 39,687 | 39,734 | Amalgamation of District Councils of East Torrens, Gumeracha, Onkaparinga and Stirling |  |
| City of Burnside | Tusmore | 1856 | 28 | 11 | 1,661 | 44,457 | 45,706 | 1856 gazetted as District Council of Burnside 1935 became the Municipality of Burnside 1943 proclaimed the City of Burnside |  |
| City of Campbelltown | Rostrevor | 1854 | 24 | 9 | 2,114 | 50,476 | 51,469 | 1854 established as the District Council of Payneham 1867 District Council of Stepney (later itself called Payneham) seceded 1868 renamed to District Council of Campbelltown 1946 became the Town of Campbelltown 1960 proclaimed the City of Campbelltown |  |
| City of Charles Sturt | Woodville | 1997 | 55 | 21 | 2,143 | 111,324 | 117,382 | Amalgamation of City of Hindmarsh Woodville and the City of Henley and Grange |  |
| Town of Gawler | Gawler | 1857 | 41 | 16 | 584 | 21,656 | 24,018 | Established as the Corporation of the Town of Gawler in 1857 following resident dissatisfaction at being governed by three different district councils | 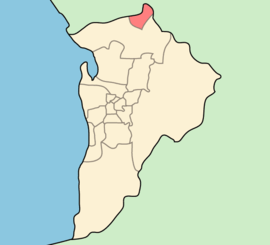 |
| City of Holdfast Bay | Brighton | 1997 | 14 | 5 | 2,693 | 36,282 | 37,032 | Amalgamation of Glenelg and Brighton city councils | 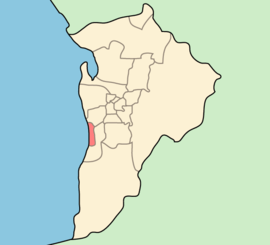 |
| City of Marion | Sturt | 1853 | 56 | 22 | 1,659 | 87,769 | 92,308 | 1853 established as the District Council of Brighton 1886 renamed to the District Council of Marion 1944 gazetted as the municipality, City of Marion |  |
| City of Mitcham | Torrens Park | 1853 | 76 | 29 | 890 | 65,644 | 67,253 | First LGA formally founded after the City of Adelaide |  |
| City of Norwood Payneham & St Peters | Norwood | 1997 | 15 | 6 | 2,433 | 36,347 | 36,750 | Amalgamation of the City of Kensington and Norwood, the City of Payneham and the Town of St Peters. | 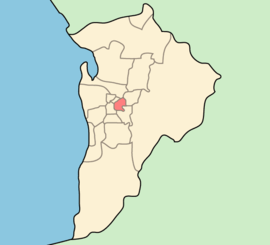 |
| City of Onkaparinga | Noarlunga Centre | 1997 | 518 | 200 | 331 | 166,244 | 171,489 | Amalgamation of Cities of Happy Valley and Noarlunga with part of the District Council of Willunga | 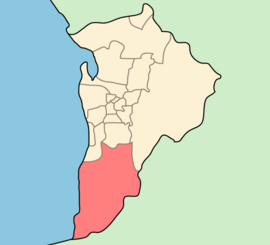 |
| City of Playford | Elizabeth | 1997 | 345 | 133 | 271 | 85,232 | 93,426 | Amalgamation of the cities of Elizabeth and Munno Para | 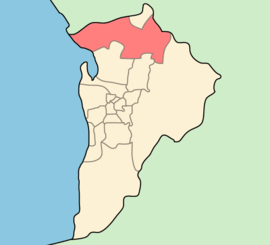 |
| City of Port Adelaide Enfield | Port Adelaide | 1997 | 92 | 36 | 1,375 | 119,876 | 126,120 | Amalgamation of the cities of Port Adelaide and Enfield | 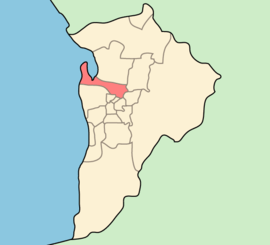 |
| City of Prospect | Prospect | 1872 | 8 | 3 | 2,729 | 20,959 | 21,259 | Separated from District Council of Yatala South |  |
| City of Salisbury | Salisbury | 1933 | 160 | 62 | 892 | 135,880 | 142,555 | Amalgamation of District Council of Yatala North and large part of District Council of Munno Para West | 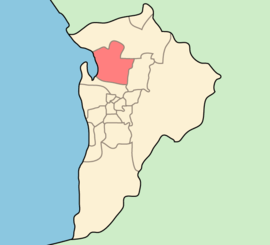 |
| City of Tea Tree Gully | Modbury | 1858 | 95 | 37 | 1,047 | 98,558 | 99,694 | 1858 established by separation from District Council of Highercombe 1935 reunited with Highercombe under current name | 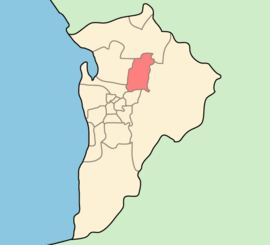 |
| City of Unley | Unley | 1871 | 14 | 5 | 2,743 | 38,552 | 39,145 | Separated from District Council of Mitcham as the Corporate Town of Unley | 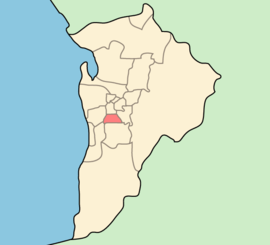 |
| Town of Walkerville | Gilberton | 1855 | 4 | 2 | 2250 | 7,399 | 7,944 | Separated from District Council of Yatala | 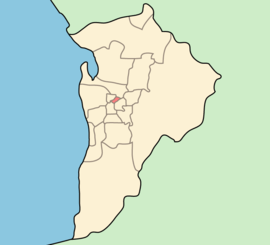 |
| City of West Torrens | Hilton | 1856 | 37 | 14 | 1,623 | 58,153 | 60,105 | 1856 established as the District Council of West Torrens 1944 became a municipal corporation, the Corporate Town of West Torrens 1950 gained city status as the City of West Torrens 1997 annexed the Town of Thebarton | 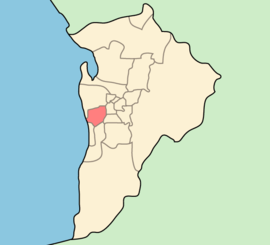 |
Regional South Australia
Eyre Peninsula
| Local government area | Council seat | Year est. | Land area | Population | Notes | Map | |||
|---|---|---|---|---|---|---|---|---|---|
| km² | sq mi | Density (2018)[4] | 2013[4] | 2018[4][3] | |||||
| District Council of Ceduna | Ceduna | 1896 | 5,427 | 2,095 | 0.6 | 3,574 | 3,466 |  | |
| District Council of Cleve | Cleve | 1911 | 4,507 | 1,740 | 0.4 | 1,806 | 1,799 | Separated from Franklin Harbour |  |
| District Council of Elliston | Elliston | 1887 | 6,500 | 2,510 | 0.2 | 1,067 | 1,019 | Boundary changes in 1989 | 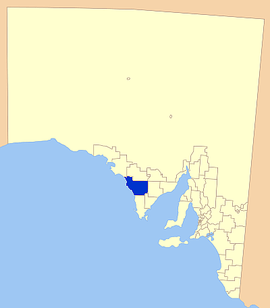 |
| District Council of Franklin Harbour | Cowell | 1888 | 3,583 | 1,383 | 0.5 | 1,295 | 1,315 | 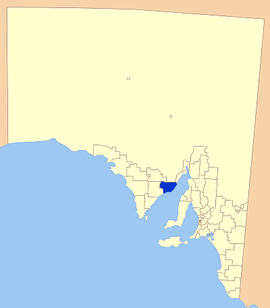 | |
| District Council of Kimba | Kimba | 1924 | 3,986 | 1,539 | 0.2 | 1,103 | 1,073 | 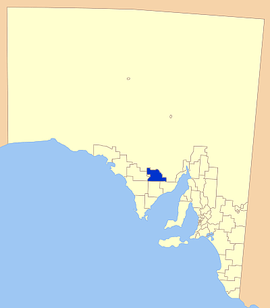 | |
| District Council of Lower Eyre Peninsula | Cummins | 1921 | 4,771 | 1,842 | 1.2 | 5,300 | 5,761 | Part of District Council of Port Lincoln (proclaimed 1880). District Council of Tumby Bay separated in 1906. Corporation of Port Lincoln separated in 1921. Remainder named District Council of Lincoln. Renamed Lower Eyre Peninsula in 1988. | 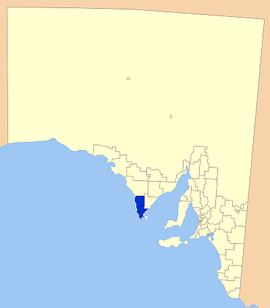 |
| City of Port Augusta | Port Augusta | 1964 | 1,153 | 445 | 11.8 | 14,496 | 14,102 |  | |
| City of Port Lincoln | Port Lincoln | 1921 | 30 | 12 | 481.6 | 14,531 | 14,626 | Separated from District Council of Port Lincoln in 1921. Proclaimed a city in 1971. |  |
| District Council of Streaky Bay | Streaky Bay | 1887 | 6,232 | 2,406 | 0.4 | 2,194 | 2,214 | 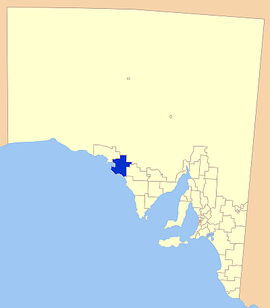 | |
| District Council of Tumby Bay | Tumby Bay | 1906 | 2,616 | 1,010 | 1.0 | 2,640 | 2,668 | Separated from District Council of Port Lincoln |  |
| City of Whyalla | Whyalla | 1970 | 1,033 | 399 | 20.3 | 22,659 | 21,766 |  | |
| Wudinna District Council | Wudinna | 1925 | 5,394 | 2,083 | 0.3 | 1,272 | 1,294 | Established as the District Council of Minnipa. Later renamed as District Council of Le Hunte. Given present name in 2008. |  |
Central region
| Local government area | Council seat | Year est. | Land area | Population | Notes | Map | |||
|---|---|---|---|---|---|---|---|---|---|
| km² | sq mi | Density (2018)[4] | 2013[4] | 2018[4][3] | |||||
| Adelaide Plains Council | Mallala | 1935 | 933 | 360 | 9.7 | 8,646 | 9,059 | Amalgamation of the district councils of Grace, Dublin and Port Gawler |  |
| Barossa Council | Angaston | 1996 | 894 | 345 | 27.8 | 23,138 | 24,808 | Amalgamation of district councils of Angaston, Barossa, Tanunda and, since 1997, part of Mount Pleasant |  |
| District Council of Barunga West | Port Broughton | 1997 | 1,590 | 614 | 1.6 | 2,495 | 2,551 | Amalgamation of the District Council of Bute and the District Council of Port Broughton | 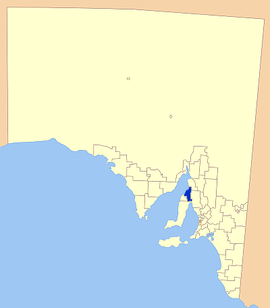 |
| District Council of Clare and Gilbert Valleys | Clare | 1997 | 1,892 | 731 | 5.0 | 9,068 | 9,379 | Amalgamation of the district councils of Clare, Riverton and Saddleworth and Auburn |  |
| Copper Coast Council | Kadina | 1997 | 773 | 298 | 19.2 | 13,747 | 14,872 | Amalgamation of the District Council of Northern Yorke Peninsula and Corporate Town of Wallaroo |  |
| Flinders Ranges Council | Quorn | 1997 | 4,071 | 1,572 | 0.4 | 1,717 | 1,693 | Amalgamation of the District Council of Kanyaka-Quorn and the District Council of Hawker | 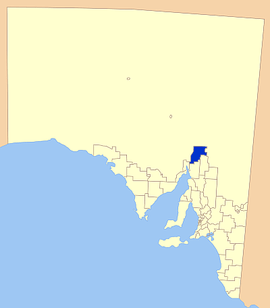 |
| Regional Council of Goyder | Burra | 1997 | 6,715 | 2,593 | 0.6 | 4,254 | 4,206 | Amalgamation of the district councils of Burra Burra Eudunda, Hallet and Robertstown. | 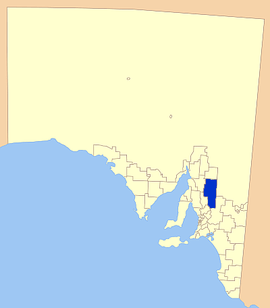 |
| Light Regional Council | Kapunda | 1996 | 1,277 | 493 | 12.0 | 14,440 | 15,339 | Amalgamation of the District Council of Light (1977–1996) and the District Council of Kapunda | 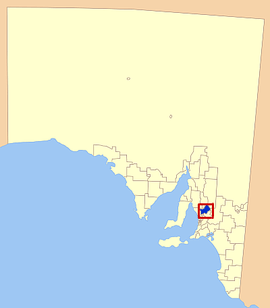 |
| District Council of Mount Remarkable | Melrose | 1980 | 3,423 | 1,322 | 0.9 | 2,913 | 2,910 | Amalgamation of District Council of Port Germein and District Council of Wilmington | 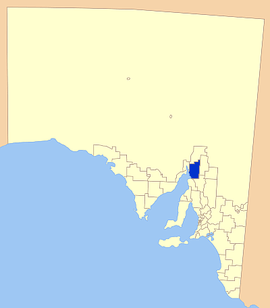 |
| Northern Areas Council | Jamestown | 1997 | 2,986 | 1,153 | 1.5 | 4,595 | 4,603 | Amalgamation of the district councils of Rocky River, Spalding, and Jamestown |  |
| District Council of Orroroo Carrieton | Orroroo | 1997 | 3,322 | 1,283 | 0.3 | 895 | 854 | Amalgamation of the District Council of Orroroo and District Council of Carrieton |  |
| District Council of Peterborough | Peterborough | 1935 | 3,020 | 1,166 | 0.6 | 1,728 | 1,700 | ||
| Port Pirie Regional Council | Port Pirie | 1997 | 1,761 | 680 | 10.0 | 17,793 | 17,630 | Amalgamation of the City of Port Pirie and the District Council of Crystal Brook-Redhill |  |
| Wakefield Regional Council | Balaklava | 1997 | 3,469 | 1,339 | 2.0 | 6,841 | 6,814 | Amalgamation of the District Council of Blyth-Snowtown and District Council of Wakefield Plains | 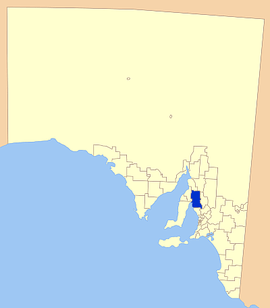 |
| Yorke Peninsula Council | Maitland | 1997 | 5,900 | 2,278 | 1.9 | 11,241 | 11,328 | Established as the District Council of Yorke Peninsula in 1997 by amalgamation of the district councils of Central Yorke Peninsula, Minlaton, Warooka and Yorketown. Renamed in 2013. |  |
Southern and Hills region
| Local government area | Council seat | Year est. | Land area | Population | Notes | Map | |||
|---|---|---|---|---|---|---|---|---|---|
| km² | sq mi | Density (2018)[4] | 2013[4] | 2018[4][3] | |||||
| Alexandrina Council | Goolwa | 1997 | 1,827 | 705 | 14.8 | 25,203 | 27,037 | Amalgamation of the District Council of Strathalbyn, the District Council of Port Elliot and Goolwa, and a portion of the District Council of Willunga. |  |
| Kangaroo Island Council | Kingscote | 1996 | 4,401 | 1,699 | 1.1 | 4,630 | 4,933 | Amalgamation of the District Council of Kingscote and the District Council of Dudley. | 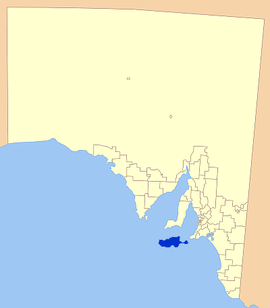 |
| District Council of Mount Barker | Mount Barker | 1853 | 595 | 230 | 59.8 | 31,580 | 35,545 |  | |
| City of Victor Harbor | Victor Harbor | 1975 | 385 | 149 | 39.6 | 14,525 | 15,248 | Amalgamation of District Council of Encounter Bay and the Corporation of Victor Harbor in 1975. Formerly a district council, became a city in 2000. | |
| District Council of Yankalilla | Yankalilla | 1854 | 751 | 290 | 7.3 | 4,759 | 5,478 |  | |
Murray Mallee region
| Local government area | Council seat | Year est. | Land area | Population | Notes | Map | |||
|---|---|---|---|---|---|---|---|---|---|
| km² | sq mi | Density (2018)[4] | 2013[4] | 2018[4][3] | |||||
| Berri Barmera Council | Berri | 1996 | 476 | 184 | 22.8 | 10,804 | 10,853 | Amalgamation of district councils of Barmera and Berri. |  |
| The Coorong District Council | Meningie | 1995 | 8,833 | 3,410 | 0.6 | 5,602 | 5,463 | Amalgamation of District Council of Coonalpyn Downs, Peake District Council and Meningie District Council. | 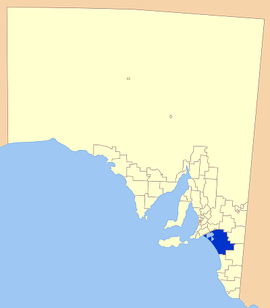 |
| Gerard Community Council | Winkie | 1974 | 86 | 33 | ~39 |  | |||
| District Council of Karoonda East Murray | Karoonda | 1979 | 4,416 | 1,705 | 0.3 | 1,088 | 1,112 | Amalgamation of District Council of Karoonda and District Council of East Murray. |  |
| District Council of Loxton Waikerie | Loxton | 1997 | 7,764 | 2,998 | 1.5 | 11,571 | 11,726 | Amalgamation of district councils of Loxton, Waikerie and Browns Well. |  |
| Mid Murray Council | Mannum | 1997 | 6,272 | 2,422 | 1.4 | 8,448 | 8,983 | Amalgamation of district councils of Mannum, Morgan, Ridley-Truro and part of the District Council of Mount Pleasant. |  |
| Rural City of Murray Bridge | Murray Bridge | 1977 | 1,832 | 707 | 12.1 | 20,726 | 22,165 |  | |
| Renmark Paringa Council | Renmark | 1996 | 916 | 354 | 10.8 | 9,588 | 9,869 | Amalgamation of Town of Renmark and the District Council of Paringa. |  |
| Southern Mallee District Council | Pinnaroo | 5,702 | 2,202 | 0.4 | 2,088 | 2,094 |  | ||
Southeast region
| Local government area | Council seat | Year est. | Land area | Population | Notes | Map | |||
|---|---|---|---|---|---|---|---|---|---|
| km² | sq mi | Density (2018)[4] | 2013[4] | 2018[4][3] | |||||
| District Council of Grant | Mount Gambier | 1996 | 1,898 | 733 | 4.5 | 7,993 | 8,511 | Amalgamation of District Councils of Mount Gambier and Port MacDonnell. |  |
| Kingston District Council | Kingston SE | 1873 | 3,340 | 1,290 | 0.7 | 2,380 | 2,374 | Renamed from Lacepede District Council in 2000. |  |
| City of Mount Gambier | Mount Gambier | 34 | 13 | 801.8 | 26,425 | 27,176 |  | ||
| Naracoorte Lucindale Council | Naracoorte | 1993 | 4,520 | 1,745 | 1.9 | 8,528 | 8,533 | Amalgamation of District Council of Naracoorte, District Council of Lucindale and the Corporate Township of Naracoorte. |  |
| District Council of Robe | Robe | 1869 | 1,092 | 422 | 1.3 | 1,425 | 1,444 |  | |
| Tatiara District Council | Bordertown | 1876 | 6,527 | 2,520 | 1.0 | 6,789 | 6,794 |  | |
| Wattle Range Council | Millicent | 1997 | 3,926 | 1,516 | 3.1 | 11,935 | 12,031 | Amalgamation of district councils of Beachport, Millicent and Penola. | 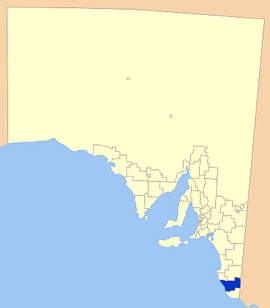 |
Outback
| Local government area | Council seat | Year est. | Land area | Population | Notes | Map | |||
|---|---|---|---|---|---|---|---|---|---|
| km² | sq mi | Density (2018)[4] | 2013[4] | 2018[4][3] | |||||
| Anangu Pitjantjatjara Yankunytjatjara | Umuwa | 1981 | 102,353 | 39,519 | 2,622 | 2,558 | 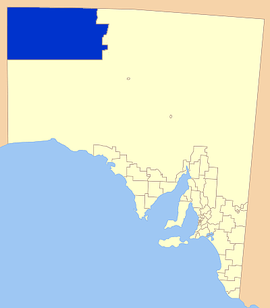 | ||
| District Council of Coober Pedy | Coober Pedy | 1987 | 78 | 30 | 23.8 | 1,811 | 1,845 |  | |
| Maralinga Tjarutja | Ceduna | 2006 | 102,704 | 39,654 | 74 | 64 | 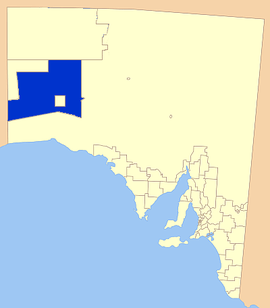 | ||
| Nepabunna Community Council | Nepabunna | 1998 | 76 | 29 | 66[5] |  | |||
| Outback Communities Authority | Port Augusta | 1978 | 624,339 | 241,059 | 3,959 | Covers almost 60 percent of the state's area, mostly in the arid regions of the centre and north. | |||
| Municipal Council of Roxby Downs | Roxby Downs | 1982 | 111 | 43 | 36.3 | 4,609 | 4,014 |  | |
| Yalata Community | 1994 | 4,563 | 1,762 | 224[6] | 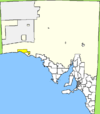 | ||||
Maps
 Partial map of LGAs
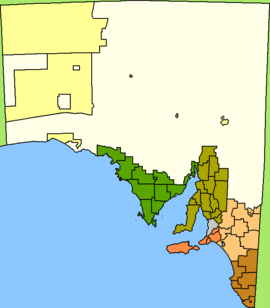 LGA regions
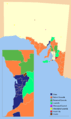 Types of LGAs
References
- "Constitution Act 1934 – Section 64A". Australasian Legal Information Institute. Government of South Australia. 1934. Retrieved 24 June 2013.
- "Council Maps". LGASA Official Site. Local Government Association of South Australia. Retrieved 5 May 2019.
- "3218.0 – Regional Population Growth, Australia, 2017-18: Population Estimates by Local Government Area (ASGS 2018), 2017 to 2018". Australian Bureau of Statistics. Australian Bureau of Statistics. 27 March 2019. Retrieved 25 October 2019. Estimated resident population, 30 June 2018.
- "People: Population: ERP by LGA (ASGS 2018), 2001 to 2018". ABS.Stat. Australian Bureau of Statistics. 27 March 2019. Retrieved 29 November 2019.
- Australian Bureau of Statistics (27 June 2017). "Nepabunna". 2016 Census QuickStats. Retrieved 1 December 2019.

- Australian Bureau of Statistics (27 June 2017). "Yalata (L)". 2016 Census QuickStats. Retrieved 1 December 2019.
External links
- "Shires of Australia". Statoids.
- Local Government Association of South Australia
- Local Government Regions of SA – clickable maps
| Topics |
| |
|---|---|---|
| Regions | ||
| Cities and towns | ||
South Australia portal | ||