1980 Australian federal election
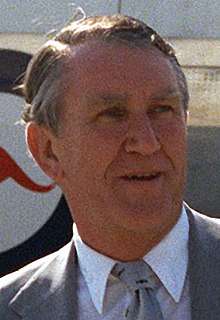
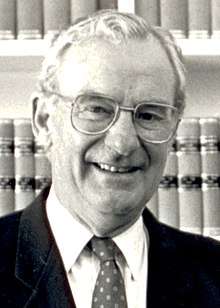
The 1980 Australian federal election was held in Australia on 18 October 1980. All 125 seats in the House of Representatives and 34 of the 64 seats in the Senate were up for election. The incumbent Liberal–NCP coalition government, led by Prime Minister Malcolm Fraser, was elected to a third term with a much reduced majority, defeating the opposition Labor Party led by Bill Hayden. This was the last federal election victory for the Coalition until the 1996 election
| |||||||||||||||||||||||||||||||
All 125 seats in the House of Representatives 63 seats were needed for a majority in the House 34 (of the 64) seats in the Senate | |||||||||||||||||||||||||||||||
|---|---|---|---|---|---|---|---|---|---|---|---|---|---|---|---|---|---|---|---|---|---|---|---|---|---|---|---|---|---|---|---|
| |||||||||||||||||||||||||||||||
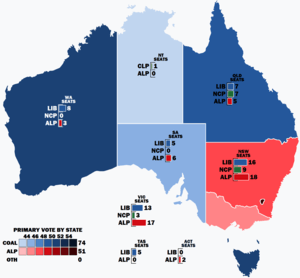 Popular vote by state and territory with graphs indicating the number of seats won. As this is an IRV election, seat totals are not determined by popular vote by state or territory but instead via results in each electorate. | |||||||||||||||||||||||||||||||
| |||||||||||||||||||||||||||||||
Future Prime Minister Bob Hawke and future opposition leader and future Deputy Prime Minister Kim Beazley entered parliament at this election.
Issues and significance
The Fraser Government had lost a degree of popularity within the electorate by 1980. The economy had been performing poorly since the 1973 oil shock. However, Hayden was not seen as having great electoral prospects.[1] Perhaps as evidence of this, then ACTU President Bob Hawke (elected to Parliament in the election as the Member for Wills) and then Premier of New South Wales Neville Wran featured heavily in the campaign, almost as heavily as Hayden.
Results
House of Representatives

| Party | Votes | % | Swing | Seats | Change | ||
|---|---|---|---|---|---|---|---|
| Liberal–NCP coalition | 3,853,585 | 46.40 | –1.71 | 74 | –12 | ||
| Liberal | 3,108,517 | 37.43 | −0.66 | 54 | −13 | ||
| National Country | 726,263 | 8.74 | −1.07 | 19 | +1 | ||
| Country Liberal | 18,805 | 0.23 | +0.02 | 1 | 0 | ||
| Labor | 3,749,565 | 45.15 | +5.50 | 51 | +13 | ||
| Democrats | 546,032 | 6.57 | −2.81 | 0 | 0 | ||
| Democratic Labor | 25,456 | 0.31 | −1.12 | 0 | 0 | ||
| Progress | 17,040 | 0.21 | −0.39 | 0 | 0 | ||
| Socialist Workers | 16,920 | 0.20 | +0.20 | 0 | 0 | ||
| Communist | 11,318 | 0.14 | −0.04 | 0 | 0 | ||
| Socialist Labour | 10,051 | 0.12 | +0.12 | 0 | 0 | ||
| NPWA | 8,915 | 0.11 | +0.11 | 0 | 0 | ||
| Progressive Conservative | 3,620 | 0.04 | +0.04 | 0 | 0 | ||
| United Christian | 2,050 | 0.02 | +0.02 | 0 | 0 | ||
| Imperial British Conservative | 1,515 | 0.02 | +0.02 | 0 | 0 | ||
| Australia | 701 | 0.01 | +0.01 | 0 | 0 | ||
| Marijuana | 486 | 0.01 | +0.01 | 0 | 0 | ||
| Independent | 58,338 | 0.70 | +0.07 | 0 | 0 | ||
| Total | 8,305,633 | 125 | +1 | ||||
| Two-party-preferred (estimated) | |||||||
| Coalition | WIN | 50.40 | −4.20 | 74 | −12 | ||
| Labor | 49.60 | +4.20 | 51 | +13 | |||
Senate

Coalition
Liberal (27)
NCP (3)
CLP (1)
Opposition (27)
Labor (27)
Crossbench (6)
Democrats (5)
Independent (1)
| Party | Votes | % | Swing | Seats Won | Seats Held | Change | ||
|---|---|---|---|---|---|---|---|---|
| Liberal–NCP coalition | 3,352,521 | 43.58 | –1.98 | 15 | 31 | –3 | ||
| Liberal–NCP joint ticket | 1,971,528 | 25.63 | −8.63 | 4 | * | * | ||
| Liberal | 1,011,289 | 13.15 | +2.55 | 9 | 27 | 0 | ||
| National Country | 341,978 | 4.45 | +3.95 | 1 | 3 | –3 | ||
| Country Liberal | 19,129 | 0.25 | +0.04 | 1 | 1 | 0 | ||
| Labor | 3,250,187 | 42.25 | +5.49 | 15 | 27 | 0 | ||
| Democrats | 711,805 | 9.25 | −1.88 | 3 | 5 | +3 | ||
| Call to Australia | 118,535 | 1.54 | +0.42 | 0 | 0 | 0 | ||
| Democratic Labor | 31,766 | 0.41 | –1.26 | 0 | 0 | 0 | ||
| Marijuana | 28,337 | 0.37 | –0.23 | 0 | 0 | 0 | ||
| Australia | 27,404 | 0.36 | +0.25 | 0 | 0 | 0 | ||
| Socialist | 15,412 | 0.20 | –0.38 | 0 | 0 | 0 | ||
| Progress | 8,252 | 0.11 | –1.08 | 0 | 0 | 0 | ||
| NPWA | 7,597 | 0.10 | +0.10 | 0 | 0 | 0 | ||
| Other | 56,128 | 0.73 | +0.73 | 0 | 0 | 0 | ||
| Independent | 86,770 | 1.13 | –0.60 | 1 | 1 | 0 | ||
| Total | 7,692,364 | 34 | 64 | |||||
- Notes
- Independent: Brian Harradine
Seats changing hands
| Seat | Pre-1980 | Swing | Post-1980 | ||||||
|---|---|---|---|---|---|---|---|---|---|
| Party | Member | Margin | Margin | Member | Party | ||||
| Ballarat, Vic | Liberal | Jim Short | 7.5 | 8.2 | 0.7 | John Mildren | Labor | ||
| Brisbane, Qld | Liberal | Peter Johnson | 3.2 | 5.0 | 1.8 | Manfred Cross | Labor | ||
| Canberra, ACT | Liberal | John Haslem | 1.0 | 6.7 | 5.7 | Ros Kelly | Labor | ||
| Henty, Vic | Liberal | Ken Aldred | 2.7 | 5.5 | 2.8 | Joan Child | Labor | ||
| Holt, Vic | Liberal | William Yates | 1.8 | 8.7 | 6.9 | Michael Duffy | Labor | ||
| Hotham, Vic | Liberal | Roger Johnston | 1.7 | 5.7 | 4.0 | Lewis Kent | Labor | ||
| Isaacs, Vic | Liberal | Bill Burns | 7.3 | 9.1 | 1.8 | David Charles | Labor | ||
| Kalgoorlie, WA | Liberal | Mick Cotter | 8.5 | 8.1 | 0.6 | Graeme Campbell | Labor | ||
| La Trobe, Vic | Liberal | Marshall Baillieu | 0.8 | 3.1 | 2.3 | Peter Milton | Labor | ||
| Lilley, Qld | Liberal | Kevin Cairns | 6.0 | 6.8 | 0.8 | Elaine Darling | Labor | ||
| Macquarie, NSW | Liberal | Reg Gillard | 1.7 | 4.5 | 2.8 | Ross Free | Labor | ||
| McMillan, Vic | Liberal | Barry Simon | 4.8 | 6.2 | 1.4 | Barry Cunningham | Labor | ||
| Riverina, NSW | Labor | John FitzPatrick | 0.1 | 0.6 | 0.5 | Noel Hicks | National Country | ||
| St George, NSW | Liberal | Maurice Neil | 2.0 | 8.1 | 6.1 | Bill Morrison | Labor | ||
| Swan, WA | Liberal | John Martyr | 0.5 | 8.1 | 7.6 | Kim Beazley | Labor | ||
- Members in italics did not contest their seat at this election.
Aftermath

In the election, Labor finished only 0.8 percent behind the Coalition on the two-party vote—a four-percent swing from 1977. However, due to the uneven nature of the swing, Labor came up 12 seats short of a majority, giving the Coalition a third term in government. Hayden, however, did manage to regain much of what Labor had lost in the previous two elections. Notably, he managed to more than halve Fraser's majority, from 48 seats at dissolution to 23.
In the subsequent term, the government delivered budgets significantly in deficit, and Fraser was challenged for the Liberal leadership by Andrew Peacock. The Australian Democrats made further gains, winning the balance of power in the Senate. From July 1981 (when those senators elected at the 1980 election took up their positions) no Federal Government in Australia had a Senate majority until the Howard Government won such a majority in 2004.
See also
- Candidates of the Australian federal election, 1980
- Members of the Australian House of Representatives, 1980–1983
- Members of the Australian Senate, 1981–1983
Notes
- "australianpolitics.com". australianpolitics.com. Retrieved 30 July 2016.
References
- AustralianPolitics.com election details
- University of WA election results in Australia since 1890
- AEC 2PP vote
- Prior to 1984 the AEC did not undertake a full distribution of preferences for statistical purposes. The stored ballot papers for the 1983 election were put through this process prior to their destruction. Therefore, the figures from 1983 onwards show the actual result based on full distribution of preferences.
| Federal elections | |
|---|---|
| Referendums | |
| |