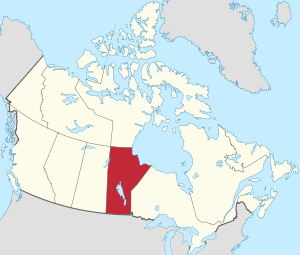
List of municipalities in Manitoba
Manitoba is the fifth most populous province in Canada with 1,278,365 residents as of 2016 and is the sixth largest in land area at 552,371 km2 (213,272 sq mi).[1] Manitoba's 137 municipalities[2] cover only 20% of the province's land mass yet are home to 94% of its population.[3][lower-alpha 1] These municipalities provide local government services to their residents.

A municipality in Manitoba is "a municipality that is continued or formed under" the Municipal Act, which was enacted in 1996.[4] Municipalities that can be formed under this legislation include urban municipalities (cities, towns and villages) and rural municipalities.[4] The Local Government Districts Act, enacted in 1987, allows the formation of local government districts as another municipality type.[5] Of Manitoba's 137 municipalities, 37 of them are urban municipalities (10 cities, 25 towns and 2 villages), 98 are rural municipalities and 2 are local government districts.[6][7] The Municipal Act and the Local Government Districts Act stipulate governance of these municipalities.[4][5] Additional charters or acts are in place specifically for the cities of Brandon, Flin Flon, Portage la Prairie, Thompson and Winnipeg, the towns of Morris and Winnipeg Beach, and the rural municipalities of Kelsey, St. Andrews and Victoria Beach.[8] The Municipal Act, the Local Government Districts Act, and all these additional acts and charters were enacted at the provincial level by the Lieutenant Governor of Manitoba, representing Queen Elizabeth II, on the advice and consent of the Legislative Assembly of Manitoba.[4][5][8] The Government of Manitoba's Department of Local Government is responsible for providing provincial services to municipalities.[9]
Over half of Manitoba's population resides in the City of Winnipeg, the provincial capital, with a population with 705,244.[3] The City of Brandon is the province's second most populous municipality with 48,859 residents.[3] Manitoba's smallest municipality by population is the Local Government District of Mystery Lake with 0 residents.[3] The largest municipality by land area is the Rural Municipality (RM) of Reynolds at 3,572.13 km2 (1,379.21 sq mi), while the smallest by land area is the Village of Lac du Bonnet at 2.15 km2 (0.83 sq mi).[3]
Manitoba's first municipality was the RM of Springfield (originally Springfield-Sunnyside).[10] It was incorporated on September 27, 1873.[11] Winnipeg was incorporated as a city a few weeks later on November 8, 1873.[12]
Urban municipalities

Manitoba's Municipal Act, enacted in 1996, defines urban municipality as an incorporated "area with at least 1,000 residents and a population density of at least 400 residents per square kilometre."[4] An urban municipality, upon formation, may be named a "city", "town", "village" or "urban municipality", although there is a minimum 7,500 population requirement that limits the naming of cities.[4]
Combined, Manitoba has 37 urban municipalities comprising 10 cities, 25 towns and 2 villages.[6] The 37 urban municipalities have a total population of 900,769, a total land area of 6,402.26 km2 (2,471.93 sq mi). These totals represent 70.5% of Manitoba's population but only 1.2% of its land area.[3]
Of Manitoba's 37 urban municipalities, 6 have populations less than the current minimum population requirement of 1,000 and 20 have less than the current minimum density requirement of 400 residents per square kilometre. All of these were incorporated as urban municipalities prior to the Municipal Act being enacted in 1996.[4][13]
Cities
In Manitoba, a city is a type of urban municipality. The Municipal Act stipulates that an urban municipality can only be named a city if it has a minimum population of 7,500 residents.[4]
Manitoba has 10 cities[6] that had a cumulative population of 841,890 in the 2016 census.[3] These 10 cities include Flin Flon, of which a small portion is located within the neighbouring province of Saskatchewan. The province's largest and smallest cities by population are Winnipeg and the Manitoba portion of Flin Flon with populations of 705,244 and 4,991 respectively.[3]|suf1=[14] The province's largest and smallest cities by land area are Winnipeg and Dauphin with land areas of 464.33 km2 (179.28 sq mi) and 12.61 km2 (4.87 sq mi) respectively.[3] Manitoba's newest city is Morden, which changed from a town to a city on August 24, 2012.[15]
Towns
In Manitoba, an urban municipality may be named a town upon formation. Other than the requirements to incorporate as an urban municipality (1,000 residents and 400 people/km2), the Municipal Act has no minimum population threshold to limit the naming of them as towns. A town can alternately be named a village or urban municipality under the Municipal Act or a city if it has a minimum population of 7,500.[4]
Manitoba has 25 towns[6] that had a cumulative population of 56,946 in the 2016 census.[3] The province's largest and smallest towns by population are The Pas and Grand Rapids with populations of 5,369 and 268 respectively.[3] The province's largest and smallest towns by land area are Gillam and Lac du Bonnet with land areas of 1,996.34 km2 (770.79 sq mi) and 2.15 km2 (0.83 sq mi) respectively.[3]
Villages
In Manitoba, an urban municipality may be named a village upon formation. Other than the minimum requirements to incorporate as an urban municipality (1,000 residents and 400 people/km2), the Municipal Act has no minimum population threshold to limit the naming of them as villages. A village can alternately be named a town or urban municipality under the Municipal Act or a city if it has a minimum population of 7,500.[4]
Manitoba has 2 villages[6] that had a cumulative population of 1,933 in the 2016 census.[3] These are St-Pierre-Jolys and Dunnottar with populations of 1,170 and 763 respectively.[3]
List of urban municipalities
 Manitoba Legislature in downtown Winnipeg, Manitoba's capital and largest municipality
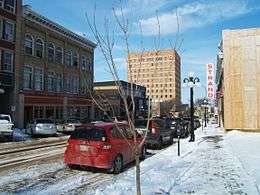 Downtown Brandon, Manitoba's second largest municipality
 Downtown Steinbach, Manitoba's third largest municipality
 Aerial view of Vale's Thompson Mill and Thompson, Manitoba's fourth largest municipality
| Name | Municipal status | Incorporation date[13] |
2016 Census of Population[3] | ||||
|---|---|---|---|---|---|---|---|
| Population (2016) |
Population (2011) |
Change |
Land area (km²) |
Population density | |||
| Altona[lower-alpha 2] | Town | December 31, 1945 | 4,212 | 4,088 | +3.0% | 9.38 | 449.0/km2 |
| Arborg[lower-alpha 2] | Town | January 1, 1964 | 1,232 | 1,152 | +6.9% | 2.21 | 557.5/km2 |
| Beausejour[lower-alpha 2] | Town | November 5, 1908 | 3,219 | 3,126 | +3.0% | 5.42 | 593.9/km2 |
| Brandon | City | May 30, 1882 | 48,859 | 46,061 | +6.1% | 77.41 | 631.2/km2 |
| Carberry[lower-alpha 2] | Town | December 20, 1889 | 1,738 | 1,669 | +4.1% | 4.96 | 350.4/km2 |
| Carman[lower-alpha 2] | Town | November 3, 1899 | 3,164 | 3,027 | +4.5% | 4.34 | 729.0/km2 |
| Churchill[lower-alpha 3] | Town | January 1, 1959 | 899 | 813 | +10.6% | 53.96 | 16.7/km2 |
| Dauphin[lower-alpha 4] | City | July 11, 1898 | 8,457 | 8,251 | +2.5% | 12.61 | 670.7/km2 |
| Dunnottar | Village | December 31, 1947 | 763 | 696 | +9.6% | 2.78 | 274.5/km2 |
| Flin Flon (part)[lower-alpha 5] | City | August 15, 1933 | 4,991[14][lower-alpha 6] | 5,405 | −7.7% | 13.87[lower-alpha 7] | 359.8/km2 |
| Gillam[lower-alpha 3] | Town | May 1, 1966 | 1,265 | 1,332 | −5.0% | 1,996.34 | 0.6/km2 |
| Grand Rapids[lower-alpha 3] | Town | March 1, 1962 | 268 | 279 | −3.9% | 87.04 | 3.1/km2 |
| Lac du Bonnet[lower-alpha 2] | Town | December 31, 1947 | 1,089 | 1,069 | +1.9% | 2.15 | 506.5/km2 |
| Leaf Rapids[lower-alpha 3] | Town | December 1, 1971 | 582 | 498 | +16.9% | 1,272.83 | 0.5/km2 |
| Lynn Lake[lower-alpha 3] | Town | May 9, 1959 | 494 | 674 | −26.7% | 910.23 | 0.5/km2 |
| Melita[lower-alpha 2] | Town | May 15, 1902 | 1,042 | 1,069 | −2.5% | 3.04 | 342.8/km2 |
| Minnedosa | Town | March 2, 1883 | 2,449 | 2,587 | −5.3% | 15.39 | 159.1/km2 |
| Morden[lower-alpha 4] | City | May 1, 1895 | 8,668 | 7,812 | +11.0% | 16.37 | 529.5/km2 |
| Morris | Town | January 29, 1883 | 1,885 | 1,797 | +4.9% | 6.10 | 309.0/km2 |
| Neepawa | Town | November 23, 1883 | 4,609 | 3,629 | +27.0% | 17.35 | 265.6/km2 |
| Niverville[lower-alpha 2] | Town | January 1, 1969 | 4,610 | 3,540 | +30.2% | 8.69 | 530.5/km2 |
| The Pas | Town | May 17, 1912 | 5,369 | 5,513 | −2.6% | 49.52 | 108.4/km2 |
| Portage la Prairie[lower-alpha 8] | City | November 12, 1880 | 13,304 | 12,996 | +2.4% | 24.68 | 539.1/km2 |
| Powerview-Pine Falls[lower-alpha 2][lower-alpha 9] | Town | January 1, 1951 | 1,316 | 1,314 | +0.2% | 5.02 | 262.2/km2 |
| Selkirk[lower-alpha 8] | City | June 15, 1882 | 10,278 | 9,834 | +4.5% | 24.86 | 413.4/km2 |
| Snow Lake[lower-alpha 3] | Town | June 2, 1947 | 899 | 723 | +24.3% | 1,211.89 | 0.7/km2 |
| Ste. Anne[lower-alpha 2] | Town | January 1, 1963 | 2,114 | 1,626 | +30.0% | 4.23 | 499.8/km2 |
| Steinbach[lower-alpha 8] | City | December 31, 1946 | 15,829 | 13,524 | +17.0% | 25.59 | 618.6/km2 |
| Stonewall[lower-alpha 2] | Town | August 14, 1906 | 4,809 | 4,536 | +6.0% | 5.99 | 802.8/km2 |
| St-Pierre-Jolys[lower-alpha 10] | Village | December 31, 1947 | 1,170 | 1,099 | +6.5% | 2.66 | 439.8/km2 |
| Swan River | Town | May 11, 1908 | 4,014 | 3,907 | +2.7% | 7.16 | 560.6/km2 |
| Teulon[lower-alpha 2] | Town | May 6, 1919 | 1,201 | 1,124 | +6.9% | 3.23 | 371.8/km2 |
| Thompson[lower-alpha 8] | City | January 1, 1967 | 13,678 | 13,123 | +4.2% | 20.79 | 657.9/km2 |
| Virden[lower-alpha 2] | Town | August 2, 1890 | 3,322 | 3,114 | +6.7% | 8.97 | 370.3/km2 |
| Winkler[lower-alpha 4] | City | April 7, 1906 | 12,660[14] | 10,670 | +18.7% | 17.00 | 744.7/km2 |
| Winnipeg | City | November 8, 1873 | 705,244 | 663,617 | +6.3% | 464.33 | 1,518.8/km2 |
| Winnipeg Beach[lower-alpha 2] | Town | November 2, 1909 | 1,145 | 1,011 | +13.3% | 3.87 | 295.9/km2 |
| Total cities | — | — | 841,968 | 791,293 | +6.4% | 697.51 | 1,207.1/km2 |
| Total towns | — | — | 56,946 | 53,217 | +7.0% | 5,699.31 | 10.0/km2 |
| Total villages | — | — | 1,933 | 1,795 | +7.7% | 5.44 | 355.3/km2 |
| Total urban municipalities | — | — | 900,769 | 846,305 | +6.4% | 6,402.26 | 140.7/km2 |
| Province of Manitoba | — | — | 1,278,365 | 1,208,268 | +5.8% | 552,370.99 | 2.3/km2 |
Rural municipalities

Manitoba's Municipal Act, enacted in 1987, defines rural municipality (RM) as an incorporated "area with at least 1,000 residents and a population density of less than 400 residents per square kilometre."[4] Manitoba has 98 rural municipalities[20] that had a cumulative population of 301,889 in the 2016 census.[3] These totals represent 23.6% of Manitoba's population and 18.4% of its land area. The province's largest and smallest rural municipalities by population are the Hanover and the Victoria Beach with populations of 15,733 and 398 respectively.[3] The province's largest and smallest rural municipalities by area the RM of Reynolds and the Victoria Beach with land areas of 3,572.13 km2 (1,379.21 sq mi) and 20.26 km2 (7.82 sq mi) respectively.[3]
Of Manitoba's 98 rural municipalities, 8 have populations less than the current minimum population requirement of 1,000. All of these were incorporated as rural municipalities prior to the Municipal Act being enacted in 1996.[4][13] In the case of the RM of Shellmouth-Boulton, it was formed through the amalgamation of the former RMs of Shellmouth and Boulton in 1999.[21]
| Name | Incorporation date[13] |
2016 Census of Population[3] | ||||
|---|---|---|---|---|---|---|
| Population (2016) |
Population (2011) |
Change |
Land area (km²) |
Population density | ||
| Alexander[lower-alpha 11] | January 1, 1945 | 3,333 | 2,983 | +11.7% | 1,569.62 | 2.1/km2 |
| Alonsa[lower-alpha 11] | January 1, 1945 | 1,247 | 1,270 | −1.8% | 2,980.04 | 0.4/km2 |
| Argyle | August 15, 1881 | 1,025 | 1,071 | −4.3% | 769.87 | 1.3/km2 |
| Armstrong[lower-alpha 11] | January 1, 1945 | 1,792 | 1,835 | −2.3% | 1,865.89 | 1.0/km2 |
| Bifrost – Riverton | January 1, 2015 | 3,378 | 3,514 | −3.9% | 1,643.81 | 2.1/km2 |
| Boissevain – Morton | January 1, 2015 | 2,353 | 2,270 | +3.7% | 1,091.90 | 2.2/km2 |
| Brenda – Waskada | January 1, 2015 | 674 | 652 | +3.4% | 765.78 | 0.9/km2 |
| Brokenhead | November 15, 1900 | 5,122 | 4,635 | +10.5% | 752.01 | 6.8/km2 |
| Cartier | February 21, 1914 | 3,368 | 3,153 | +6.8% | 553.40 | 6.1/km2 |
| Cartwright – Roblin | January 1, 2015 | 1,308 | 1,240 | +5.5% | 716.75 | 1.8/km2 |
| Clanwilliam – Erickson | January 1, 2015 | 870 | 901 | −3.4% | 352.15 | 2.5/km2 |
| Coldwell | November 19, 1912 | 1,254 | 1,351 | −7.2% | 901.76 | 1.4/km2 |
| Cornwallis | December 22, 1883 | 4,520 | 4,378 | +3.2% | 500.36 | 9.0/km2 |
| Dauphin | November 26, 1897 | 2,388 | 2,200 | +8.5% | 1,516.59 | 1.6/km2 |
| Deloraine – Winchester | January 1, 2015 | 1,489 | 1,485 | +0.3% | 727.14 | 2.0/km2 |
| De Salaberry | December 22, 1883 | 3,580 | 3,450 | +3.8% | 671.02 | 5.3/km2 |
| Dufferin | November 1, 1890 | 2,435 | 2,394 | +1.7% | 913.27 | 2.7/km2 |
| East St. Paul | November 3, 1915 | 9,372 | 9,046 | +3.6% | 41.99 | 223.2/km2 |
| Ellice – Archie | January 1, 2015 | 887 | 971 | −8.7% | 1,155.80 | 0.8/km2 |
| Elton | December 22, 1883 | 1,273 | 1,257 | +1.3% | 570.97 | 2.2/km2 |
| Emerson – Franklin | January 1, 2015 | 2,537 | 2,439 | +4.0% | 973.05 | 2.6/km2 |
| Ethelbert | January 1, 2015 | 607 | 629 | −3.5% | 1,136.94 | 0.5/km2 |
| Fisher[lower-alpha 11] | January 1, 1945 | 1,708 | 1,704 | +0.2% | 1,479.35 | 1.2/km2 |
| Gilbert Plains | January 1, 2015 | 1,470 | 1,623 | −9.4% | 1,051.23 | 1.4/km2 |
| Gimli | August 15, 1881 | 6,181 | 5,845 | +5.7% | 318.75 | 19.4/km2 |
| Glenboro – South Cypress | January 1, 2015 | 1,565 | 1,483 | +5.5% | 1,099.05 | 1.4/km2 |
| Glenella – Lansdowne | January 1, 2015 | 1,181 | 1,245 | −5.1% | 1,265.37 | 0.9/km2 |
| Grahamdale[lower-alpha 11] | January 1, 1945 | 1,359 | 1,354 | +0.4% | 2,385.42 | 0.6/km2 |
| Grandview | January 1, 2015 | 1,482 | 1,508 | −1.7% | 1,154.81 | 1.3/km2 |
| Grassland | January 1, 2015 | 1,561 | 1,480 | +5.5% | 1,344.46 | 1.2/km2 |
| Grey | January 1, 2015 | 2,648 | 2,615 | +1.3% | 960.57 | 2.8/km2 |
| Hamiota | January 1, 2015 | 1,225 | 1,288 | −4.9% | 576.43 | 2.1/km2 |
| Hanover | May 25, 1881 | 15,733 | 14,026 | +12.2% | 741.52 | 21.2/km2 |
| Harrison Park | January 1, 2015 | 1,622 | 1,799 | −9.8% | 977.63 | 1.7/km2 |
| Headingley | May 9, 1992 | 3,579 | 3,215 | +11.3% | 107.27 | 33.4/km2 |
| Hillsburg – Roblin – Shell River | January 1, 2015 | 3,214 | 3,284 | −2.1% | 1,690.73 | 1.9/km2 |
| Kelsey[lower-alpha 11] | January 1, 1945 | 2,424 | 2,330 | +4.0% | 867.75 | 2.8/km2 |
| Killarney-Turtle Mountain | August 15, 1881 | 3,429 | 3,233 | +6.1% | 926.14 | 3.7/km2 |
| La Broquerie | May 25, 1881 | 6,076 | 5,198 | +16.9% | 579.26 | 10.5/km2 |
| Lac du Bonnet | April 6, 1912 | 3,121 | 2,930 | +6.5% | 1,100.98 | 2.8/km2 |
| Lakeshore | January 1, 2015 | 1,363 | 1,401 | −2.7% | 1,297.07 | 1.1/km2 |
| Lorne | January 1, 2015 | 3,041 | 3,006 | +1.2% | 909.40 | 3.3/km2 |
| Louise | January 1, 2015 | 1,918 | 1,932 | −0.7% | 939.01 | 2.0/km2 |
| Macdonald | May 25, 1881 | 7,162 | 6,280 | +14.0% | 1,158.33 | 6.2/km2 |
| McCreary | January 1, 2015 | 892 | 948 | −5.9% | 524.25 | 1.7/km2 |
| Minitonas – Bowsman | January 1, 2015 | 1,653 | 1,816 | −9.0% | 1,201.05 | 1.4/km2 |
| Minto – Odanah | January 1, 2015 | 1,189 | 1,177 | +1.0% | 744.04 | 1.6/km2 |
| Montcalm | May 25, 1881 | 1,260 | 1,309 | −3.7% | 468.04 | 2.7/km2 |
| Morris | February 14, 1880 | 3,047 | 2,999 | +1.6% | 1,038.32 | 2.9/km2 |
| Mossey River | January 1, 2015 | 1,145 | 1,186 | −3.5% | 1,123.94 | 1.0/km2 |
| Mountain[lower-alpha 11][lower-alpha 12] | January 1, 1945 | 978 | 1,104 | −11.4% | 2,607.77 | 0.4/km2 |
| Norfolk Treherne | January 1, 2015 | 1,751 | 1,741 | +0.6% | 733.52 | 2.4/km2 |
| North Cypress – Langford | January 1, 2015 | 2,745 | 2,627 | +4.5% | 1,761.89 | 1.6/km2 |
| North Norfolk | January 1, 2015 | 3,853 | 3,762 | +2.4% | 1,160.09 | 3.3/km2 |
| Oakland – Wawanesa | January 1, 2015 | 1,690 | 1,618 | +4.4% | 576.68 | 2.9/km2 |
| Oakview | January 1, 2015 | 1,626 | 1,513 | +7.5% | 1,147.33 | 1.4/km2 |
| Pembina | January 1, 2015 | 2,347 | 2,369 | −0.9% | 1,118.33 | 2.1/km2 |
| Piney[lower-alpha 11] | January 1, 1945 | 1,726 | 1,720 | +0.3% | 2,433.10 | 0.7/km2 |
| Pipestone | December 22, 1883 | 1,458 | 1,447 | +0.8% | 1,149.31 | 1.3/km2 |
| Portage la Prairie | February 14, 1880 | 6,975 | 6,525 | +6.9% | 1,961.97 | 3.6/km2 |
| Prairie Lakes | January 1, 2015 | 1,453 | 1,423 | +2.1% | 1,062.42 | 1.4/km2 |
| Prairie View | January 1, 2015 | 2,088 | 2,167 | −3.6% | 1,698.56 | 1.2/km2 |
| Reynolds[lower-alpha 11] | January 1, 1945 | 1,338 | 1,285 | +4.1% | 3,572.13 | 0.4/km2 |
| Rhineland | January 1, 2015 | 5,945 | 5,772 | +3.0% | 960.40 | 6.2/km2 |
| Riding Mountain West | January 1, 2015 | 1,420 | 1,390 | +2.2% | 1,623.39 | 0.9/km2 |
| Ritchot | November 1, 1890 | 6,679 | 5,478 | +21.9% | 333.55 | 20.0/km2 |
| Riverdale | January 1, 2015 | 2,133 | 2,019 | +5.6% | 571.16 | 3.7/km2 |
| Rockwood | February 14, 1880 | 7,823 | 7,964 | −1.8% | 1,199.93 | 6.5/km2 |
| Roland | November 1, 1908 | 1,129 | 1,058 | +6.7% | 485.21 | 2.3/km2 |
| Rosedale | December 22, 1883 | 1,672 | 1,627 | +2.8% | 864.55 | 1.9/km2 |
| Rossburn | January 1, 2015 | 976 | 1,046 | −6.7% | 682.79 | 1.4/km2 |
| Rosser | March 11, 1893 | 1,372 | 1,352 | +1.5% | 441.56 | 3.1/km2 |
| Russell – Binscarth | January 1, 2015 | 2,442 | 2,553 | −4.3% | 571.37 | 4.3/km2 |
| Sifton | January 1, 2015 | 1,256 | 1,172 | +7.2% | 768.42 | 1.6/km2 |
| Souris – Glenwood | January 1, 2015 | 2,562 | 2,439 | +5.0% | 582.90 | 4.4/km2 |
| Springfield | September 27, 1873 | 15,342 | 14,069 | +9.0% | 1,100.92 | 13.9/km2 |
| St. Andrews | February 14, 1880 | 11,913 | 11,875 | +0.3% | 752.22 | 15.8/km2 |
| St. Clements | December 22, 1883 | 10,876 | 10,505 | +3.5% | 730.11 | 14.9/km2 |
| St. François Xavier | February 14, 1880 | 1,411 | 1,240 | +13.8% | 204.56 | 6.9/km2 |
| St. Laurent | May 25, 1881 | 1,338 | 1,305 | +2.5% | 465.29 | 2.9/km2 |
| Stanley | November 1, 1890 | 8,969[14] | 8,356 | +7.3% | 836.70 | 10.7/km2 |
| Ste. Anne | February 14, 1880 | 5,003 | 4,686 | +6.8% | 477.76 | 10.5/km2 |
| Ste. Rose | January 1, 2015 | 1,712 | 1,794 | −4.6% | 629.92 | 2.7/km2 |
| Stuartburn[lower-alpha 11] | January 1, 1945 | 1,648 | 1,535 | +7.4% | 1,163.54 | 1.4/km2 |
| Swan Valley West | January 1, 2015 | 2,829 | 2,923 | −3.2% | 1,721.22 | 1.6/km2 |
| Taché | February 14, 1880 | 11,568 | 10,284 | +12.5% | 581.23 | 19.9/km2 |
| Thompson | November 1, 1908 | 1,422 | 1,397 | +1.8% | 528.83 | 2.7/km2 |
| Two Borders | January 1, 2015 | 1,175 | 1,310 | −10.3% | 2,309.03 | 0.5/km2 |
| Victoria | November 15, 1902 | 1,132[14] | 1,119 | +1.2% | 697.86 | 1.6/km2 |
| Victoria Beach | March 14, 1919 | 398 | 374 | +6.4% | 20.26 | 19.6/km2 |
| Wallace – Woodworth | January 1, 2015 | 2,948 | 2,857 | +3.2% | 1,967.91 | 1.5/km2 |
| West Interlake | January 1, 2015 | 2,162 | 2,206 | −2.0% | 1,621.30 | 1.3/km2 |
| WestLake – Gladstone | January 1, 2015 | 3,154 | 3,068 | +2.8% | 1,832.55 | 1.7/km2 |
| West St. Paul | November 3, 1915 | 5,368 | 4,932 | +8.8% | 87.81 | 61.1/km2 |
| Whitehead | December 22, 1883 | 1,661 | 1,533 | +8.3% | 563.90 | 2.9/km2 |
| Whitemouth | March 1, 1905 | 1,548 | 1,548 | 0.0% | 703.02 | 2.2/km2 |
| Woodlands | February 14, 1880 | 3,416 | 3,521 | −3.0% | 1,178.04 | 2.9/km2 |
| Yellowhead | January 1, 2015 | 1,948 | 1,973 | −1.3% | 1,108.48 | 1.8/km2 |
| Total rural municipalities | — | 301,438 | 288,919 | +4.3% | 101,551.07 | 3.0/km2 |
| Province of Manitoba | — | 1,278,365 | 1,208,268 | +5.8% | 552,370.99 | 2.3/km2 |
Local government districts
Manitoba's Local Government Districts Act, enacted in 1987, defines a local government district (LGD) as "an area or areas that is or are wholly or partly in unorganized territory or in a disorganized municipality" with inhabitants. LGDs are incorporated by Manitoba's Lieutenant Governor in Council through passage of a regulation.[5]
Manitoba has two LGDs:[6] Mystery Lake and Pinawa.[7] For municipal statistical purposes, Mystery Lake is considered a rural municipality while Pinawa is considered an urban municipality.[7]
| Name | Incorporation date[13] |
2016 Census of Population[3] | ||||
|---|---|---|---|---|---|---|
| Population (2016) |
Population (2011) |
Change |
Land area (km²) |
Population density | ||
| Mystery Lake | December 5, 1956 | 0 | 10 | −100.0% | 3,460.46 | 0.0/km2 |
| Pinawa | January 4, 1962 | 1,504 | 1,444 | +4.2% | 128.54 | 11.7/km2 |
| Total local government district | — | 1,504 | 1,454 | +3.4% | 3,589.00 | 0.4/km2 |
See also
- Amalgamation of Winnipeg
- List of census agglomerations in Manitoba
- List of communities in Manitoba by population
- Manitoba municipal amalgamations, 2015
Notes
- The remaining 6% of Manitoba's population resides on Indian reserves, Indian settlements, the vast unincorporated portions of central and northern Manitoba and other unincorporated areas. Together, they occupy the remaining 80% of the province's land mass.[3]
- The towns of Altona, Arborg, Beausejour, Carberry, Carman, Lac du Bonnet, Melita, Niverville, Powerview-Pine Falls, Ste. Anne, Stonewall, Teulon, Virden and Winnipeg Beach were originally incorporated as villages.[13]
- The towns of Churchill, Gillam, Grand Rapids, Leaf Rapids, Lynn Lake and Snow Lake were originally incorporated as local government districts.[13]
- The cities of Dauphin, Morden and Winkler were originally incorporated as villages and each also held town status prior to acquiring their current city status.[13]
- The City of Flin Flon was originally incorporated as a municipal district and also held town status prior to acquiring its current city status.[16]
- This population does not include 203 in the Saskatchewan portion of Flin Flon.[17] The city's total population in 2011 was 5,592.
- This land area does not include 2.37 km2 (0.92 sq mi) in the Saskatchewan portion of Flin Flon.[17] The city's total land area is 16.24 km2 (6.27 sq mi).
- The cities of Portage la Prairie, Selkirk, Steinbach and Thompson were originally incorporated as towns.[13]
- The Town of Powerview-Pine Falls originally incorporated under the name of the Village of Powerview. Its renaming occurred on May 1, 2005 when it simultaneously absorbed the neighbouring community of Pine Falls and changed to town status.[18]
- The Village of St-Pierre-Jolys originally incorporated under the name of the Village of St. Pierre. Its renaming occurred on January 1, 1977.[19]
- The rural municipalities of Alexander, Alonsa, Armstrong, Fisher, Grahamdale, Kelsey, Mountain, Park, Piney, Reynolds and Stuartburn were originally incorporated as local government districts.[13]
- Statistics Canada divides the RM of Mountain into two parts. In the 2016 census, the north portion had a population of 559, a -12.2% change from its 2011 population of 637, and a land area and population density of 990.69 km2 (382.51 sq mi) and 0.6/km2 (1.5/sq mi) respectively. Meanwhile, the south portion had a population of 419, a -10.2% change from its 2011 population of 467, and a land area and population density of 1,617.08 km2 (624.36 sq mi) and 0.3/km2 (0.7/sq mi) respectively.[3]
References
- "Population and dwelling counts, for Canada, provinces and territories, 2016 and 2011 censuses – 100% data". Statistics Canada. February 8, 2017. Retrieved February 11, 2017.
- "Report of Manitoba Local Government" (PDF). Manitoba Department of Local Government. Archived from the original (pdf) on February 14, 2015. Retrieved September 12, 2013.
- "Population and dwelling counts, for Canada, provinces and territories, and census subdivisions (municipalities), 2016 and 2011 censuses – 100% data (Manitoba)". Statistics Canada. February 8, 2017. Retrieved February 11, 2017.
- "The Municipal Act (enacted 1996)". Government of Manitoba. September 12, 2013. Retrieved September 16, 2013.
- "The Local Government Districts Act (enacted 1987)". Government of Manitoba. September 24, 2013. Retrieved September 26, 2013.
- "Interim List of Changes to Municipal Boundaries, Status, and Names: From January 2, 2012 to January 1, 2013" (pdf). Statistics Canada. pp. 6–7. Retrieved September 13, 2013.
- "2010 Statistical Information for Municipalities in the Province of Manitoba" (PDF). Manitoba Department of Local Government. Archived from the original (pdf) on September 29, 2013. Retrieved September 12, 2013.
- "Municipal Acts". Government of Manitoba. September 12, 2013. Retrieved September 16, 2013.
- "Manitoba Local Government". Province of Manitoba. Retrieved September 27, 2013.
- "Regional Profiles – Tourism Profiles – RM of Springfield". Partnership of the Manitoba Capital Region. Archived from the original on September 9, 2013. Retrieved September 10, 2013.
- "Manitoba Municipalities: Springfield". The Manitoba Historical Society. August 2, 2013. Retrieved September 10, 2013.
- "The Incorporation of Winnipeg". The Manitoba Historical Society. June 30, 2009. Retrieved September 10, 2013.
- "MHS Resources: Manitoba's Municipal History". The Manitoba Historical Society. Retrieved September 12, 2013.
- "Population and dwelling count amendments, 2016 Census". Statistics Canada. January 16, 2018. Retrieved February 3, 2018.
- "Morden Gets City Status". City of Morden. August 27, 2012. Archived from the original on September 23, 2012. Retrieved December 24, 2012.
- "Manitoba Municipalities: Flin Flon". The Manitoba Historical Society. May 13, 2013. Retrieved September 15, 2013.
- "Population and dwelling counts, for Canada, provinces and territories, and census subdivisions (municipalities), 2016 and 2011 censuses – 100% data (Saskatchewan)". Statistics Canada. February 8, 2017. Retrieved February 11, 2017.
- "Manitoba Municipalities: Powerview-Pine Falls". The Manitoba Historical Society. April 22, 2013. Retrieved September 15, 2013.
- "Manitoba Municipalities: St-Pierre-Jolys". The Manitoba Historical Society. April 22, 2013. Retrieved September 15, 2013.
- "2010 Statistical Information for Municipalities in the Province of Manitoba" (PDF). Manitoba Department of Local Government. Archived from the original (PDF) on September 29, 2013. Retrieved September 12, 2013.
- "Manitoba Municipalities: Shellmouth-Boulton". The Manitoba Historical Society. September 24, 2013. Retrieved September 26, 2013.
External links
| |||||||||||||||||||||||||