List of countries by barley production
This is a list of countries by barley production in 2016 based on the Food and Agriculture Organization Corporate Statistical Database.[1] The total world barley production for 2016 was 141,277,993 metric tonnes.
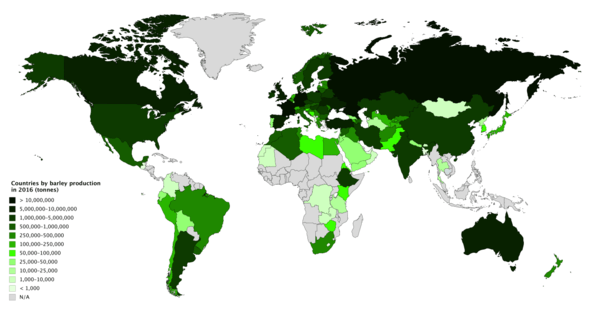
Countries by barley production in 2016
In 2018 production was 170 mln tonnes. [2]
Production by country
>1,000,000 tonnes
| Rank | Country/Region | Barley production (tonnes) |
|---|---|---|
| 1 | 17,992,517 | |
| 2 | 10,730,500 | |
| 3 | 10,306,008 | |
| 4 | 9,435,710 | |
| 5 | 8,992,274 | |
| 6 | 8,704,300 | |
| 7 | 7,979,590 | |
| 8 | 6,700,000 | |
| 9 | 6,655,000 | |
| 10 | 4,338,850 | |
| 11 | 3,949,600 | |
| 12 | 3,441,090 | |
| 13 | 3,308,384 | |
| 14 | 3,231,268 | |
| 15 | 2,907,572 | |
| 16 | 2,024,922 | |
| 17 | 1,845,254 | |
| 18 | 1,817,269 | |
| 19 | 1,780,355 | |
| 20 | 1,580,700 | |
| 21 | 1,530,400 | |
| 22 | 1,505,000 | |
| 23 | 1,479,900 | |
| 24 | 1,252,690 | |
| 25 | 1,157,553 | |
100,000–1,000,000 tonnes
| Rank | Country/Region | Barley production (tonnes) |
|---|---|---|
| 26 | 988,285 | |
| 27 | 978,349 | |
| 28 | 928,923 | |
| 29 | 919,907 | |
| 30 | 859,702 | |
| 31 | 689,850 | |
| 32 | 678,000 | |
| 33 | 626,900 | |
| 34 | 619,919 | |
| 35 | 584,602 | |
| 36 | 543,064 | |
| 37 | 500,001 | |
| 38 | 499,222 | |
| 39 | 415,266 | |
| 40 | 405,969 | |
| 41 | 395,501 | |
| 42 | 379,687 | |
| 43 | 364,186 | |
| 44 | 357,387 | |
| 45 | 345,559 | |
| 46 | 339,135 | |
| 47 | 327,621 | |
| 48 | 301,856 | |
| 49 | 283,200 | |
| 50 | 263,165 | |
| 51 | 255,707 | |
| 52 | 240,000 | |
| 53 | 236,231 | |
| 54 | 204,497 | |
| 55 | 197,057 | |
| 56 | 170,400 | |
| 57 | 159,023 | |
| 58 | 144,832 | |
| 59 | 141,957 | |
| 60 | 120,100 | |
| 61 | 108,268 | |
10,000–100,000 tonnes
| Rank | Country/Region | Barley production (tonnes) |
|---|---|---|
| 62 | 91,653 | |
| 63 | 77,294 | |
| 64 | 73,893 | |
| 65 | 67,038 | |
| 66 | 61,000 | |
| 67 | 56,084 | |
| 68 | 55,119 | |
| 69 | 54,913 | |
| 70 | 47,200 | |
| 71 | 46,615 | |
| 72 | 46,002 | |
| 73 | 37,929 | |
| 74 | 33,995 | |
| 75 | 32,801 | |
| 76 | 32,771 | |
| 77 | 29,300 | |
| 78 | 28,134 | |
| 79 | 25,810 | |
| 80 | 25,414 | |
| 81 | 20,000 | |
| 82 | 17,300 | |
| 83 | 15,370 | |
| 84 | 13,750 | |
| 85 | 10,861 | |
| 86 | 10,277 | |
1,000–10,000 tonnes
| Rank | Country/Region | Barley production (tonnes) |
|---|---|---|
| 87 | 9,769 | |
| 88 | 9,000 | |
| 89 | 7,449 | |
| 90 | 6,465 | |
| 91 | 2,139 | |
| 92 | 2,036 | |
| 93 | 1,956 | |
| 94 | 1,847 | |
| 95 | 1,591 | |
| 96 | 1,433 | |
| 97 | 1,068 | |
| 98 | 1,039 | |
<1,000 tonnes
| Rank | Country/Region | Barley production (tonnes) |
|---|---|---|
| 99 | 672 | |
| 100 | 511 | |
| 101 | 317 | |
| 102 | 127 | |
| 103 | 18 | |
References
- "Crops". FAOSTAT. Retrieved 2018-08-12. Countries - Select All; Regions - World + (Total); Elements - Production Quantity; Items - Barley; Years - 2016
- https://www.statista.com/statistics/272760/barley-harvest-forecast/
This article is issued from Wikipedia. The text is licensed under Creative Commons - Attribution - Sharealike. Additional terms may apply for the media files.