List of countries by grape production
This is a list of countries by grape production in 2016 and 2017, based on data from the Food and Agriculture Organization Corporate Statistical Database.[1] The estimated total world production for grapes in 2017 was 74,276,583 metric tonnes, down 1.0% from 74,992,047 tonnes in 2016.[n 1] China was the largest producer of grapes, accounting for 16.8% of global production. Italy came second at 10.9%, followed by the United States at 9.6%.
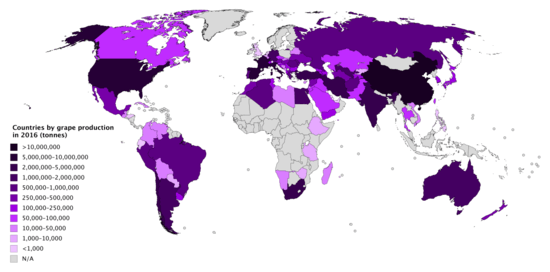
Countries by grape production in 2016
Production by country
>1,000,000 tonnes
| Rank | Country/Region | 2017 | 2016 |
|---|---|---|---|
| 1 | 13,083,000 | 12,629,000 | |
| 2 | 7,169,745 | 8,201,914 | |
| 3 | 6,679,211 | 7,225,636 | |
| 4 | 5,915,882 | 6,247,034 | |
| 5 | 5,387,379 | 5,950,719 | |
| 6 | 4,200,000 | 4,000,000 | |
| 7 | 2,922,000 | 2,590,000 | |
| 8 | 2,032,582 | 1,966,291 | |
| 9 | 2,000,000 | 2,200,000 | |
| 10 | 1,965,206 | 1,758,418 | |
| 11 | 1,912,034 | 985,074 | |
| 12 | 1,866,340 | 2,275,830 | |
| 13 | 1,824,431 | 1,772,911 | |
| 14 | 1,703,394 | 1,691,194 | |
| 15 | 1,625,511 | 1,569,739 | |
| 16 | 1,063,340 | 736,892 | |
| 17 | 1,014,235 | 1,225,570 | |
| 18 | 1,012,600 | 1,083,000 | |
100,000–1,000,000 tonnes
| Rank | Country/Region | 2017 | 2016 |
|---|---|---|---|
| 19 | 954,845 | 874,541 | |
| 20 | 868,635 | 773,904 | |
| 21 | 645,012 | 689,957 | |
| 22 | 576,507 | 615,739 | |
| 23 | 566,579 | 571,351 | |
| 24 | 536,851 | 551,733 | |
| 25 | 415,889 | 351,310 | |
| 26 | 409,610 | 377,780 | |
| 27 | 404,900 | 476,491 | |
| 28 | 396,000 | 436,000 | |
| 29 | 378,128 | 364,866 | |
| 30 | 331,428 | 260,337 | |
| 31 | 292,110 | 288,190 | |
| 32 | 259,083 | 264,348 | |
| 33 | 237,588 | 248,925 | |
| 34 | 228,303 | 214,775 | |
| 35 | 209,954 | 178,752 | |
| 36 | 202,948 | 205,001 | |
| 37 | 201,529 | 211,083 | |
| 38 | 180,800 | 159,200 | |
| 39 | 180,349 | 333,319 | |
| 40 | 176,100 | 179,200 | |
| 41 | 165,568 | 145,829 | |
| 42 | 152,843 | 136,499 | |
| 43 | 152,000 | 134,000 | |
| 44 | 135,357 | 130,234 | |
| 45 | 116,307 | 123,651 | |
| 46 | 100,364 | 136,352 | |
10,000–100,000 tonnes
| Rank | Country/Region | 2017 | 2016 |
|---|---|---|---|
| 47 | 99,444 | 94,103 | |
| 48 | 95,691 | 104,506 | |
| 49 | 89,443 | 105,802 | |
| 50 | 89,416 | 94,780 | |
| 51 | 86,328 | 80,454 | |
| 52 | 81,223 | 75,041 | |
| 53 | 79,774 | 75,905 | |
| 54 | 77,788 | 79,680 | |
| 55 | 74,140 | 74,140 | |
| 56 | 68,503 | 66,002 | |
| 57 | 57,920 | 64,071 | |
| 58 | 53,366 | 62,328 | |
| 59 | 45,859 | 37,832 | |
| 60 | 44,505 | 41,413 | |
| 61 | 39,124 | 39,900 | |
| 62 | 32,097 | 32,183 | |
| 63 | 30,718 | 29,152 | |
| 64 | 28,013 | 36,904 | |
| 65 | 27,203 | 26,510 | |
| 66 | 26,255 | 26,774 | |
| 67 | 22,550 | 21,167 | |
| 68 | 22,200 | 28,930 | |
| 69 | 21,940 | 21,569 | |
| 70 | 19,611 | 19,307 | |
| 71 | 19,420 | 18,885 | |
| 72 | 17,169 | 17,382 | |
| 73 | 17,021 | 17,583 | |
| 74 | 13,648 | 13,446 | |
| 75 | 10,806 | 11,032 | |
<10,000 tonnes
| Rank | Country/Region | 2017 | 2016 |
|---|---|---|---|
| 76 | 8,607 | 8,586 | |
| 77 | 5,277 | 5,270 | |
| 78 | 4,990 | 5,192 | |
| 79 | 3,628 | 3,707 | |
| 80 | 3,363 | 3,327 | |
| 81 | 2,400 | 2,251 | |
| 82 | 1,930 | 1,920 | |
| 83 | 517 | 509 | |
| 84 | 441 | 469 | |
| 85 | 400 | 350 | |
| 86 | 226 | N/A | |
| 87 | 218 | 215 | |
| 88 | 213 | 190 | |
| 89 | 212 | 211 | |
| 90 | 178 | 177 | |
| 91 | 149 | 149 | |
| 92 | 144 | 119 | |
| 93 | 30 | 32 | |
| 94 | 8 | 5 | |
Notes
- Sum of values for countries with available data, which may be official or FAO data based on imputation methodology
References
- "Crops". FAOSTAT. Retrieved 16 April 2019. Countries - Select All; Regions - World + (Total); Elements - Production Quantity; Items - Grapes; Years - 2017 + 2016
This article is issued from Wikipedia. The text is licensed under Creative Commons - Attribution - Sharealike. Additional terms may apply for the media files.