International wheat production statistics
The following international wheat production statistics come from the Food and Agriculture Organization figures from FAOSTAT database, older from International Grains Council figures from the report "Grain Market Report".
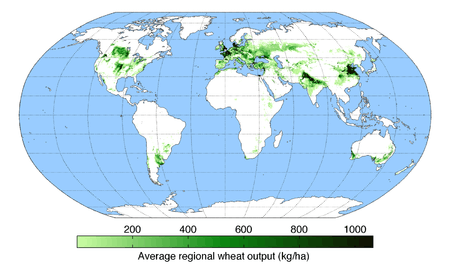
A map of worldwide wheat production.
The quantities of wheat in the following table are in million metric tonnes. All countries with a production quantity of at least 2 million metric tonnes are listed below.
| Country | 2017[1] | 2016[1] | 2015[2] | 2014[3] | 2013[4] | 2012[5] | 2011[5] | 2010[5] | 2009[5] | 2008[5] | 2007[5] | 2006[5] | 2005 [6] | 2004[6] | 2003[6] | 2002 | 2001 | 2000 | 1999 | 1998 | 1997 | 1996 |
|---|---|---|---|---|---|---|---|---|---|---|---|---|---|---|---|---|---|---|---|---|---|---|
| 150.2 | 142.7 | 161.4 | 157.2 | 143.3 | 134.5 | 140.0 | 136.5 | 138.5 | 150.3 | 120.1 | 126.7 | 135.4 | 149.4 | 111.7 | 133.6 | 126.6 | 132.4 | 123.1 | 134.1 | 126.4 | 124.3 | |
| 134.3 | 131.7 | 130.2 | 126.2 | 121.7 | 125.6 | 117.4 | 115.2 | 115.1 | 112.5 | 109.9 | 104.5 | 96.3 | 91.6 | 86.5 | 90.3 | 93.9 | 99.7 | 113.9 | 109.7 | 123.3 | 110.6 | |
| 98.5 | 93.5 | 86.5 | 94.5 | 93.5 | 94.9 | 86.9 | 80.7 | 80.7 | 78.6 | 74.9 | 69.4 | 72.0 | 72.1 | 65.1 | 72.8 | 69.7 | 76.4 | 70.8 | 65.9 | 69.4 | 62.6 | |
| 85.9 | 73.3 | 61.8 | 59.7 | 52.1 | 37.7 | 56.2 | 41.5 | 61.7 | 63.7 | 49.4 | 45.0 | 47.6 | 45.4 | 34.1 | 50.6 | 47.0 | 34.5 | 31.0 | 27.0 | 44.3 | 34.9 | |
| 47.3 | 62.9 | 55.8 | 55.4 | 60.0 | 61.8 | 54.4 | 60.1 | 60.3 | 68.0 | 53.6 | 57.3 | 57.1 | 58.7 | 63.8 | 44.1 | 53.3 | 60.8 | 62.7 | 69.4 | 67.5 | 62.0 | |
| 36.9 | 29.5 | 42.8 | 39.0 | 38.6 | 40.3 | 38.0 | 38.2 | 38.3 | 39.0 | 33.2 | 35.4 | 36.9 | 39.7 | 30.5 | 38.9 | 31.5 | 37.5 | 37.2 | 39.8 | 33.9 | 35.9 | |
| 31.8 | 22.3 | 23.7 | 25.3 | 22.9 | 29.9 | 27.4 | 22.1 | 21.7 | 21.4 | 13.0 | 10.8 | 25.1 | 21.9 | 26.1 | 10.1 | 24.3 | 18.5 | 24.1 | 22.1 | 19.4 | 23.7 | |
| 30.0 | 30.5 | 27.6 | 29.3 | 37.5 | 27.0 | 25.3 | 23.2 | 26.8 | 28.6 | 20.6 | 27.3 | 25.6 | 25.9 | 23.6 | 16.2 | 20.6 | 26.8 | 26.9 | 24.1 | 24.3 | 29.8 | |
| 26.7 | 26.0 | 25.1 | 26.0 | 24.2 | 23.5 | 25.2 | 23.3 | 24.0 | 21.0 | 23.5 | 21.3 | 21.6 | 19.5 | 19.2 | 18.2 | 19.0 | 21.1 | 17.9 | 18.7 | 16.7 | 16.9 | |
| 26.2 | 26.1 | 26.5 | 24.1 | 22.8 | 15.8 | 22.3 | 16.9 | 20.9 | 25.9 | 13.8 | 14.0 | 18.7 | 17.5 | 6.9 | 20.6 | 21.4 | 10.2 | 13.6 | 14.9 | 18.4 | 13.5 | |
| 24.5 | 24.5 | 26.5 | 27.8 | 25.0 | 22.4 | 22.8 | 24.1 | 25.2 | 26.0 | 21.4 | 22.4 | 23.6 | 25.4 | 19.3 | 20.8 | 22.8 | 21.6 | 19.6 | 20.2 | 19.8 | 18.9 | |
| 21.5 | 20.6 | 22.6 | 19.0 | 22.1 | 20.1 | 21.8 | 19.7 | 20.6 | 17.8 | 17.7 | 20.0 | 21.0 | 21.0 | 19.0 | 19.5 | 19.0 | 17.5 | 16.5 | 18.5 | 16.2 | 16.2 | |
| 18.4 | 18.6 | 11.6 | 13.9 | 8.0 | 11.0 | 16.4 | 14.9 | 8.9 | 8.5 | 16.5 | 14.0 | 16.0 | 14.6 | 14.5 | 12.3 | 15.4 | 16.5 | 15.7 | 11.5 | 14.8 | 15.9 | |
| 14.8 | 14.4 | 16.4 | 16.6 | 11.9 | 13.3 | 15.3 | 14.9 | 14.4 | 17.2 | 13.4 | 14.7 | 15.0 | 15.5 | 14.3 | 16.0 | 11.6 | 16.8 | 14.9 | 15.5 | 15.1 | 16.1 | |
| 14.8 | 15.0 | 13.7 | 13.0 | 13.9 | 13.3 | 22.7 | 9.6 | 17.1 | 12.6 | 16.5 | 13.5 | 11.1 | 9.9 | 11.5 | 12.7 | 12.7 | 9.1 | 11.2 | 4.8 | 8.7 | 8.0 | |
| 14.0[7] | 11.1[7] | 11.5 | 13.5[8] | 14.0[7] | 13.8[7] | 13.5[7] | 15.0 | 13.5 | 8.0 | 15.9 | 14.5 | 14.5 | 14.0 | 13.4 | 12.5 | 9.5 | 7.0 | 8.0 | 11.0 | 10.2 | 8.8 | |
| 11.7 | 10.8 | 11.0 | 11.6 | 9.5 | 8.6[7] | 9.3 | 9.5 | 9.8 | 9.3 | 8.4 | 7.1 | 8.6 | 9.9 | 7.9 | 9.3 | 9.3 | 8.5 | 9.1 | 9.5 | 8.2 | 8.6 | |
| 10.0 | 8.4 | 8.0 | 7.6 | 7.3 | 5.3 | 7.1 | 5.8 | 5.2 | 7.2 | 2.9 | 5.5 | 7.0 | 7.8 | 2.5 | 4.4 | 7.8 | 4.4 | 4.4 | 5.0 | 6.6 | 3.1 | |
| 8.8[7] | 9.0[7] | 9.6[7] | 9.3 | 9.5 | 8.8[7] | 8.4 | 7.2 | 8.5 | 8.0 | 7.4 | 8.3 | 8.1 | 7.2 | 6.8 | 6.6 | 6.3 | 6.6 | 6.3 | 6.0 | 5.8 | 5.7 | |
| 7.1 | 2.7 | 8.1 | 5.1 | 6.9 | 3.9 | 6.0 | 4.9 | 6.4 | 3.8 | 1.6 | 6.3 | 3.0 | 5.5 | 5.7 | 3.4 | 3.3 | 1.4 | 2.2 | 4.4 | 2.3 | 5.9 | |
| 7.0 | 8.0 | 7.4 | 7.1 | 7.0 | 7.4[7] | 6.6 | 6.8 | 6.3 | 8.9 | 7.3 | 7.1 | 7.5 | 8.6 | 6.2 | 7.6 | 6.5 | 6.9 | 7.3 | 8.1 | 6.8 | 8.3 | |
| 6.1 | 5.7 | 5.0 | 5.3 | 5.1 | 4.3[7] | 4.5 | 4.0 | 4.0 | 4.6 | 2.4 | 3.3 | 3.5 | 4.0 | 2.0 | 4.1 | 4.1 | 3.3 | 3.2 | 3.3 | 3.6 | 1.8 | |
| 6.1 | 6.9 | 7.0 | 7.0 | 6.8 | 6.5 | 6.5 | 6.7 | 6.6 | 6.1 | 6.2 | 6.1 | 6.1 | 5.4 | 5.4 | 5.0 | 3.7 | 3.5 | 3.6 | 3.6 | 3.0 | 2.7 | |
| 5.2 | 4.8 | 5.3 | 5.3 | 5.1 | 3.8 | 4.1 | 3.8 | 4.4 | 5.6 | 4.0 | 4.4 | 5.0 | 6.0 | 2.9 | 3.9 | 5.2 | 3.7 | 2.6 | 4.9 | 5.3 | 3.9 | |
| 4.8 | 4.2 | 5.0 | 4.9 | 4.1 | 4.5 | 4.8 | 5.1 | 5.9 | 5.0 | 4.5 | 4.8 | 4.8 | 4.8 | 4.7 | 4.1 | 4.7 | 4.7 | 4.5 | 5.0 | 5.0 | 4.8 | |
| 4.8 | 4.5 | 4.7 | 4.2 | 4.0 | 2.9 | 2.9 | 3.1 | 2.5 | 2.5 | 2.2 | 2.8 | 1.7 | 1.6 | 1.4 | 1.5 | 1.6 | 2.5 | 2.1 | 1.5 | 2.0 | 1.6 | |
| 4.8 | 6.4 | 6.4 | 6.5 | 7.6 | 4.7 | 6.9 | 5.6 | 4.7 | 6.7 | 6.4 | 5.6 | 3.8 | 7.1 | 6.3 | 6.8 | 5.0 | 7.3 | 4.9 | 5.3 | 4.6 | 6.0 | |
| 4.7 | 5.5 | 5.3 | 5.4 | 4.7 | 3.5 | 4.9 | 4.2 | 4.4 | 4.6 | 4.0 | 3.5 | 4.5 | 5.0 | 2.6 | 3.9 | 4.5 | 4.1 | 4.0 | 3.8 | 3.6 | 3.7 | |
| 4.3 | 6.8 | 5.5 | 6.3 | 5.7 | 4.4 | 5.7 | 6.0 | 5.1 | 6.0 | 4.1 | 2.5 | 5.2 | 5.7 | 6.2 | 3.1 | 3.4 | 1.7 | 2.5 | 2.3 | 2.5 | 3.3 | |
| 4.3 | 4.6 | 4.7 | 5.4 | 5.2 | 5.1 | 3.4 | 4.5 | 5.1 | 2.6 | 4.5 | 3.4 | 4.3 | 2.3 | 3.5 | 2.7 | 1.6 | 1.5 | 2.5 | 2.8 | 2.7 | 2.3 | |
| 3.9 | 3.8 | 4.4 | 3.2 | 2.9 | 3.0 | 1.9 | 1.7 | 2.1 | 1.7 | 1.4 | 0.8 | 1.4 | 1.4 | 1.2 | 1.2 | 1.1 | 1.2 | 0.9 | 1.0 | 1.1 | 0.9 | |
| 3.5 | 3.9 | 3.7 | 3.7 | 3.4 | 2.3 | 3.6 | 3.7 | 4.1 | 4.0 | 3.5 | 3.3 | 3.0 | 2.9 | 2.8 | 3.2 | 3.3 | 3.3 | 3.1 | 3.2 | 3.6 | 3.4 | |
| 3.3 | 2.8 | 3.3 | 3.1 | 1.9 | 2.3 | 2.3 | 2.2 | 2.3 | 2.2 | 2.3 | 2.0 | 2.2 | 2.4 | 2.3 | 2.1 | 2.4 | 2.4 | 1.7 | 2.2 | 2.1 | 2.0 | |
| 3.0 | 3.1 | 2.6 | 3.8[7] | 3.3[7] | 2.4 | 2.8 | 2.8 | 1.7 | 1.3 | 2.2 | 2.1 | 2.2 | 1.8 | 2.3 | 2.6 | 0.9 | 0.4 | 0.8 | 1.1 | 1.1 | 1.3 | |
| 2.6 | 2.3 | 2.9 | 2.9 | 2.1 | 2.6 | 2.2 | 1.7 | 2.0 | 2.0 | 1.4 | 1.1 | 1.2 | 1.1 | 0.8 | 1.0 | 0.9 | 1.0 | 0.7 | 0.8 | 0.7 | 0.6 | |
| 2.4 | 2.4 | 2.7 | 2.4 | 3.2[7] | 3.4 | 2.6 | 2.6 | 3.0 | 1.1 | 2.3 | 2.7 | 2.4 | 2.7 | 3.0 | 1.5 | 2.0 | 0.8 | 1.5 | 2.3 | 0.7 | 3.0 | |
| 2.3 | 2.9 | 2.4 | 2.4 | 2.7 | 1.9 | 2.1 | 1.6 | 2.1 | 2.1 | 2.1 | 1.9 | 2.7 | 2.8 | 1.4 | 2.3 | 2.5 | 2.3 | 2.1 | 2.9 | 3.1 | 1.5 | |
| 2.2[7] | 2.9[7] | 2.4 | 2.0 | 3.1[7] | 3.7[7] | 3.9 | 3.1 | 3.7 | 2.1 | 4.0 | 4.7 | 4.7 | 4.5 | 4.9 | 4.8 | 4.7 | 2.7 | 2.6 | 4.1 | 3.0 | 4.1 | |
| 2.1 | 2.1 | 2.3 | 1.5 | 1.4 | 1.5 | 0.9 | 1.0 | 1.0 | 1.0 | 0.8 | 0.6 | 0.7 | 0.5 | 0.5 | 0.5 | 0.5 | 0.4 | 0.4 | 0.4 | 0.4 | 0.4 | |
| World total | 771.7 | 749.5 | 737.0 | 733.5 | 711.0 | 672.7 | 697.7 | 640.3 | 684.2 | 681.0 | 606.7 | 614.5 | 626.9 | 634.9 | 550.1 | 592.0 | 588.2 | 585.0 | 584.8 | 596.2 | 614.7 | 578.6 |
References
- "Crops". FAOSTAT. Retrieved 2018-08-12. Countries - Select All; Regions - World + (Total); Elements - Production Quantity; Items - Wheat; Years - 2016
- "Crops". FAOSTAT. Retrieved 2018-08-12. Countries - Select All; Regions - World + (Total); Elements - Production Quantity; Items - Wheat; Years - 2015
- "FAOSTAT". faostat3.fao.org. Retrieved 2016-01-13.
- FAOSTAT
- FAOSTAT Archived 2013-01-14 at the Wayback Machine
- UN FAO Statistic
- unofficial figure
- FAOSTAT
This article is issued from Wikipedia. The text is licensed under Creative Commons - Attribution - Sharealike. Additional terms may apply for the media files.