Economy of Indonesia
The economy of Indonesia is the largest in Southeast Asia and is one of the emerging market economies of the world. Indonesia is a member of G20 and classified as a newly industrialised country.[22] It is the 16th largest economy in the world by nominal GDP and the 7th largest in terms of GDP (PPP). Estimated at US$40 billion in 2019, Indonesia’s Internet economy is expected to cross the US$130 billion mark by 2025.[23] Indonesia still depends on domestic market and government budget spending and its ownership of state-owned enterprises (the central government owns 141 enterprises). The administration of prices of a range of basic goods (including rice and electricity) also plays a significant role in Indonesia's market economy. However, since the 1990s, the majority of the economy has been controlled by individual Indonesians and foreign companies.[24][25][26]
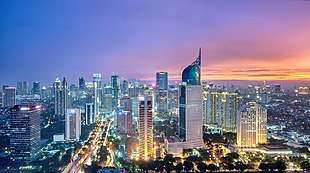 Jakarta, the financial centre of Indonesia | |
| Currency | Rupiah (IDR, Rp) |
|---|---|
| 1 January – 31 December | |
Trade organizations | APEC, WTO, G-20, IOR-ARC, RCEP, others |
Country group |
|
| Statistics | |
| Population | |
| GDP | |
| GDP rank | |
GDP growth |
|
GDP per capita | |
GDP per capita rank |
|
GDP by sector |
|
| 3.198% (2018)[5] | |
Population below poverty line | |
Labour force | |
Labour force by occupation |
|
| Unemployment | |
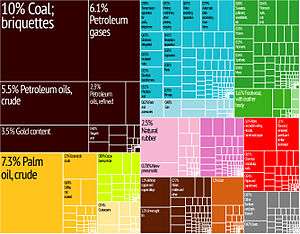
Main industries | palm oil, coal, petroleum and natural gas, textiles, automotive, electrical appliances, apparel, footwear, mining, cement, medical instruments and appliances, handicrafts, chemical fertilizers, plywood, rubber, processed food, jewelry, and tourism |
| External | |
| Exports | |
Export goods | Oil and gas, cement, food, electrical appliances, construction, plywood, textiles, rubber |
Main export partners |
|
| Imports | |
Import goods | machinery and equipment, chemicals, fuels, foodstuffs |
Main import partners | |
FDI stock | |
Gross external debt | $344.4 billion (31 December 2017 est.)[7] |
| Public finances | |
| −2.7% (of GDP) (2017 est.)[7] | |
| Revenues | 131.7 billion (2017 est.)[7] |
| Expenses | 159.6 billion (2017 est.)[7] |
Foreign reserves | $129.18 billion (December 2019)[21] |
In the aftermath of the 1997 Asian financial crisis, the government took custody of a significant portion of private sector assets through the acquisition of nonperforming bank loans and corporate assets through the debt restructuring process and the companies in custody were sold for privatisation several years later. Since 1999 the economy has recovered, and growth has accelerated to over 4–6% in recent years.[27]
In 2012, Indonesia replaced India as the second-fastest-growing G-20 economy, behind China. Since then, the annual growth rate has slowed and has fluctuated around 5%.[28][29]
History
Sukarno era
In the years immediately following the proclamation of Indonesian independence, both the Japanese occupation and conflict between Dutch and Republican forces had crippled the country's production, with exports of commodities such as rubber and oil being reduced to 12 and 5% of their pre-WW2 levels, respectively.[30] The first Republican government-controlled bank, the Indonesian State Bank (Bank Negara Indonesia, BNI) was founded on 5 July 1946. It initially acted as the manufacturer and distributor of ORI (Oeang Republik Indonesia/Money of the Republic of Indonesia), a currency issued by the Republican Government which was the predecessor of Rupiah.[31] Despite this, currency issued during the Japanese occupation and by Dutch authorities was still in circulation, and the simplicity of the ORI made its counterfeiting relatively easy, worsening matters.[32] Between 1949 and 1960, Indonesia experienced several economic disruptions. The country's independence recognised by the Netherlands, the dissolution of the United States of Indonesia in 1950, the subsequent liberal democracy period, the nationalisation of De Javasche Bank into the modern Bank Indonesia,[33] and the takeover of Dutch corporate assets following the West New Guinea dispute,[34] which all resulted in the devaluation of Dutch banknotes into half their value.[35]
During the guided democracy era in the 1960s, the economy deteriorated drastically as a result of political instability. The government was inexperienced in implementing macro-economic policies, which resulted in severe poverty and hunger. By the time of Sukarno's downfall in the mid-1960s, the economy was in chaos with 1,000% annual inflation, shrinking export revenues, crumbling infrastructure, factories operating at minimal capacity, and negligible investment. Nevertheless, Indonesia's post-1960 economic improvement was considered remarkable when taking consideration of how few indigenous Indonesians in the 1950s had received a formal education under Dutch colonial policies.[36]
New Order
Following President Sukarno's downfall, the New Order administration brought a degree of discipline to economic policy that quickly brought inflation down, stabilised the currency, rescheduled foreign debt, and attracted foreign aid and investment. (See Inter-Governmental Group on Indonesia and Berkeley Mafia). Indonesia was until recently Southeast Asia's only member of OPEC, and the 1970s oil price rise provided an export revenue windfall that contributed to sustained high economic growth rates, averaging over 7% from 1968 to 1981.[37]
With high levels of regulation and dependence on declining oil prices, growth slowed to an average of 4.5% per annum between 1981 and 1988. A range of economic reforms was introduced in the late 1980s, including a managed devaluation of the rupiah to improve export competitiveness, and de-regulation of the financial sector.[38] Foreign investment flowed into Indonesia, particularly into the rapidly developing export-oriented manufacturing sector, and from 1989 to 1997, the Indonesian economy grew by an average of over 7%.[39][40] GDP per capita grew 545% from 1970 to 1980 as a result of the sudden increase in oil export revenues from 1973 to 1979.[41] High levels of economic growth masked several structural weaknesses in the economy. It came at a high cost in terms of weak and corrupt governmental institutions, severe public indebtedness through mismanagement of the financial sector, the rapid depletion of natural resources, and culture of favours and corruption in the business elite.[42]
Corruption particularly gained momentum in the 1990s, reaching to the highest levels of the political hierarchy as Suharto became the most corrupt leader according to Transparency International.[43][44] As a result, the legal system was weak, and there was no effective way to enforce contracts, collect debts, or sue for bankruptcy. Banking practices were very unsophisticated, with collateral-based lending the norm and widespread violation of prudential regulations, including limits on connected lending. Non-tariff barriers, rent-seeking by state-owned enterprises, domestic subsidies, barriers to domestic trade and export restrictions all created economic distortions.
The 1997 Asian financial crisis that began to affect Indonesia became an economic and political crisis. The initial response was to float the rupiah, raise key domestic interest rates, and tighten fiscal policy. In October 1997, Indonesia and the International Monetary Fund (IMF) reached agreement on an economic reform program aimed at macroeconomic stabilisation and elimination of some of the country's most damaging economic policies, such as the National Car Program and the clove monopoly, both involving family members of Suharto. The rupiah remained weak, however, and Suharto was forced to resign in May 1998 after massive riots erupted. In August 1998, Indonesia and the IMF agreed on an Extended Fund Facility (EFF) under President B. J. Habibie that included significant structural reform targets. President Abdurrahman Wahid took office in October 1999, and Indonesia and the IMF signed another EFF in January 2000. The new program also has a range of economic, structural reform, and governance targets.
The effects of the crisis were severe. By November 1997, rapid currency depreciation had seen public debt reach US$60 billion, imposing severe strains on the government's budget.[45] In 1998, real GDP contracted by 13.1%, and the economy reached its low point in mid-1999 with 0.8% real GDP growth. Inflation reached 72% in 1998 but slowed to 2% in 1999. The rupiah, which had been in the Rp 2,600/USD1 range at the start of August 1997 fell to 11,000/USD1 by January 1998, with spot rates around 15,000 for brief periods during the first half of 1998.[46] It returned to the 8,000/USD1 range at the end of 1998 and has generally traded in the Rp 8,000–10,000/USD1 range ever since, with fluctuations that are relatively predictable and gradual. However, the rupiah began devaluing past 11,000 in 2013, and as of November 2016 is around 13,000 USD.[47]
Reform era
| Share of world GDP (PPP)[48] | |
|---|---|
| Year | Share |
| 1980 | 1.40% |
| 1990 | 1.89% |
| 2000 | 1.92% |
| 2010 | 2.24% |
| 2018 | 2.59% |
_banknotes.png)
Since an inflation target was introduced in 2000, the GDP deflator and the CPI have grown at an average annual pace of 10¾% and 9%, respectively, similar to the pace recorded in the two decades prior to the 1997 crisis, but well below the pace in the 1960s and 1970s.[49] Inflation has also generally trended lower through the 2000s, with some of the fluctuations in inflation reflecting government policy initiatives such as the changes in fiscal subsidies in 2005 and 2008, which caused large temporary spikes in CPI growth.[50]
In late 2004, Indonesia faced a 'mini-crisis' due to international oil prices rises and imports. The currency exchange rate reached Rp 12,000/USD1 before stabilising. Under President Susilo Bambang Yudhoyono (SBY), the government was forced to cut its massive fuel subsidies, which were planned to cost $14 billion in October 2005.[51] This led to a more than doubling in the price of consumer fuels, resulting in double-digit inflation. The situation had stabilised but the economy continued to struggle with inflation at 17% in late 2005. Economic outlook became more positive as the 2000s progressed. Growth accelerated to 5.1% in 2004 and reached 5.6% in 2005. Real per capita income has reached fiscal levels in 1996-1997. Growth was driven primarily by domestic consumption, which accounts for roughly three-fourths of Indonesia's gross domestic product (GDP). The Jakarta Stock Exchange was the best performing market in Asia in 2004, up by 42%. Problems that continue to put a drag on growth include low foreign investment levels, bureaucratic red tape, and widespread corruption which costs Rp. 51.4 trillion (US$5.6 billion) or approximately 1.4% of GDP annually. However, there is a robust economic optimism due to the conclusion of the peaceful 2004 elections.
As of February 2007, the unemployment rate was 9.75%.[52] Despite a slowing global economy, Indonesia's economic growth accelerated to a ten-year high of 6.3% in 2007. This growth rate was sufficient to reduce poverty from 17.8% to 16.6% based on the government's poverty line and reversed the recent trend towards jobless growth, with unemployment falling to 8.46% in February 2008.[53][54] Unlike many of its more export-dependent neighbours, Indonesia has managed to skirt the recession helped by strong domestic demand (which makes up about two-thirds of the economy) and a government fiscal stimulus package of about 1.4% of GDP. After India and China, Indonesia was the third-fastest growing economy in the G20. With the $512 billion economy expanded 4.4% in the first quarter from a year earlier and last month, the IMF revised its 2009 Indonesia forecast to 3–4% from 2.5%. Indonesia enjoyed stronger fundamentals with the authorities implemented wide-ranging economic and financial reforms, including a rapid reduction in public and external debt, strengthening of corporate and banking sector balance sheets and reducing bank vulnerabilities through higher capitalisation and better supervision.[55]
In 2012, Indonesia's real GDP growth reached 6%, then it steadily decreased below 5% until 2015. After Joko Widodo succeeded SBY, the government took measures to ease regulations for foreign direct investments to stimulate the economy.[56] Indonesia managed to increased its GDP growth slightly above 5% in 2016–2017.[57] However, the government is currently still facing problems such as currency weakening, decreasing exports and stagnating consumer spending.[58][59] The current unemployment rate for 2017 is at 5.5%.[60]
Structure
| Sector | Subsector | 2006 output (in trillion rupiahs) | Growth since 2003 (%) |
|---|---|---|---|
| Agriculture, etc. | Food crops | 223 | 35 |
| Estate crops | 63 | 34 | |
| Livestock, etc. | 51 | 27 | |
| Forestry | 30 | 63 | |
| Fisheries | 73 | 60 | |
| Mining | Oil and gas | 188 | 97 |
| Non oil and gas | 131 | 145 | |
| Quarrying | 36 | 87 | |
| Oil and gas manufacturing | Petroleum refining | 120 | 139 |
| Natural gas | 54 | 94 | |
| Quarrying | 213 | 35 | |
| Non oil and gas manufacturing | Food, tobacco, beverages | 213 | 38 |
| Textiles, footwear, etc. | 91 | 34 | |
| Wood, wood products | 44 | 48 | |
| Paper, printing | 40 | 43 | |
| Fertilisers, chemicals, rubber | 96 | 68 | |
| Cement, non-metallic quarry | 29 | 50 | |
| Iron, steel, basic metals | 20 | 52 | |
| Transport equipment, machinery | 222 | 87 | |
| Other manufacturing | 7 | 67 | |
| Electricity, gas, water | Electricity | 21 | 51 |
| Gas | 5 | 119 | |
| Water supply | 4 | 43 | |
| Construction & building | Construction, building | 249 | 98 |
| Trade, hotels, restaurants | Trade, wholesale and retail | 387 | 48 |
| Hotels | 17 | 52 | |
| Restaurants | 92 | 45 | |
| Transport | Road | 81 | 106 |
| Sea | 16 | 43 | |
| Rivers, ferries | 5 | 54 | |
| Air transport | 15 | 96 | |
| Other | 2 | 49 | |
| Communication | Communications | 88 | 123 |
| Finance, real estate, business | Banking | 98 | 31 |
| Non-bank finance | 27 | 87 | |
| Associated services | 2 | 82 | |
| Real estate | 98 | 72 | |
| Business services | 47 | 71 | |
| Public sector services | Government, defense | 104 | 63 |
| Private sector services | Social services, community services | 60 | 92 |
| Amusement, recreation | 10 | 46 | |
| Personal, household services | 100 | 69 |
Source: Indonesian Statistics Bureau (Biro Pusat Statistik), annual production data.
Sectors
Agriculture
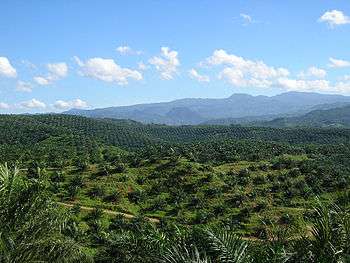
Agriculture is a key sector which contributed to 14.43% of GDP.[61] Currently, there are around 30% of the land area used for agriculture and employed about 49 million people (41% of the total workforce).[62] Primary agriculture commodities include rice, cassava (tapioca), peanuts, natural rubber, cocoa, coffee, palm oil, copra; poultry, beef, pork, and eggs. Palm oil production is vital to the economy as Indonesia is the world's biggest producer and consumer of the commodity, providing about half of the world's supply.[63] Plantations in the country stretch across 6 million hectares as of 2007,[64] with a replanting plan set for an additional 4.7 million to boost productivity in 2017.[65] There are a number of negative social and environmental impacts of palm oil production in southeast Asia.
Oil and mining
Indonesia was the only Asian member of the Organization of Petroleum Exporting Countries (OPEC) until 2008 and is currently a net oil importer. In 1999, crude and condensate output averaged 1.5 million barrels (240,000 m3) per day, and in 1998, the oil and gas sector including refining, contributed approximately 9% to GDP. As of 2005, crude oil and condensate output were 1.07 million barrels (170,000 m3) per day. It indicates a substantial decline from the 1990s, due primarily to ageing oil fields and a lack of investment in oil production equipment. This decline in production has been accompanied by a substantial increase in domestic consumption, about 5.4% per year, leading to an estimated US$1.2 billion cost for importing oil in 2005. The state owns all petroleum and mineral rights. Foreign firms participate through production-sharing and work contracts. Oil and gas contractors are required to finance all exploration, production, and development costs in their contract areas and are entitled to recover operating, exploration, and development costs out of the oil and gas produced. Indonesia had previously subsidised fuel prices to keep prices low, costing US$7 billion in 2004.[66] SBY has mandated a significant reduction of government subsidy of fuel prices in several stages.[67] The government has stated that cuts in subsidies are aimed at reducing the budget deficit to 1% of GDP in 2005, down from around 1.6% last year. At the same time, the government has offered one-time subsidies for qualified citizens, to alleviate hardships.
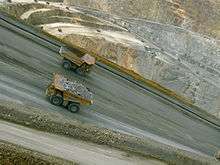
Indonesia is the world's largest tin market. Although mineral production traditionally centred on bauxite, silver, and tin, it is expanding its copper, nickel, gold, and coal output for export markets. In mid-1993, the Department of Mines and Energy reopened the coal sector to foreign investment, resulting in a joint venture between Indonesian coal producer and BP and Rio Tinto Group. Total coal production reached 74 million metric tons in 1999, including exports of 55 million tons, and in 2011, production was 353 million. As of 2014, Indonesia is the third-largest producer with a total output of 458 Mt and export of 382 Mt.[68] At this rate, the reserves will be used up in 61 years until 2075.[69] Not all of the productions can be exported due to Domestic Market Obligation (DMO) regulation, which should fulfil the domestic market. In 2012, the DMO was 24.72%. Starting from 2014, no low-grade coal exports are allowed, so the upgraded brown coal process that cranks up the calorie value of coal from 4,500 to 6,100 kcal/kg will be built in South Kalimantan and South Sumatra.[70] Indonesia is also the world's largest producer of nickel.[71]
Two US firms operate three copper/gold mines in Indonesia, with a Canadian and British firm holding significant other investments in nickel and gold, respectively. India's fortune groups like Vedanta Resources and Tata Group also have substantial mining operations in Indonesia. In 1998, the value of Indonesian gold and copper production was $1 billion and $843 million respectively. Receipts from gold, copper, and coal comprised 84% of the $3 billion earned in 1998 by the mineral mining sector. With the addition of Alumina project that produces 5% of the world's alumina production, Indonesia would be the world's second-largest Alumina producer. The project will not make the ores to become Aluminium, as there are 100 types of Alumina derivatives that can be developed further by other companies in Indonesia.[72]
Joko Widodo's administration continued the resource nationalism policy of SBY, nationalising some assets controlled by multinational companies such as Freeport McMoRan, Total SA and Chevron. In 2018, in a move aimed to cut imports, oil companies operating in Indonesia were ordered to sell their crude oil to state-owned Pertamina.[73]
Automotive industry
In 2010, Indonesia sold 7.6 million motorcycles, which was mainly produced in the country with almost 100% local components. Honda led the market with a 50.95% market share, followed by Yamaha with 41.37%.[74] In 2011, the retail car sales total was 888,335 units, a 19.26% increase from last year. Toyota dominated the domestic car market (35.34%), followed by Daihatsu and Mitsubishi with 15.44% and 14.56%, respectively.[75] Since 2011, some local carmakers have introduced some Indonesian national cars which can be categorised as Low-Cost Green Car (LCGC). In 2012, sales increased significantly by 24%, making it the first time that there were more than one million units in automobile sales.[76]
In August 2014, Indonesia exported 126,935 Completely Build Up (CBU) vehicle units and 71,000 Completely Knock Down (CKD) vehicle units, while total production reached 878,000 vehicle units, comprising 22.5% of total output. Automotive export is more than double of its import. By 2020, it is predicted that the automotive exports will be the third after CPO and shoe export.[77] In August 2015, Indonesia exported 123,790 motorcycles. The dominant manufactures which exported 83,641, announced to make Indonesia as a base of exporting country of its products.[78]

In 2017, the country produced almost 1.2 million motor vehicles, ranking it as the 18th largest producer in the world.[79] Nowadays, Indonesian automotive companies can produce cars with a high ratio of local content (80%–90%).[80]
In 2018, the country produced 1.34 million units car with include export 346,000 units car mainly to the Philippines and Vietnam. [81]
Finance, real estate and business
There are 50 million small businesses in Indonesia, with online usage growth of 48% in 2010. Google announced that it would open a local office in Indonesia before 2012.[82] According to Deloitte in 2011, Internet-related activities have generated 1.6% of the GDP. It is bigger than electronic and electrical equipment exports and liquified natural gas at 1.51% and 1.45% respectively.[83]
Up to the end of June 2011, the fixed state assets were Rp 1,265 trillion ($128 billion). The value of state stocks was Rp 50 trillion ($5 billion) while other state assets were Rp 24 trillion ($2.4 billion).[84]
In 2015, financial services covered Rp 7,2 trillion. Fifty domestic and foreign conglomerations held around 70.5%. Fourteen of it were vertical conglomerations, 28 were horizontal, and eight are mixed. Thirty-five entities are mainly in the bank industries, 13 were in non-bank industries and one each in special financial industries and capital market industries.[85]
Others
The Indonesian Textile Association has reported that in 2013, the textile sector is likely to attract investment of around $175 million. In 2012, the investment in this sector was $247 million, of which only $51 million was for new textile machinery.[86] Exports from the textile sector in 2012 were $13.7 billion.
In 2011, Indonesia released 55,010 working visas for foreigners, an increase of 10% compared to 2010, while the number of foreign residents in Indonesia, excluding tourists and foreign emissaries was 111,752, rose by 6% compared to last year. Those who received visas for six months to one year were mostly Chinese, Japanese, South Koreans, Indians, Americans and Australians. A few of them were entrepreneurs who made new businesses. Malaysia is the most common destination of Indonesian migrant workers (including illegal workers). In 2010, according to a World Bank report, Indonesia was among the world's top ten remittance-receiving countries with a value totalling $7 billion.[87] In May 2011, six million Indonesian citizens were working overseas, 2.2 million of whom reside in Malaysia and another 1.5 million in Saudi Arabia.[88]
Foreign economic relations
Indonesia and Japan signed the Indonesia–Japan Economic Partnership Agreement (IJEPA), which had come into effect on 1 July 2008. The agreement was Indonesia's first bilateral free-trade agreement to ease the cross-border flow of goods and people as well as investment between both countries.[89] Trade with China has increased since the 1990s, and in 2014, China became Indonesia's second-largest export destination after Japan.[90] With China's economic rise, Indonesia has been intensifying its trade relationship with China to counterbalance its ties with the West.[91] By 2020, China had become Indonesia's largest export destination.[92]
United States
At the beginning of the post-Suharto era, US exports to Indonesia in 1999 totalled $2 billion, down significantly from $4.5 billion in 1997. The main exports were construction equipment, machinery, aviation parts, chemicals, and agricultural products. US imports from Indonesia in 1999 totalled $9.5 billion and consisted primarily of clothing, machinery and transportation equipment, petroleum, natural rubber, and footwear. Financial assistance to Indonesia is coordinated through the Consultative Group on Indonesia (CGI) formed in 1989. It includes 19 donor countries and 13 international organisations that meet annually to coordinate donor assistance. In 2019, as Indonesia's share of global trade exceeded 0.5 percent, the United States Trade Representatives decided not to classify Indonesia as a "developing country."[93] Despite a revocation of this status, the Indonesian government has assured that this would not change the current Generalized System of Preferences facilities that Indonesia had enjoyed from the United States.[94]
Macro-economic trend
This is a chart of trend of Indonesia's GDP at market prices[95] by the IMF with figures in millions of rupiah.
| Year | GDP | USD exchange (rupiah) | Inflation rate (%) | Nominal GDP per capita (as % of US) | GDP PPP per capita (as % of US) |
|---|---|---|---|---|---|
| 1980 | 60,143.191 | 627 | 18.0 | 5.25 | 5.93 |
| 1985 | 112,969.792 | 1,111 | 4.7 | 3.47 | 5.98 |
| 1990 | 233,013.290 | 1,843 | 7.8 | 3.01 | 6.63 |
| 1995 | 502,249.558 | 2,249 | 9.4 | 4.11 | 8.14 |
| 2000 | 1,389,769.700 | 8,396 | 3.8 | 2.32 | 6.92 |
| 2005 | 2,678,664.096 | 9,705 | 10.5 | 3.10 | 7.51 |
| 2010 | 6,422,918.230 | 8,555 | 5.1 | 6.38 | 9.05 |
| 2015 | 11,531,700,000 | 13,824 | 6.4 | 4.75 | 19.63 |
For purchasing power parity comparisons, the exchange rate for 1 US dollar is set at 3,094.57 rupiah.
Average net wage in Indonesia is varied by sector. In February 2017 the electricity, gas, and water sector is the sector with the highest average net wage, while the agriculture sector is the lowest.[96]
Investment
Since the late 1980s, Indonesia has made significant changes to its regulatory framework to encourage economic growth. This growth was financed mostly from private investment, both foreign and domestic. US investors dominated the oil and gas sector and undertook some of Indonesia's largest mining projects. In addition, the presence of US banks, manufacturers, and service providers expanded, especially after the industrial and financial sector reforms of the 1980s. Other major foreign investors included India, Japan, the UK, Singapore, the Netherlands, Qatar, Hong Kong, Taiwan and South Korea.
The 1997 crisis made continued private financing imperative but problematic. New foreign investment approvals fell by almost two-thirds between 1997 and 1999. The crisis further highlighted areas where additional reform was needed. Frequently cited areas for improving the investment climate were the establishment of a functioning legal and judicial system, adherence to competitive processes, and adoption of internationally acceptable accounting and disclosure standards. Despite improvements of laws in recent years, Indonesia's intellectual property rights regime remains weak, and lack of effective enforcement is a significant concern. Under Suharto, Indonesia had moved towards the private provision of public infrastructure, including electric power, toll roads, and telecommunications. The 1997 crisis brought to light a severe weakness in the process of dispute resolution, however, particularly in the area of private infrastructure projects. Although Indonesia continued to have the advantages of a large labour force, abundant natural resources and modern infrastructure, private investment in new projects largely ceased during the crisis.
As of 28 June 2010, the Indonesia Stock Exchange had 341 listed companies with a combined market capitalisation of $269.9 billion.[97] As of November 2010, two-thirds of the market capitalisation was in the form of foreign funds, and only around 1% of the population have stock investments.[98] Efforts are further being made to improve the business and investment environment. Within the World Bank's Doing Business Survey,[99] Indonesia rose to 122 out of 178 countries in 2010, from 129 in the previous year. Despite these efforts, the rank is still below regional peers, and an unfavourable investment climate persists. For example, potential foreign investors and their executive staff cannot maintain their own bank accounts in Indonesia, unless they are tax-paying local residents (paying tax in Indonesia for their worldwide income).
From 1990 to 2010, Indonesian companies have been involved in 3,757 mergers and acquisitions as either acquirer or target with a total known value of $137 billion.[100] In 2010, 609 transactions were announced, which is a new record. Numbers had increased by 19% compared to 2009. The value of deals in 2010 was US$17 billion, which is the second-highest number ever. In 2012, Indonesia realised total investments of $32.5 billion, surpassing its annual target $25 billion, as reported by Investment Coordinating Board (BKPM) on 22 January. The primary investments were in the mining, transport and chemicals sectors.[101] In 2011, the Indonesian government announced a new Masterplan (known as the MP3EI, or Masterplan Percepatan dan Perluasan Pembangunan Ekonomi Indonesia, the Masterplan to Accelerate and Expand Economic Development in Indonesia). The aim was to encourage increased investment, particularly in infrastructure projects across Indonesia.[102]
Indonesia regained its investment grade rating from Fitch Rating in late 2011, and from Moody's Rating in early 2012, after losing it in the 1997 crisis, during which Indonesia spent more than Rp. 450 trillion ($50 billion) to bail out lenders from banks. Fitch raised Indonesia's long-term and local currency debt rating to BBB- from BB+ with both ratings is stable. Fitch also predicted that the economy would grow at least 6% on average per year through 2013, despite a less conducive global economic climate. Moody's raised Indonesia's foreign and local currency bond ratings to Baa3 from Ba1 with a stable outlook.[103] On May 2017, S&P Global raised Indonesia's investment grade from BB+ to BBB- with a stable outlook, due to the economy experiencing a rebound in exports and strong consumer spending during early 2017.[104]
Public expenditure
In 2015, total public spending was Rp 1,806 trillion (US$130.88 billion, 15.7% of GDP). Government revenues, including those from state-owned enterprises (BUMN), totalled Rp 1,508 trillion (US$109.28 billion, 13.1% of GDP) resulting in a deficit of 2.6%.[105] Since the 1997 crisis that caused an increase in debt and public subsidies and a decrease in development spending, Indonesia's public finances have undergone a major transformation. As a result of a series macroeconomic policies, including a low budget deficit, Indonesia is considered to have moved into a situation of financial resources sufficiency to address development needs. Decentralisation, enacted during the Habibie administration, has changed the manner of government spending, which has resulted in around 40% of public funds being transferred to regional governments by 2006.
In 2005, rising international oil prices led to the government's decision of slashing fuel subsidies. It led to an extra US$10 billion for government spending on development,[106] and by 2006, there were an additional 5 billion due to steady growth, and declining debt service payments.[106] It was the country's first "fiscal space" since the revenue windfall during the 1970s oil boom. Due to decentralisation and fiscal space, Indonesia has the potential to improve the quality of its public services. Such potential also enables the country to focus on further reforms, such as the provision of targeted infrastructure. Careful management of allocated funds has been described as Indonesia's main issue in public expenditure.[106][107]
In 2018, President Joko Widodo substantially increased the amount of debt by taking foreign loans. Indonesia has increased the debt by Rp 1,815 trillion compared to his predecessor, SBY. He has insisted that the loan is used for productive long-term projects such as building roads, bridges, and airports.[108] Finance Minister Sri Mulyani also stated that despite an increase of foreign loans and debt, the government has also increased the budget for infrastructure development, healthcare, education, and budget given to regencies and villages.[109] The government is insisting that foreign debt is still under control, and complying with relevant laws that limit debt to be under 60% of GDP.[110]
Regional performance
Based on the regional administration implementation performance evaluation of 2009, by an order the best performance were:
- 3 Provinces: North Sulawesi, South Sulawesi and Central Java;
- 10 Regencies: Jombang, Bojonegoro and Pacitan in East Java Province, Sragen in Central Java, Boalemo in Gorontalo, Enrekang in South Sulawesi, Buleleng in Bali, Luwu Utara in South Sulawesi, Karanganyar in Central Java and Kulon Progo in Yogyakarta;
- 10 Cities: Surakarta and Semarang in Central Java, Banjar in West Java, Yogyakarta city in Yogyakarta, Cimahi in West Java, Sawahlunto in West Sumatra, Probolinggo and Mojokerto in East Java, Sukabumi and Bogor in West Java.[111]
Based on JBIC Fiscal Year 2010 survey (22nd Annual Survey Report) found that in 2009, Indonesia has the highest satisfaction level in net sales and profits for Japanese companies.[112]
High-net-worth individuals
According to Asia Wealth Report, Indonesia has the highest growth rate of high-net-worth individuals (HNWI) predicted among the 10 most Asian economies.[113] The Wealth Report 2015 by Knight Frank reported that in 2014 there were 24 individuals with a net worth above US$1 billion. 18 of them lived in Jakarta and the others spread among other large cities in Indonesia. 192 persons can be categorised as centamillionaires with over US$100 million of wealth and 650 persons as high-net-worth individuals with wealth exceeding US$30 million.[114]
Challenges
Labour unrest
As of 2011, labour militancy was increasing with a major strike at the Grasberg mine and numerous strikes elsewhere. A common issue was the attempts by foreign-owned enterprises to evade Indonesia's strict labour laws by calling their employees' contract workers. The New York Times expressed concern that Indonesia's cheap labour advantage might be lost. However, a large pool of the unemployed who will accept substandard wages and conditions remains available. One factor in the increase of militancy is increased awareness via the internet of prevailing wages in other countries, and the generous profits foreign companies are making in Indonesia.[115]
On 1 September 2015, thousands of workers in Indonesia staged demonstrations across the country in pursuit of higher wages and improved labour laws. Approximately 35,000 people rallied in several parts of the country. They demanded a 22% to 25% increase in the minimum wage by 2016 and lower prices on essential goods, including fuel. The unions also want the government to ensure job security and provide the fundamental rights of the workers.[116]
Inequality
Economic disparity and the flow of natural resource profits to Jakarta has led to discontent and even contributed to separatist movements in areas such as Aceh and Papua. Geographically, the poorest fifth regions account for just 8% of consumption, while the wealthiest fifth account for 45%. While there are new laws on decentralisation that may address the problem of uneven growth and satisfaction partially, there are many hindrances in putting this new policy into practice.[117] At a 2011 Makassar Indonesian Chamber of Commerce and Industry (Kadin) meeting, Disadvantaged Regions Minister said there are 184 regencies classified as disadvantaged areas with around 120 in eastern Indonesia.[118] 1% of Indonesia's population has 49.3% of the country's $1.8 trillion wealth, down from 53.5%. However, it is in the fourth rank after Russia (74.5%), India (58.4%) and Thailand (58%).[119]
Inflation
Inflation has long been a problem in Indonesia. Because of political turmoil, the country had once suffered hyperinflation, with 1,000% annual inflation between 1964 and 1967,[120] and this had been enough to create severe poverty and hunger.[121] Even though the economy recovered very quickly during the first decade of the New Order administration (1970–1981), never once was the inflation less than 10% annually. The inflation slowed during the mid-1980s; however, the economy was also languid due to the decrease in oil price that reduced its export revenue dramatically. The economy was again experiencing rapid growth between 1989–1997 due to the improving export-oriented manufacturing sector. Still, the inflation rate was higher than economic growth, and this caused a widening gap among several Indonesians. The inflation peaked in 1998 during the 1997 crisis, with over 58%, causing the raise poverty to the levels in the 1960s.[122] During the economic recovery and growth in recent years, the government has been trying to lower the inflation rate. However, it seems that inflation has been affected by global fluctuation and domestic market competition.[123] As of 2010, the inflation rate was approximately 7%, when its economic growth was 6%. To date, inflation is affecting Indonesian lower middle class, especially those who are not able to afford food after price hikes.[124][125] At the end of 2017, Indonesia's inflation rate was 3.61%, above the government-set forecast of 3.0–3.5%.[126]
See also
- Alcohol in Indonesia
- Bamboo network
- CIVETS countries
- Developing 8 Countries
- European Union-Indonesia trade relations
- G-20 major economies
- G20 developing nations
- Gas subsidies
- List of main infrastructure projects in Indonesia
- List of largest companies in Indonesia
- Next Eleven
- Taxation in Indonesia
- Tourism in Indonesia
References
- "World Economic Outlook Database, April 2019". IMF.org. International Monetary Fund. Retrieved 29 September 2019.
- "World Bank Country and Lending Groups – World Bank Data Help Desk". datahelpdesk.worldbank.org. Retrieved 17 June 2020.
- "Economic Minister of Indonesia". Archived from the original on 21 March 2020. Retrieved 19 May 2020.
- "Population, total - Indonesia". data.worldbank.org. World Bank. Retrieved 1 November 2019.
- "World Economic Outlook Database, October 2019". IMF.org. International Monetary Fund. Retrieved 20 October 2019.
- "Global Economic Prospects, June 2020". openknowledge.worldbank.org. World Bank. Retrieved 10 June 2020.
- "CIA World Factbook". CIA.gov. Central Intelligence Agency. Retrieved 13 January 2019.
- "Badan Pusat Statistik". bps.go.id.
- "Poverty headcount ratio at $3.20 a day (2011 PPP) (% of population) - Indonesia". data.worldbank.org. World Bank. Retrieved 21 March 2020.
- "Poverty in Indonesia Fell to the Lowest Level Ever in March 2018". Indonesia Investment. Retrieved 17 July 2018.
- "Human Development Index (HDI)". hdr.undp.org. HDRO (Human Development Report Office) United Nations Development Programme. Retrieved 11 December 2019.
- "Inequality-adjusted HDI (IHDI)". hdr.undp.org. UNDP. Retrieved 22 May 2020.
- "Labor force, total - Indonesia". data.worldbank.org. World Bank. Retrieved 1 November 2019.
- "https://data.worldbank.org/indicator/SL.EMP.TOTL.SP.NE.ZS?locations=ID&most_recent_value_desc=true". data.worldbank.org. World Bank. Retrieved 1 November 2019. External link in
|title=(help) - "Ease of Doing Business in Indonesia". World Bank. Retrieved 1 November 2017.
- "World Trade Organization : Indonesia profile" (PDF). wto.org. Retrieved 22 March 2020.
- "World Trade Organization : Indonesia profile" (PDF). wto.org. Retrieved 22 March 2020.
- "Report for Selected Countries and Subjects". Retrieved 3 March 2015.
- "Indonesia Credit Rating". World Government Bonds. Retrieved 19 May 2020.
- "Fitch Affirms Indonesia at 'BBB'; Outlook Stable". Archived from the original on 5 August 2017. Retrieved 5 August 2017.
- "Cadangan Devisa RI Melambung US$ 2,5 M di December 2019". Retrieved 15 December 2019.
- , g20.org. Retrieved 6 October 2009.
- "Indonesia poised to become Southeast Asian giant in digital economy". Antara News. Retrieved 3 November 2019.
- "Kemenperin – Ketika Swasta Mendominasi". Archived from the original on 5 August 2017.
- "80 Persen Industri Indonesia Disebut Dikuasai Swasta". 3 March 2015.
- "Kemenperin – Pengelola Kawasan Industri Didominasi Swasta". Archived from the original on 5 August 2017. Retrieved 5 August 2017.
- "Acicis – Dspp". Acicis.murdoch.edu.au. Retrieved 29 August 2011.
- "GDP growth (annual %)". data.worldbank.org. Retrieved 5 August 2017.
- "Why Indonesia's Apparent Stability Under Jokowi Is a Sign of Its Stagnation". worldpoliticsreview.com. Retrieved 6 May 2020.
- Lindblad, J. Thomas (2006). "Macroeconomic consequences of decolonization in Indonesia" (PDF). XIVth Conference of the International Economic History Association. Helsinki. Retrieved 18 August 2017.
- "History – BNI". BNI. Retrieved 18 August 2017.
- Hakiem, Lukman (9 August 2017). "Hatta-Sjafruddin: Kisah Perang Uang di Awal Kemerdekaan" (in Indonesian). Republika. Retrieved 18 August 2017.
- Lindblad, J. Thomas (2004). "From Java Bank to Bank Indonesia: A Case Study of Indonesianisasi in Practice" (PDF). Archived from the original on 27 March 2009. Cite journal requires
|journal=(help)CS1 maint: BOT: original-url status unknown (link) - van de Kerkhog\f, Jasper (March 2005). "Dutch enterprise in independent Indonesia: cooperation and confrontation, 1949–1958" (PDF). IIAS Newsletter. 36. Retrieved 18 August 2017.
- "Period of Recognition of the Republic of Indonesia's Sovereignty up the Nationalization of DJB" (PDF). Bank Indonesia. Special Unit for Bank Indonesia Museum: History Before Bank Indonesia. Retrieved 18 August 2017.
- Baten, Jörg (2016). A History of the Global Economy. From 1500 to the Present. Cambridge University Press. p. 292. ISBN 9781107507180.
- Schwarz (1994), pp. 52–7.
- (Schwarz (1994), pages 52–57)
- Schwarz (1994), pages 52–57.
- "Indonesia: Country Brief". Indonesia: Key Development Data & Statistics. The World Bank. September 2006.
- "GDP info". Earthtrends.wri.org. Archived from the original on 20 February 2009. Retrieved 29 August 2011.
- "Combating Corruption in Indonesia, World Bank 2003" (PDF). Retrieved 29 August 2011.
- "Transparency International Global Corruption Report 2004". Transparency.org. Archived from the original on 2 September 2011. Retrieved 29 August 2011.
- "Suharto tops corruption rankings". BBC News. 25 March 2004. Retrieved 29 August 2011.
- Robison, Richard (17 November 2009). "A Slow Metamorphosis to Liberal Markets". Australian Financial Review.
- "Historical Exchange Rates". OANDA. 16 April 2011. Retrieved 29 August 2011.
- "XE: USD / IDR Currency Chart. US Dollar to Indonesian Rupiah Rates". xe.com. Retrieved 6 May 2020.
- "Report for Selected Countries and Subjects". imf.org. Retrieved 17 June 2020.
- van der Eng, Pierre (4 February 2002). "Indonesia's growth experience in the 20th century: Evidence, queries, guesses" (PDF). Australian National University. Archived (PDF) from the original on 10 October 2017. Retrieved 10 October 2017.
- Temple, Jonathan (15 August 2001). "Growing into trouble: Indonesia after 1966" (PDF). University of Bristol. Archived from the original (PDF) on 27 December 2016. Retrieved 27 December 2016.
- BBC News (31 August 2005). "Indonesia plans to slash fuel aid". BBC, London.
- "Beberapa Indikator Penting Mengenai Indonesia" (PDF) (Press release) (in Indonesian). Indonesian Central Statistics Bureau. 2 December 2008. Archived from the original (PDF) on 1 April 2008. Retrieved 18 March 2008.
- "Indonesia: Economic and Social update" (PDF) (Press release). World Bank. 2008. Archived from the original (PDF) on 7 June 2011. Retrieved 2 April 2008.
- "Indonesia: BPS-STATISTICS INDONESIA STRATEGIC DATA" (PDF) (Press release). BPS-Statistic Indonesia. 2009. Archived from the original (PDF) on 13 November 2010. Retrieved 5 November 2008.
- "IMF Survey: Indonesia's Choice of Policy Mix Critical to Ongoing Growth". Imf.org. 28 July 2009. Retrieved 29 August 2011.
- "Indonesian President Joko 'Jokowi' Widodo Two Years On". Time. Retrieved 7 May 2018.
- "Jokowi Heads to 2018 With Backing of Stronger Indonesian Economy". Bloomberg.com. Retrieved 7 May 2018.
- "Indonesian GDP Growth Disappoints, Adding to Currency Woes". Bloomberg.com. Retrieved 7 May 2018.
- "Indonesian GDP growth falls short in 1Q, pressuring President Widodo". Nikkei Asian Review-GB. Retrieved 7 May 2018.
- Post, The Jakarta. "Number of unemployed rises to 7.04 million". The Jakarta Post. Retrieved 28 January 2018.
- Estu Suryowati (12 August 2014). "Satu Dekade, Kontribusi Pertanian terhadap PDB Menurun". Kompas (in Indonesian).
- "Pertanian di Indonesia (Agriculture in Indonesia)". Indonesia Investments. Retrieved 5 December 2015.
- McClanahan, Paige (11 September 2013). "Can Indonesia increase palm oil output without destroying its forest?". The Guardian. Archived from the original on 17 September 2013. Retrieved 17 September 2013.
- "Palm Oil". Greenpeace. Archived from the original on 26 September 2013. Retrieved 26 September 2013.
- "Indonesia to replant 4.7m hectares of palm oil plantation". UkrAgroConsult. 30 August 2017. Archived from the original on 27 September 2017. Retrieved 27 September 2017.
- "Tigers count the cost of easing fuel subsidies". Asia Times. 10 March 2005. Retrieved 29 August 2011.
- "Indonesia plans to slash fuel aid". BBC News. 31 August 2005.
- "Coal Mining in Indonesia - Indonesian Coal Industry | Indonesia Investments". indonesia-investments.com. Retrieved 6 May 2020.
- "Archived copy" (PDF). Archived from the original (PDF) on 15 November 2017. Retrieved 5 January 2016.CS1 maint: archived copy as title (link)
- "Coal production may reach 370 million tons this year". 23 September 2011.
- Sanderson, Henry (30 August 2019). "Nickel prices hit four-year high on Indonesia export ban". Financial Times. Retrieved 9 September 2019.
- "RI aims to be second largest alumina producer". Antara News. 12 April 2011. Retrieved 29 August 2011.
- "Economic nationalism is back in Indonesia as election approaches". The Straits Times. 17 September 2018. Retrieved 18 September 2018.
- "Honda eyes larger share in premium bike market". The Jakarta Post. Retrieved 29 August 2011.
- "Local automobile sales hit all-time high". 5 January 2012.
- "Penjualan mobil capai 1,1 juta unit di 2012". 8 January 2013.
- "Optimisme Ekspor Mobil Terus Menanjak". Archived from the original on 23 September 2015. Retrieved 22 September 2014.
- "Roda dua makin ngacir ke luar negeri". 14 September 2015.
- "2017 Production Statistics". Organisation Internationale des Constructeurs d'Automobiles. Retrieved 8 May 2018.
- "Localization". PT. Toyota Motor Manufacturing Indonesia. Archived from the original on 29 June 2016. Retrieved 29 June 2016.
- Office of Assistant to Deputy Cabinet Secretary for State Documents & Translation (25 April 2019). "Car Exports Expected to Increase 15.6% This Year".
- "Google to Open Indonesia Office 'Before 2012'". Embassyofindonesia.org. 22 July 2011. Archived from the original on 27 September 2011. Retrieved 29 August 2011.
- "Internet penetration and the connected archipelago". 31 December 2011.
- "Indonesia's State Assets Worth IDR1,338.7 Trillion". 2 January 2011. Archived from the original on 22 January 2012. Retrieved 2 January 2012.
- "Siaran Pers: OJK Awasi 50 Konglomerasi Keuangan". 26 June 2015. Archived from the original on 1 July 2015. Retrieved 28 June 2015.
- "Indonesia textile sector faces challenge". Investvine.com. 2 February 2013. Retrieved 3 April 2013.
- "Indonesia Among the World's Top 10 Remittance Receivers". Embassyofindonesia.org. 4 May 2011. Archived from the original on 27 September 2011. Retrieved 29 August 2011.
- "After Malaysia, RI seeks similar pact with S. Arabia". The Jakarta Post. 19 August 2011. Retrieved 29 August 2011.
- Investments, Indonesia. "Indonesia-Japan Economic Partnership Agreement (IJEPA) Reviewed". indonesia-investments.com. Retrieved 28 January 2018.
- "Indonesia". Retrieved 20 November 2016.
- "Indonesia forges stronger ties with China to boost economy". 19 November 2014. Retrieved 20 November 2016.
- "Indonesia Posts Largest Trade Surplus Since 2011 as Coronavirus Disrupts Imports From China". Jakarta Globe. 16 March 2020. Retrieved 15 June 2020.
- "USTR Updates List of Developing and Least-Developed Countries Under U.S. CVD Law | United States Trade Representative". ustr.gov. Retrieved 27 February 2020.
- Post, The Jakarta. "Revocation of Indonesia's developing country status will not affect GSP: Government". The Jakarta Post. Retrieved 27 February 2020.
- "Edit/Review Countries". Imf.org. 14 September 2006. Retrieved 29 August 2011.
- "Indonesia: average net wage by sector 2017 | Statistic". Statista. Retrieved 28 January 2018.
- Bloomberg Terminal
- "Economy risks losing momentum: Experts". The Jakarta Post. 26 November 2010. Retrieved 29 August 2011.
- "Doing Business Survey, World Bank". Doingbusiness.org. Retrieved 29 August 2011.
- "Statistics on Mergers & Acquisitions (M&A)". Imaa-institute.org. Archived from the original on 6 January 2012. Retrieved 29 August 2011.
- "Indonesia aims to boost FDI by 23%". Investvine.com. 24 January 2013. Retrieved 26 January 2013.
- A copy of the Masterplan is available at the website of the Indonesian Coordinating Ministry for Economic Affairs.
- "Moody's Also Says Indonesia Economy Now Investment Grade". 18 January 2012. Archived from the original on 23 April 2012. Retrieved 20 May 2012.
- "Indonesia Raised to Investment Grade by S&P on Budget Curbs". Bloomberg.com. 19 May 2017. Retrieved 28 January 2018.
- "Indonesia Economic Quarterly – January 2017" (PDF). World Bank. Retrieved 18 August 2017.
- "Spending for Development: Making the Most of Indonesia's New Opportunities Indonesia Public Expenditure Review 2007" (PDF). Retrieved 29 August 2011.
- "The Politics of Free Public Services in Decentralised Indonesia" (PDF). Archived from the original (PDF) on 30 March 2012. Retrieved 3 March 2015.
- Media, Kompas Cyber (23 October 2018). "Jokowi: Utang Indonesia Kecil Dibanding Negara Lain". KOMPAS.com (in Indonesian). Retrieved 18 December 2018.
- "Sri Mulyani Jelaskan Manfaat Kenaikan Utang Rp 1.329 T di Era Jokowi - Katadata News". katadata.co.id. Retrieved 18 December 2018.
- Belinda. "Utang Luar Negeri Indonesia Tetap Terkendali | Vibiznews". Retrieved 18 December 2018.
- "Govt names 23 regions with best performance". Waspada.co.id. 25 April 2011. Retrieved 29 August 2011.
- "The power nature and Indonesia's economy". The Jakarta Post. 6 June 2011. Archived from the original on 27 August 2011. Retrieved 29 August 2011.
- "Close to 100,000 Super Rich Indonesians By 2015: Report". 2 September 2011. Archived from the original on 28 September 2012. Retrieved 2 September 2011.
- Hilda B Alexander (19 March 2015). "18 Konglomerat Indonesia Tinggal di Jakarta".
- Sara Schonhardt (26 December 2011). "As Indonesia Grows, Discontent Sets in Among Workers". The New York Times. Retrieved 27 December 2011.
- Kaniz Fatima (9 September 2015). "Textile workers protest for new minimum wage in Indonesia". BanglaApparel.com. Archived from the original on 23 September 2015. Retrieved 9 September 2015.
- "Indonesia Poverty and wealth, Information about Poverty and wealth in Indonesia". Nationsencyclopedia.com. Retrieved 29 August 2011.
- "120 poor regencies are in the east". The Jakarta Post. 18 July 2011. Retrieved 29 August 2011.
- "Indonesia's Richest One% Controls Nearly Half of Nation's Wealth: Report". Retrieved 2 December 2016.
- By the time of Sukarno's downfall in the mid-1960s, the economy was in chaos with 1,000% annual inflation, shrinking export revenues, crumbling infrastructure, factories operating at minimal capacity, and negligible investment. Schwarz (1994), pages 52–57
- "Ir Soekarno The First President of Indonesia". Welcome2indonesia.com. 18 May 2010. Archived from the original on 18 July 2011. Retrieved 29 August 2011.
- "Report for Selected Countries and Subjects". Imf.org. 14 September 2006. Retrieved 29 August 2011.
- "Indonesia – Financial & Private Sector Development in Indonesia". World Bank. 18 October 2007. Retrieved 29 August 2011.
- "Faced With Skyrocketing Food Prices, Indonesian Govt to Speed Up Work on Food Estate". Jakarta Globe. Archived from the original on 17 July 2011. Retrieved 29 August 2011.
- "Indonesia Inflation Accelerates, Adding Pressure to Raise Rate :: Forex Trading Lebanon". Forextradinglb.com. 1 February 2011. Archived from the original on 11 July 2011. Retrieved 29 August 2011.
- "Indonesia's Dec annual inflation rate at 3.61 pct, above forecast". NASDAQ.com. 1 January 2018. Retrieved 28 January 2018.
Further reading
- Eng, Pierre van der (2010). "The sources of long-term economic growth in Indonesia, 1880–2008" (PDF). Explorations in Economic History. 47 (3): 294–309. doi:10.1016/j.eeh.2009.08.004.
External links
- Indonesia Economic Aftershock from the Dean Peter Krogh Foreign Affairs Digital Archives
- BKPM – Indonesia Investment Coordinating Board And Indonesia Investment News
- Comprehensive current and historical economic data
- World Bank Summary Trade Statistics Indonesia
- Tariffs applied by Indonesia as provided by ITC's Market Access Map, an online database of customs tariffs and market requirements
| History |  | ||||||||
|---|---|---|---|---|---|---|---|---|---|
| Geography |
| ||||||||
| Politics | |||||||||
| Economy | |||||||||
| Society |
| ||||||||