Economy of Norway
The economy of Norway is a developed mixed economy with state-ownership in strategic areas. Although sensitive to global business cycles, the economy of Norway has shown robust growth since the start of the industrial era. The country has a very high standard of living compared with other European countries, and a strongly integrated welfare system. Norway's modern manufacturing and welfare system rely on a financial reserve produced by exploitation of natural resources, particularly North Sea oil.[18][19][20][21][22] According to United Nations data for 2016, Norway together with Luxembourg (a small state) and Switzerland are the only three countries in the world with a GDP per capita above US$70,000 that are neither island nations nor microstates.[23]
 | |
| Currency | Norwegian krone (NOK, kr) |
|---|---|
| Calendar year | |
Trade organisations | OECD, WTO, EEA and others |
Country group | |
| Statistics | |
| Population | |
| GDP | |
| GDP rank | |
GDP growth |
|
GDP per capita | |
GDP per capita rank | |
GDP by sector |
|
| 2.4% (2020 est.)[5] | |
Population below poverty line | |
Labour force | |
Labour force by occupation |
|
| Unemployment | |
Average gross salary | NOK 45,600 / €4,713 / $5,367 monthly (2018) |
Average net salary | NOK 33,400 / €3,452 / $3,931 monthly (2018) |
Main industries | |
| External | |
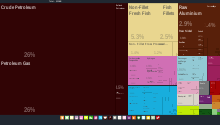
| Exports | |
Export goods | petroleum and petroleum products, machinery and equipment, metals, chemicals, ships, fish |
Main export partners |
|
| Imports | |
Import goods | machinery and equipment, chemicals, metals, foodstuffs |
Main import partners |
|
FDI stock | |
Gross external debt |
|
| Public finances | |
| +4.4% (of GDP) (2017 est.)[6] | |
| Revenues | 217.1 billion (2017 est.)[6] |
| Expenses | 199.5 billion (2017 est.)[6] |
| Economic aid | $4.0 billion (donor), 1.1% of GDP (2017) |
Foreign reserves | |

History
Pre-industrial revolution
Prior to the industrial revolution, Norway's economy was largely based on agriculture, timber, and fishing. Norwegians typically lived under conditions of considerable scarcity, though famine was rare. Except for certain fertile areas in Hedemarken and Østfold, crops were limited to hardy grains, such as oats, rye, and barley; and livestock to sheep, goats, cattle, pigs, and some poultry; in places this was complemented with hunting. In areas of Central and Northern Norway, the Sami subsisted on the nomadic herding of reindeer. Fishing all around the coast was dangerous work, though fish such as herring, cod, halibut, and other cold-water species were found in abundance. The introduction of the potato to Norway (in the 18th century) provided considerable relief for Norwegians.
All around the coast, the harvesting of fish (including cod, herring, halibut, and other cold water species) was an important supplement to farming and was in many areas in the north and west the primary household subsistence. Fishing was typically supplemented with crop-growing and the raising of livestock on small farms.
The economic conditions in Norway did not lend themselves to the formation of feudal system, though several kings did reward land to loyal subjects who became knights. Self-owning farmers were—and continue to be—the main unit of work in Norwegian agriculture, but leading up to the 19th century farmers ran out of land available for farming. Many agricultural families were reduced to poverty as tenant farmers, and served as the impetus for emigration to North America.
Industrial revolution

Aside from mining in Kongsberg, Røros and Løkken, industrialization came with the first textile mills that were built in Norway in the middle of the 19th century. But the first large industrial enterprises came into formation when entrepreneurs' politics led to the founding of banks to serve those needs.
Industries also offered employment for a large number of individuals who were displaced from the agricultural sector. As wages from industry exceeded those from agriculture, the shift started a long-term trend of reduction in cultivated land and rural population patterns. The working class became a distinct phenomenon in Norway, with its own neighborhoods, culture, and politics.
Social democratic reforms
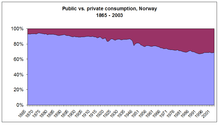
After World War II, the Norwegian Labour Party, with Einar Gerhardsen as prime minister, embarked on a number of social democratic reforms aimed at flattening the income distribution, eliminating poverty, ensuring social services such as retirement, medical care, and disability benefits to all, and putting more of the capital into the public trust.
Highly progressive income taxes, the introduction of value-added tax, and a wide variety of special surcharges and taxes made Norway one of the most heavily taxed economies in the world. Authorities particularly taxed discretionary spending, levying special taxes on automobiles, tobacco, alcohol, cosmetics, etc.
Norway's long-term social democratic policies, extensive governmental tracking of information, and the homogeneity of its population lent themselves particularly well for economic study, and academic research from Norway proved to make significant contributions to the field of macroeconomics during this era. When Norway became a petroleum-exporting country, the economic effects came under further study.
Petroleum and post-industrialism
Oil-exporting country
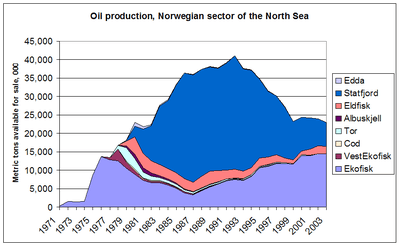
In May 1963, Norway asserted sovereign rights over natural resources in its sector of the North Sea. Exploration started on 19 July 1966, when Ocean Traveler drilled its first well. Oil was first encountered at the Balder oil field at flank of the Utsira High, about 190 km west of Stavanger, in 1967.[24] Initial exploration was fruitless, until Ocean Viking found oil on 21 August 1969. By the end of 1969, it was clear that there were large oil and gas reserves in the North Sea. The first oil field was Ekofisk, produced 427,442 barrels (67,957.8 m3) of crude in 1980. Since then, large natural gas reserves have also been discovered.
Against the backdrop of the Norwegian referendum to not join the European Union, the Norwegian Ministry of Industry, headed by Ola Skjåk Bræk moved quickly to establish a national energy policy. Norway decided to stay out of OPEC, keep its own energy prices in line with world markets, and spend the revenue – known as the "currency gift" – wisely. The Norwegian government established its own oil company, Statoil, and awarded drilling and production rights to Norsk Hydro and the newly formed Saga Petroleum. Petroleum exports are taxed at a marginal rate of 78% (standard corporate tax of 24%, and a special petroleum tax of 54%).[25]
The North Sea turned out to present many technological challenges for production and exploration, and Norwegian companies invested in building capabilities to meet these challenges. A number of engineering and construction companies emerged from the remnants of the largely lost shipbuilding industry, creating centers of competence in Stavanger and the western suburbs of Oslo. Stavanger also became the land-based staging area for the offshore drilling industry. Presently North Sea is past its peak oil production. New oil and gas fields have been found and developed in the large Norwegian areas of the Norwegian Sea and the Barents Sea, including Snøhvit.
Reservations about European Union
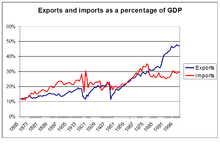
In September 1972, the Norwegian parliament put to a referendum the question whether Norway should join the European Economic Community. The proposal was turned down with a slim margin. The Norwegian government proceeded to negotiate a trade agreement with the EU that would give Norwegian companies access to European markets. Over time, Norway renegotiated and refined this agreement, ultimately joining the European Free Trade Association and the European Economic Area.
Although Norway's trade policies have long aimed at harmonizing its industrial and trade policy with the EU's, a new referendum in 1994 gave the same result as in 1972, and Norway remains one of only two Nordic countries outside the EU, the other being Iceland.
Although much of the highly divisive public debate about EU membership turned on political rather than economic issues, it formed economic policy in several important ways:
- Both politicians and the public came to terms with the fact that Norway's economic development was dependent on taking advantage of its comparative advantage by specializing in certain areas for export and relying on import for everything else. This has had a significant effect on Norway's agricultural policy, which has been reshaped to address population patterns rather than self-sufficiency.
- The proceeds from oil revenue could not fuel private or public consumption if Norway were to sustain its prosperity when oil reserves run out.
- In order to participate in European markets, Norway has had to open its domestic markets to European imports. Although some pricing and distribution issues (e.g., alcohol and automobiles) remain unresolved, Norway's consumer, capital, and employment markets are increasingly approaching those of Europe in general.
Norwegians have sought accommodations on a range of specific issues, such as products from fish farms, agricultural products, emission standards, etc., but these do not appear to differ substantially from those sought by bona fide EU members. It is expected that the issue of membership will be brought to a referendum again at some point.
Post-industrial economic developments
Several issues have dominated the debate on Norway's economy since the 1970s:
- Cost of living. Norway is among the most expensive countries in the world, as reflected in the Big Mac Index and other indices. Historically, transportation costs and barriers to free trade had caused the disparity, but in recent years, Norwegian policy in labor relations, taxation, and other areas have contributed significantly.
- Competitiveness of "mainland" industries. The high cost of labor and other structural features of the Norwegian environment have caused concern about Norway's ability to maintain its cost of living in a post-petroleum era. There is a clear trend toward ending the practice of "protecting" certain industries (vernede industrier) and making more of them "exposed to competition" (konkurranseutsettelse). In addition to interest in information technology, a number of small- to medium-sized companies have been formed to develop and market highly specialized technology solutions.
- The role of the public sector. The ideological divide between socialist and non-socialist views on public ownership has decreased over time. The Norwegian government has sought to reduce its ownership over companies that require access to private capital markets, and there is an increasing emphasis on government facilitating entrepreneurship rather than controlling (or restricting) capital formation. A residual distrust of the "profit motive" persists, and Norwegian companies are heavily regulated, especially with respect to labor relations.
- The future of the welfare state. Since World War II, successive Norwegian governments have sought to broaden and extend public benefits to its citizens, in the form of sickness and disability benefits, minimum guaranteed pensions, heavily subsidized or free universal health care, unemployment insurance, and so on. Public policy still favors the provision of such benefits, but there is increasing debate on making them more equitable and needs-based.
- Urbanization. For several decades, agricultural policy in Norway was based on the premise of minimal self-sufficiency. In later years, this has given way to a greater emphasis on maintaining population patterns outside of major urban areas. The term "district policy" (distriktspolitikk) has come to mean the demand that old and largely rural Norway is allowed to persist, ideally by providing them with a sustainable economic basis.
- Taxation. The primary purpose of the Norwegian tax system has been to raise revenue for public expenditures; but it is also viewed as a means to achieve social objectives, such as redistribution of income, reduction in alcohol and tobacco consumption, and as a disincentive against certain behaviors. Three elements of the tax system seem to attract the most debate:
- Progressive taxation. At one time one of the most aggressive in the world, the top marginal tax rate on income has been decreased over time. In addition, Norwegians are taxed for their stated net worth, which some have argued discourages savings.
- Value-added tax. The largest source of government revenue. The current standard rate is 25%, food and drink is 15%, and movie theater tickets and public transportation 8%.
- Special surcharges and taxes. The government has established a number of taxes related to specific purchases, including cars, alcohol, tobacco, and various kinds of benefits.
- Svalbard. People living on Svalbard (Spitsbergen) pay reduced taxes due to "Svalbardtraktaten".
- Environmental concerns. A number of political issues have had their origins in ecological concerns, including the refineries at Mongstad and the hydroelectric power plant at Alta.
State ownership role
The Norwegian state maintains large ownership positions in key industrial sectors concentrated in natural resources and strategic industries such as the strategic petroleum sector (Equinor), hydroelectric energy production (Statkraft), aluminum production (Norsk Hydro), the largest Norwegian bank (DNB) and telecommunication provider (Telenor). The government controls around 35% of the total value of publicly listed companies on the Oslo stock exchange, with five of its largest seven listed firms partially owned by the state.[28] When non-listed companies are included the state has an even higher share in ownership (mainly from direct oil license ownership). Norway's state-owned enterprises comprise 9.6% of all non-agricultural employment, a number that rises to almost 13% when companies with minority state ownership stakes are included, the highest among OECD countries.[29] Both listed and non-listed firms with state ownership stakes are market-driven and operate in a highly liberalized market economy. The combination of relatively high degrees of state ownership in the Norwegian open-market economy has been described as a form of state capitalism.[30]
The oil and gas industries play a dominant role in the Norwegian economy, providing a source of finance for the Norwegian welfare state through direct ownership of oil fields, dividends from its shares in Equinor, and licensure fees and taxes. The oil and gas industry is Norway's largest in terms of government revenue and value-added. The organization of this sector is designed to ensure the exploration, development and extraction of petroleum resources result in public value creation for the entire society through a mixture of taxation, licensing and direct state ownership through a system called the State’s Direct Financial Interest (SDFI). The SDFI was established in 1985 and represents state-owned holdings in a number of oil and gas fields, pipelines and onshore facilities as well as 67% of the shares in Equinor. Government revenues from the petroleum industry are transferred to the Government Pension Fund of Norway Global in a structure that forbids the government from accessing the fund for public spending; only income generated by the funds' capital can be used for government spending.[31]
The high levels of state ownership have been motivated for a variety of reasons, but most importantly by a desire for national control of the utilization of natural resources. Direct state involvement began prior to the 20th century with the provision of public infrastructure, and expanded greatly into industry and commercial enterprises after the Second World War through the acquisition of German assets in several manufacturing companies. The largest expansion of state ownership occurred with the establishment of Statoil in 1972. Industries and commercial enterprises where the state owns stakes are highly liberalized and market-driven, with marketization extending to public service providers as well as industry.[32]
Data
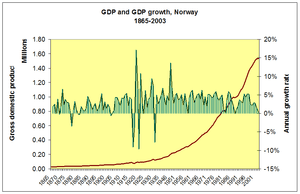
The following table shows the main economic indicators in 1980–2017. Inflation under 2% is in green.[33]
| Year | GDP (in Bil. US$ PPP) |
GDP per capita (in US$ PPP) |
GDP growth (real) |
Inflation rate (in Percent) |
Unemployment (in Percent) |
Government debt (in % of GDP) |
|---|---|---|---|---|---|---|
| 1980 | 61.3 | 14,968 | 1.7 % | 46.7 % | ||
| 1981 | ||||||
| 1982 | ||||||
| 1983 | ||||||
| 1984 | ||||||
| 1985 | ||||||
| 1986 | ||||||
| 1987 | ||||||
| 1988 | ||||||
| 1989 | ||||||
| 1990 | ||||||
| 1991 | ||||||
| 1992 | ||||||
| 1993 | ||||||
| 1994 | ||||||
| 1995 | ||||||
| 1996 | ||||||
| 1997 | ||||||
| 1998 | ||||||
| 1999 | ||||||
| 2000 | ||||||
| 2001 | ||||||
| 2002 | ||||||
| 2003 | ||||||
| 2004 | ||||||
| 2005 | ||||||
| 2006 | ||||||
| 2007 | ||||||
| 2008 | ||||||
| 2009 | ||||||
| 2010 | ||||||
| 2011 | ||||||
| 2012 | ||||||
| 2013 | ||||||
| 2014 | ||||||
| 2015 | ||||||
| 2016 | ||||||
| 2017 |
Economic structure and sustained growth
The emergence of Norway as an oil-exporting country has raised a number of issues for Norwegian economic policy. There has been concern that much of Norway's human capital investment has been concentrated in petroleum-related industries. Critics have pointed out that Norway's economic structure is highly dependent on natural resources that do not require skilled labor, making economic growth highly vulnerable to fluctuations in the demand and pricing for these natural resources. The Government Pension Fund of Norway is part of several efforts to hedge against dependence on petroleum revenue.
Because of the oil boom since the 1970s, there has been little government incentive to help develop and encourage new industries in the private sector, in contrast to other Nordic countries like Sweden and particularly Finland. However the last decades have started to see some incentive on national and local government levels to encourage formation of new "mainland" industries that are competitive internationally. In addition to aspirations for a high-tech industry, there is growing interest in encouraging small business growth as a source of employment for the future. In 2006, the Norwegian government formed nine "centers of expertise" to facilitate this business growth.[34] Later in June 2007, the government contributed to the formation of the Oslo Cancer Cluster (OCC) as a center of expertise, capitalizing on the fact that 80% of cancer research in Norway takes place in proximity to Oslo and that most Norwegian biotechnology companies are focused on cancer.[34]
Regional variation
| Region | GDP per capita 2015 | ||
|---|---|---|---|
| in euros | As % of EU-28 average | ||
| 29,000 | 100% | ||
| 46,300 | 160% | ||
| Richest | Oslo and Akershus | 51,800 | 178% |
| Agder and Rogaland | 40,600 | 140% | |
| Vestlandet | 39,400 | 136% | |
| Trøndelag | 35,500 | 122% | |
| Nord-Norge | 33,500 | 115% | |
| Sør-Østlandet | 30,000 | 103% | |
| Poorest | Hedmark and Oppland | 29,100 | 100% |
Source: Eurostat[35]
See also
Notes
- "World Economic Outlook Database, April 2019". IMF.org. International Monetary Fund. Retrieved 29 September 2019.
- "World Bank Country and Lending Groups". datahelpdesk.worldbank.org. World Bank. Retrieved 29 September 2019.
- "Population on 1 January". ec.europa.eu/eurostat. Eurostat. Retrieved 29 March 2020.
- "World Economic Outlook Database, October 2019". IMF.org. International Monetary Fund. Retrieved 20 October 2019.
- "World Economic Outlook Database, April 2020". IMF.org. International Monetary Fund. Retrieved 15 April 2020.
- "The World Factbook". CIA.gov. Central Intelligence Agency. Retrieved 29 June 2019.
- "People at risk of poverty or social exclusion". ec.europa.eu/eurostat. Eurostat. Retrieved 13 January 2020.
- "Gini coefficient of equivalised disposable income - EU-SILC survey". ec.europa.eu/eurostat. Eurostat. Retrieved 3 October 2019.
- "Human Development Index (HDI)". hdr.undp.org. HDRO (Human Development Report Office) United Nations Development Programme. Retrieved 11 December 2019.
- "Inequality-adjusted Human Development Index (IHDI)". hdr.undp.org. HDRO (Human Development Report Office) United Nations Development Programme. Retrieved 11 December 2019.
- "Labor Force Survey". ssb.no. Statistics Norway. Retrieved 29 June 2019.
- "Unemployment by sex and age - monthly average". appsso.eurostat.ec.europa.eu. Eurostat. Retrieved 4 June 2020.
- "Youth unemployment rate". data.oecd.org. OECD. Retrieved 3 April 2020.
- "Ease of Doing Business in Norway". Doingbusiness.org. Archived from the original on 4 November 2017. Retrieved 21 November 2017.
- "Sovereigns rating list". Standard & Poor's. Archived from the original on 28 September 2011. Retrieved 26 May 2011.
- Rogers, Simon; Sedghi, Ami (15 April 2011). "How Fitch, Moody's and S&P rate each country's credit rating". The Guardian. Archived from the original on 1 August 2013. Retrieved 31 May 2011.
- "Scope affirms Norway's sovereign credit rating at AAA with a Stable Outlook". Scope Ratings. Retrieved 8 February 2019.
- The economic effects of north sea oil on the manufacturing sector Archived 2 February 2014 at the Wayback Machine Hilde Christiane Bjørnland
- Overview of the Norwegian oil and gas sector Archived 23 May 2013 at the Wayback Machine Embassy of Denmark, Oslo
- "Archived copy" (PDF). Archived from the original (PDF) on 20 June 2013. Retrieved 28 December 2012.CS1 maint: archived copy as title (link)
- The Oil Industry and Government Strategy in the North Sea Øystein Noreng
- "The rich cousin". The Economist. 1 February 2013. Archived from the original on 1 February 2013. Retrieved 1 February 2013.
- "United Nations Statistics Division - National Accounts". unstats.un.org. Archived from the original on 5 February 2016. Retrieved 30 April 2018.
- Riber, Lars; Dypvik, Henning; Sørlie, Ronald (2015). "Altered basement rocks on the Utsira High and its surroundings, Norwegian North Sea" (PDF). Norwegian Journal of Geology. 95 (1): 57–89. Retrieved 3 February 2018.
- "Archived copy". Archived from the original on 14 January 2018. Retrieved 14 January 2018.CS1 maint: archived copy as title (link)
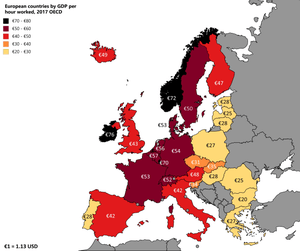
- Source: GDP per capita and productivity growth. "Productivity – GDP per hour worked". Data.oecd.org. Archived from the original on 24 January 2018. Retrieved 14 December 2017.
- "The Atlas of Economic Complexity by @HarvardCID". atlas.cid.harvard.edu. Retrieved 20 May 2018.
- LIE, EINAR (6 April 2016). "Context and Contingency: Explaining State Ownership in Norway". Enterprise & Society. 17 (4): 904–930. doi:10.1017/eso.2016.18.
- Korin Kane (17 September 2018). "The Size and Sectoral Distribution of State-Owned Enterprises" (PDF). OECD.ORG. Retrieved 3 October 2019.
- "Norway - Marketisation of Government Services State-Owned Enterprises" (PDF). OECD.ORG. 2003. Retrieved 3 October 2019.
- "The Government's Revenues". Norwegian Petroleum. 15 May 2019. Retrieved 3 October 2019.
- "Norway - Marketisation of Government Services State-Owned Enterprises" (PDF). OECD.ORG. 2003. Retrieved 3 October 2019.
- "Report for Selected Countries and Subjects". www.imf.org. Retrieved 15 September 2018.
- Aldridge 2008
- Gross domestic product (GDP) at current market prices by NUTS 2 regions Archived 24 October 2017 at the Wayback Machine Eurostat
- data cover general government debt and include debt instruments issued (or owned) by government entities other than the treasury; the data exclude treasury debt held by foreign entities; the data exclude debt issued by subnational entities, as well as intragovernmental debt; intragovernmental debt consists of treasury borrowings from surpluses in the social funds, such as for retirement, medical care, and unemployment; debt instruments for the social funds are not sold at public auctions
References
- Aldridge, Susan (1 June 2008), "Norway's Oncology Efforts are Coalescing", Genetic Engineering & Biotechnology News, Clinical Research & Diagnostics, Mary Ann Liebert, Inc., 28 (11), pp. 58, 60, ISSN 1935-472X, OCLC 77706455, archived from the original on 24 January 2013, retrieved 3 January 2010CS1 maint: ref=harv (link)
- Economic history of Norway, EH.Net Encyclopedia of Economic and Business History, March 16, 2008 article by business historian Ola Honningdal Grytten, professor at NHH
- OSE ALL SHARE GI
- A substantial part of this article has been copied from the Bureau of Public Affairs, U.S. Department of State, country overview for Norway.
- Norway in CIA World Factbook
- Statistics Norway
External links
- OECD's Norway country website
- OECD Economic Survey of Norway
- World Bank Summary Trade Statistics Norway
- Tariffs applied by Norway as provided by ITC's Market Access Map, an online database of customs tariffs and market requirements
Norway articles | |||||||
|---|---|---|---|---|---|---|---|
| History |
|  | |||||
| Geography | |||||||
| Politics |
| ||||||
| Economy |
| ||||||
| Society |
| ||||||
| |||||||
| |||||||||