Colorado's 4th congressional district
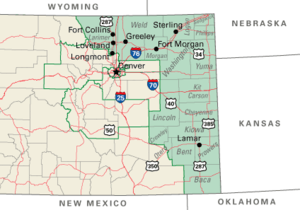
Colorado's 4th congressional district is a congressional district in the U.S. state of Colorado. Located in the eastern part of the state, the district encompasses most of the rural Eastern Plains as well as the larger Colorado Front Range cities of Greeley, Longmont, Castle Rock, and Parker.
| Colorado's 4th congressional district | |||
|---|---|---|---|
.tif.png) Colorado's 4th congressional district - since January 3, 2013. | |||
| Representative |
| ||
| Distribution |
| ||
| Population (2016) | 795,836[2] | ||
| Median income | $73,735[3] | ||
| Ethnicity |
| ||
| Cook PVI | R+13[4] | ||
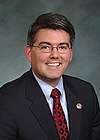
The district is currently represented by Republican Ken Buck. It is one of the most conservative districts in the Mountain States, especially since the 2012 redistricting removed Fort Collins from the district. No Democrat has seriously contested the district since 2010.
History
1990s
Following the 1990 U.S. Census and associated realignment of Colorado congressional districts, the 4th Congressional district consisted of Baca, Bent, Cheyenne, Crowley, Elbert, Kiowa, Kit Carson, Larimer, Las Animas, Lincoln, Logan, Morgan, Otero, Phillips, Prowers, Sedgwick, Washington, Weld and Yuma counties, as well as portions of Adams and Arapahoe counties.
2000s
Following the 2000 U.S. Census and associated realignment of Colorado congressional districts, the 4th Congressional district consisted of Baca, Bent, Cheyenne, Crowley, Kiowa, Kit Carson, Larimer, Lincoln, Logan, Morgan, Phillips, Prowers, Sedgwick, Washington, Weld and Yuma counties, as well as portions of Boulder, and Otero counties.
2010s
Following the 2010 U.S. Census and associated realignment of Colorado congressional districts, the 4th Congressional district consisted of Baca, Bent, Cheyenne, Crowley, Elbert, Kiowa, Kit Carson, Las Animas, Lincoln, Logan, Morgan, Otero, Phillips, Prowers, Sedgwick, Washington, Weld and Yuma counties. The district also includes portions of Adams, Arapahoe, Boulder and Douglas counties.
Characteristics
This district consists mainly of the area of Colorado that is part of the Great Plains region of the United States. It is largely rural. The only large cities in the district are Greeley, Longmont, Castle Rock, and Parker. Until the 2010s redistricting, Fort Collins was the largest city in the district.
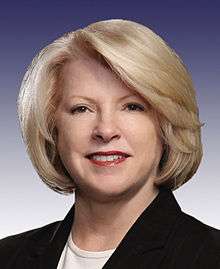
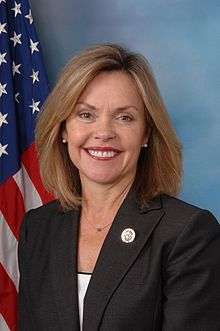
Historically, the district has been Republican-leaning, though Marilyn Musgrave won relatively narrow victories in 2004 and 2006 due to her Democratic opponents' strength in Fort Collins. Musgrave had to rely on strong performances in more conservative Greeley to hold onto her seat. In 2008, Musgrave lost reelection to Betsy Markey, who became the first Democrat to represent the district since the early 1970s. Markey was defeated in 2010 by Republican Cory Gardner, and the district was made more Republican in redistricting due to the removal of Fort Collins; no Democratic nominee has won more than 40% of the vote since she left office.
George W. Bush received 58% of the vote in this district in 2004. John McCain narrowly carried the district in 2008 with 50% of the vote.
Voting
Election results from presidential races[5]
| Election results from presidential races | ||
|---|---|---|
| Year | Office | Results |
| 2000 | President | Bush 57 - 37% |
| 2004 | President | Bush 58 - 41% |
| 2008 | President | McCain 50 - 49% |
| 2012 | President | Romney 59 - 40% |
| 2016 | President | Trump 57 – 34% |
List of members representing the district
| Member | District Home | Party | Term Duration | Cong ress(es) |
Electoral history |
|---|---|---|---|---|---|
| District created | March 4, 1915 | ||||
.jpg) Edward T. Taylor |
Glenwood Springs | Democratic | March 4, 1915 – September 3, 1941 |
64th 65th 66th 67th 68th 69th 70th 71st 72nd 73rd 74th 75th 76th 77th |
Redistricted from the at-large district and re-elected in 1914. Died. |
| Vacant | September 3, 1941 – December 9, 1941 |
77th | |||
.jpg) Robert F. Rockwell |
Paonia | Republican | December 9, 1941 – January 3, 1949 |
77th 78th 79th 80th |
Elected to finish Taylor's term. Re-elected in 1942. Re-elected in 1944. Re-elected in 1946. Lost re-election. |
 Wayne N. Aspinall |
Palisade | Democratic | January 3, 1949 – January 3, 1973 |
81st 82nd 83rd 84th 85th 86th 87th 88th 89th 90th 91st 92nd |
Elected in 1948. Re-elected in 1950. Re-elected in 1952. Re-elected in 1954. Re-elected in 1956. Re-elected in 1958. Re-elected in 1960. Re-elected in 1962. Re-elected in 1964. Re-elected in 1966. Re-elected in 1968. Re-elected in 1970. Lost renomination. |
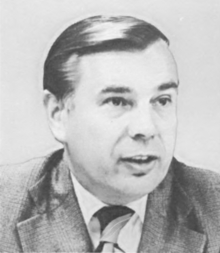 Jim Johnson |
Fort Collins | Republican | January 3, 1973 – January 3, 1981 |
93rd 94th 95th 96th |
Elected in 1972. Re-elected in 1974. Re-elected in 1976. Re-elected in 1978. Retired. |
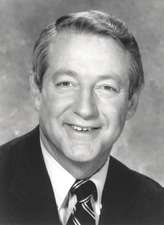 Hank Brown |
Greeley | Republican | January 3, 1981 – January 3, 1991 |
97th 98th 99th 100th 101st |
Elected in 1980. Re-elected in 1982. Re-elected in 1984. Re-elected in 1986. Re-elected in 1988. Retired to run for U.S. Senator. |
 Wayne Allard |
Loveland | Republican | January 3, 1991 – January 3, 1997 |
102nd 103rd 104th |
Elected in 1990. Re-elected in 1992. Re-elected in 1994. Retired to run for U.S. Senator. |
 Bob Schaffer |
Fort Collins | Republican | January 3, 1997 – January 3, 2003 |
105th 106th 107th |
Elected in 1996. Re-elected in 1998. Re-elected in 2000. Retired. |
 Marilyn Musgrave |
Fort Morgan | Republican | January 3, 2003 – January 3, 2009 |
108th 109th 110th |
Elected in 2002. Re-elected in 2004. Re-elected in 2006. Lost re-election. |
 Betsy Markey |
Fort Collins | Democratic | January 3, 2009 – January 3, 2011 |
111th | Elected in 2008. Lost re-election. |
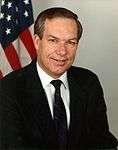
 Cory Gardner |
Yuma | Republican | January 3, 2011 – January 3, 2015 |
112th 113th |
Elected in 2010. Re-elected in 2012. Retired to run for U.S. Senator. |
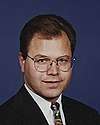
.jpg) Ken Buck |
Greeley | Republican | January 3, 2015 – Present |
114th 115th 116th |
Elected in 2014. Re-elected in 2016. Re-elected in 2018. |
Election results
1914
| Party | Candidate | Votes | % | ||
|---|---|---|---|---|---|
| Democratic | Edward T. Taylor (Incumbent) | 26,562 | 57.83 | ||
| Republican | H.J. Baird | 15,015 | 32.69 | ||
| Socialist | George Kunkle | 4,353 | 9.48 | ||
| Total votes | 45,930 | 100.0 | |||
| Democratic win (new seat) | |||||
1916
| Party | Candidate | Votes | % | |
|---|---|---|---|---|
| Democratic | Edward T. Taylor (Incumbent) | 30,926 | 65.78 | |
| Republican | H.J. Baird | 13,397 | 28.49 | |
| Socialist | Emery D. Cox | 2,695 | 5.73 | |
| Total votes | 47,018 | 100.0 | ||
| Democratic hold | ||||
1918
| Party | Candidate | Votes | % | |
|---|---|---|---|---|
| Democratic | Edward T. Taylor (Incumbent) | 22,423 | 65.72 | |
| Republican | Straud M. Logan | 11,695 | 34.28 | |
| Total votes | 34,118 | 100.0 | ||
| Democratic hold | ||||
1920
| Party | Candidate | Votes | % | |
|---|---|---|---|---|
| Democratic | Edward T. Taylor (Incumbent) | 25,994 | 55.32 | |
| Republican | Merle D. Vincent | 20,991 | 44.68 | |
| Total votes | 46,985 | 100.0 | ||
| Democratic hold | ||||
1922
| Party | Candidate | Votes | % | |
|---|---|---|---|---|
| Democratic | Edward T. Taylor (Incumbent) | 30,331 | 64.26 | |
| Republican | Merle D. Vincent | 16,870 | 35.74 | |
| Total votes | 47,201 | 100.0 | ||
| Democratic hold | ||||
1924
| Party | Candidate | Votes | % | |
|---|---|---|---|---|
| Democratic | Edward T. Taylor (Incumbent) | 33,262 | 65.54 | |
| Republican | Webster S. Whinnery | 17,486 | 34.46 | |
| Total votes | 50,748 | 100.0 | ||
| Democratic hold | ||||
1926
| Party | Candidate | Votes | % | |
|---|---|---|---|---|
| Democratic | Edward T. Taylor (Incumbent) | 32,093 | 66.75 | |
| Republican | Webster S. Whinnery | 15,990 | 33.25 | |
| Total votes | 48,083 | 100.0 | ||
| Democratic hold | ||||
1928
| Party | Candidate | Votes | % | |
|---|---|---|---|---|
| Democratic | Edward T. Taylor (Incumbent) | 30,142 | 58.84 | |
| Republican | William P. Dale | 21,089 | 41.16 | |
| Total votes | 51,231 | 100.0 | ||
| Democratic hold | ||||
1930
| Party | Candidate | Votes | % | |
|---|---|---|---|---|
| Democratic | Edward T. Taylor (Incumbent) | 34,536 | 66.95 | |
| Republican | Webster S. Whinnery | 17,051 | 33.05 | |
| Total votes | 51,587 | 100.0 | ||
| Democratic hold | ||||
1932
| Party | Candidate | Votes | % | |
|---|---|---|---|---|
| Democratic | Edward T. Taylor (Incumbent) | 40,736 | 65.99 | |
| Republican | Richard C. Callen | 20,993 | 34.01 | |
| Total votes | 61,729 | 100.0 | ||
| Democratic hold | ||||
1934
| Party | Candidate | Votes | % | |
|---|---|---|---|---|
| Democratic | Edward T. Taylor (Incumbent) | 39,747 | 67.30 | |
| Republican | Harry McDevitt | 17,234 | 29.18 | |
| Veterans' Party | Gustavis A. Billstrom | 1,625 | 2.75 | |
| Independent | O.W. Daggett | 457 | 0.77 | |
| Total votes | 59,063 | 100.0 | ||
| Democratic hold | ||||
1936
| Party | Candidate | Votes | % | |
|---|---|---|---|---|
| Democratic | Edward T. Taylor (Incumbent) | 42,010 | 65.45 | |
| Republican | John S. Woody | 22,175 | 34.55 | |
| Total votes | 64,185 | 100.0 | ||
| Democratic hold | ||||
1938
| Party | Candidate | Votes | % | |
|---|---|---|---|---|
| Democratic | Edward T. Taylor (Incumbent) | 43,596 | 63.74 | |
| Republican | John S. Woody | 24,805 | 36.26 | |
| Total votes | 68,401 | 100.0 | ||
| Democratic hold | ||||
1940
| Party | Candidate | Votes | % | |
|---|---|---|---|---|
| Democratic | Edward T. Taylor (Incumbent) | 44,095 | 59.41 | |
| Republican | Paul W. Crawford | 30,126 | 40.59 | |
| Total votes | 74,221 | 100.0 | ||
| Democratic hold | ||||
1941 (Special)
| Party | Candidate | Votes | % | |||
|---|---|---|---|---|---|---|
| Republican | Robert F. Rockwell | 19,918 | 54.04 | |||
| Democratic | Frank Delaney | 16,941 | 45.96 | |||
| Total votes | 36,859 | 100.0 | ||||
| Republican gain from Democratic | ||||||
1942
| Party | Candidate | Votes | % | |
|---|---|---|---|---|
| Republican | Robert F. Rockwell (Incumbent) | 28,460 | 58.75 | |
| Democratic | Elizabeth E. Pellet | 19,979 | 41.25 | |
| Total votes | 48,439 | 100.0 | ||
| Republican hold | ||||
1944
| Party | Candidate | Votes | % | |
|---|---|---|---|---|
| Republican | Robert F. Rockwell (Incumbent) | 38,671 | 61.67 | |
| Democratic | John L. Heuschkel | 24,039 | 38.33 | |
| Total votes | 62,710 | 100.0 | ||
| Republican hold | ||||
1946
| Party | Candidate | Votes | % | |
|---|---|---|---|---|
| Republican | Robert F. Rockwell (Incumbent) | 28,894 | 58.75 | |
| Democratic | Thomas Matthews | 20,290 | 41.25 | |
| Total votes | 49,184 | 100.0 | ||
| Republican hold | ||||
1948
| Party | Candidate | Votes | % | |||
|---|---|---|---|---|---|---|
| Democratic | Wayne Aspinall | 34,695 | 51.86 | |||
| Republican | Robert F. Rockwell (Incumbent) | 32,206 | 48.14 | |||
| Total votes | 66,901 | 100.0 | ||||
| Democratic gain from Republican | ||||||
1950
| Party | Candidate | Votes | % | |
|---|---|---|---|---|
| Democratic | Wayne Aspinall (Incumbent) | 35,797 | 57.30 | |
| Republican | Jack Evans | 26,674 | 42.70 | |
| Total votes | 62,471 | 100.0 | ||
| Democratic hold | ||||
1952
| Party | Candidate | Votes | % | |
|---|---|---|---|---|
| Democratic | Wayne Aspinall (Incumbent) | 39,676 | 50.02 | |
| Republican | Howard M. Shults | 39,647 | 49.98 | |
| Total votes | 79,323 | 100.0 | ||
| Democratic hold | ||||
1954
| Party | Candidate | Votes | % | |
|---|---|---|---|---|
| Democratic | Wayne Aspinall (Incumbent) | 34,294 | 53.49 | |
| Republican | Charles E. Wilson | 29,818 | 46.51 | |
| Total votes | 64,112 | 100.0 | ||
| Democratic hold | ||||
1956
| Party | Candidate | Votes | % | |
|---|---|---|---|---|
| Democratic | Wayne Aspinall (Incumbent) | 48,489 | 61.76 | |
| Republican | Hugh Caldwell | 30,026 | 38.24 | |
| Total votes | 78,515 | 100.0 | ||
| Democratic hold | ||||
1958
| Party | Candidate | Votes | % | |
|---|---|---|---|---|
| Democratic | Wayne Aspinall (Incumbent) | 43,785 | 63.61 | |
| Republican | J.R. "Dick" Wells | 25,048 | 36.39 | |
| Total votes | 68,833 | 100.0 | ||
| Democratic hold | ||||
1960
| Party | Candidate | Votes | % | |
|---|---|---|---|---|
| Democratic | Wayne Aspinall (Incumbent) | 58,731 | 68.54 | |
| Republican | Charles P. Casteel | 26,960 | 31.46 | |
| Total votes | 85,691 | 100.0 | ||
| Democratic hold | ||||
1962
| Party | Candidate | Votes | % | |
|---|---|---|---|---|
| Democratic | Wayne Aspinall (Incumbent) | 42,462 | 58.65 | |
| Republican | Leo L. Sommerville | 29,943 | 41.35 | |
| Total votes | 72,405 | 100.0 | ||
| Democratic hold | ||||
1964
| Party | Candidate | Votes | % | |
|---|---|---|---|---|
| Democratic | Wayne Aspinall (Incumbent) | 106,685 | 63.02 | |
| Republican | Edwin S. Lamm | 62,617 | 36.98 | |
| Total votes | 169,302 | 100.0 | ||
| Democratic hold | ||||
1966
| Party | Candidate | Votes | % | |
|---|---|---|---|---|
| Democratic | Wayne Aspinall (Incumbent) | 84,107 | 58.61 | |
| Republican | James Paul Johnson | 59,404 | 41.39 | |
| Total votes | 143,511 | 100.0 | ||
| Democratic hold | ||||
1968
| Party | Candidate | Votes | % | |
|---|---|---|---|---|
| Democratic | Wayne Aspinall (Incumbent) | 92,680 | 54.69 | |
| Republican | Fred E. Anderson | 76,776 | 45.31 | |
| Total votes | 169,456 | 100.0 | ||
| Democratic hold | ||||
1970
| Party | Candidate | Votes | % | |
|---|---|---|---|---|
| Democratic | Wayne Aspinall (Incumbent) | 76,244 | 55.08 | |
| Republican | Bill Gossard | 62,169 | 44.92 | |
| Total votes | 138,413 | 100.0 | ||
| Democratic hold | ||||
1972
| Party | Candidate | Votes | % | |||
|---|---|---|---|---|---|---|
| Republican | James Paul Johnson | 94,994 | 51.03 | |||
| Democratic | Alan Merson | 91,151 | 48.97 | |||
| Total votes | 186,145 | 100.0 | ||||
| Republican gain from Democratic | ||||||
1974
| Party | Candidate | Votes | % | |
|---|---|---|---|---|
| Republican | James Paul Johnson (Incumbent) | 82,982 | 52.05 | |
| Democratic | John Carroll | 76,452 | 47.95 | |
| Total votes | 159,434 | 100.0 | ||
| Republican hold | ||||
1976
| Party | Candidate | Votes | % | |
|---|---|---|---|---|
| Republican | James Paul Johnson (Incumbent) | 119,458 | 54.05 | |
| Democratic | Daniel Ogden | 76,995 | 34.84 | |
| Independent | Dick Davis | 20,398 | 9.23 | |
| Independent | Henry Thiel | 4,167 | 1.89 | |
| Total votes | 221,018 | 100.0 | ||
| Republican hold | ||||
1978
| Party | Candidate | Votes | % | |
|---|---|---|---|---|
| Republican | James Paul Johnson (Incumbent) | 103,121 | 61.18 | |
| Democratic | Morgan Smith | 65,421 | 38.82 | |
| Total votes | 168,542 | 100.0 | ||
| Republican hold | ||||
1980
| Party | Candidate | Votes | % | |
|---|---|---|---|---|
| Republican | Hank Brown | 178,221 | 68.42 | |
| Democratic | Polly Baca | 76,849 | 29.50 | |
| Libertarian | Cynthia Molson-Smith | 5,421 | 2.08 | |
| Total votes | 260,491 | 100.0 | ||
| Republican hold | ||||
1982
| Party | Candidate | Votes | % | |
|---|---|---|---|---|
| Republican | Hank Brown (Incumbent) | 105,550 | 69.76 | |
| Democratic | Charles "Bud" Bishopp | 45,750 | 30.24 | |
| Total votes | 151,300 | 100.0 | ||
| Republican hold | ||||
1984
| Party | Candidate | Votes | % | |
|---|---|---|---|---|
| Republican | Hank Brown (Incumbent) | 146,469 | 71.13 | |
| Democratic | Mary Fagan Bates | 56,462 | 27.42 | |
| Libertarian | Randy Fitzgerald | 2,999 | 1.45 | |
| Total votes | 205,930 | 100.0 | ||
| Republican hold | ||||
1986
| Party | Candidate | Votes | % | |
|---|---|---|---|---|
| Republican | Hank Brown (Incumbent) | 117,089 | 69.80 | |
| Democratic | David Sprague | 50,672 | 30.20 | |
| Total votes | 167,761 | 100.0 | ||
| Republican hold | ||||
1988
| Party | Candidate | Votes | % | |
|---|---|---|---|---|
| Republican | Hank Brown (Incumbent) | 156,202 | 73.08 | |
| Democratic | Charles S. Vigil | 57,552 | 26.92 | |
| Total votes | 213,754 | 100.0 | ||
| Republican hold | ||||
1990
| Party | Candidate | Votes | % | |
|---|---|---|---|---|
| Republican | Wayne Allard | 89,285 | 54.05 | |
| Democratic | Richard R. "Dick" Bond | 75,901 | 45.95 | |
| Total votes | 165,186 | 100.0 | ||
| Republican hold | ||||
1992
| Party | Candidate | Votes | % | |
|---|---|---|---|---|
| Republican | Wayne Allard (Incumbent) | 139,884 | 57.84 | |
| Democratic | Tom Redder | 101,957 | 42.16 | |
| Total votes | 241,841 | 100.0 | ||
| Republican hold | ||||
1994
| Party | Candidate | Votes | % | |
|---|---|---|---|---|
| Republican | Wayne Allard (Incumbent) | 136,251 | 72.30 | |
| Democratic | Cathy Kipp | 52,202 | 27.70 | |
| Total votes | 188,453 | 100.0 | ||
| Republican hold | ||||
1996
| Party | Candidate | Votes | % | |
|---|---|---|---|---|
| Republican | Bob Schaffer | 137,012 | 56.14 | |
| Democratic | Guy Kelley | 92,837 | 38.04 | |
| American | Wesley Paul "Wes" McKinley | 7,428 | 3.04 | |
| Natural Law | Cynthia Parker | 6,790 | 2.78 | |
| Total votes | 244,067 | 100.0 | ||
| Republican hold | ||||
1998
| Party | Candidate | Votes | % | |
|---|---|---|---|---|
| Republican | Bob Schaffer (Incumbent) | 131,318 | 59.34 | |
| Democratic | Susan Kirkpatrick | 89,973 | 40.66 | |
| Total votes | 221,291 | 100.0 | ||
| Republican hold | ||||
2000
| Party | Candidate | Votes | % | |
|---|---|---|---|---|
| Republican | Bob Schaffer (Incumbent) | 209,078 | 79.50 | |
| Natural Law | Dan Sewell Ward | 19,721 | 7.50 | |
| Libertarian | Kordon L. Baker | 19,713 | 7.50 | |
| Constitution | Leslie J. Hanks | 9,955 | 3.77 | |
| Write-in | 4,539 | 1.73 | ||
| Total votes | 263,006 | 100.0 | ||
| Republican hold | ||||
2002
| Party | Candidate | Votes | % | |
|---|---|---|---|---|
| Republican | Marilyn Musgrave | 115,359 | 54.95 | |
| Democratic | Stan Matsunaka | 87,499 | 41.68 | |
| Libertarian | John Volz | 7,097 | 3.37 | |
| Total votes | 209,955 | 100.0 | ||
| Republican hold | ||||
2004
| Party | Candidate | Votes | % | |
|---|---|---|---|---|
| Republican | Marilyn Musgrave (Incumbent) | 155,958 | 51.05 | |
| Democratic | Stan Matsunaka | 136,812 | 44.78 | |
| Green | Bob Kinsey | 12,739 | 4.17 | |
| Total votes | 305,509 | 100.0 | ||
| Republican hold | ||||
2006
| Party | Candidate | Votes | % | |
|---|---|---|---|---|
| Republican | Marilyn Musgrave (Incumbent) | 109,732 | 45.61 | |
| Democratic | Angie Paccione | 103,748 | 43.11 | |
| Reform | Eric Eidsness | 27,133 | 11.28 | |
| Total votes | 240,613 | 100.0 | ||
| Republican hold | ||||
2008
| Party | Candidate | Votes | % | |||
|---|---|---|---|---|---|---|
| Democratic | Betsy Markey | 187,348 | 56% | |||
| Republican | Marilyn Musgrave (Incumbent) | 146,030 | 44% | |||
| Total votes | 333,378 | 100% | ||||
| Democratic gain from Republican | ||||||
2010
| Party | Candidate | Votes | % | |||
|---|---|---|---|---|---|---|
| Republican | Cory Gardner | 138,634 | 52% | |||
| Democratic | Betsy Markey (Incumbent) | 109,249 | 41% | |||
| Constitution | Doug Aden | 12,312 | 5% | |||
| No party | Ken "Wasko" Waszkiewicz | 3,986 | 2% | |||
| Total votes | 264,181 | 100% | ||||
| Republican gain from Democratic | ||||||
2012
| Party | Candidate | Votes | % | |
|---|---|---|---|---|
| Republican | Cory Gardner (Incumbent) | 200,006 | 59% | |
| Democratic | Brandon Shaffer | 128,800 | 37% | |
| Libertarian | Josh Gilliland | 10,682 | 3% | |
| Constitution | Doug Aden | 5,848 | 1% | |
| Total votes | 342,336 | 100% | ||
| Republican hold | ||||
2014
| Party | Candidate | Votes | % | |
|---|---|---|---|---|
| Republican | Ken Buck | 185,292 | 65% | |
| Democratic | Vic Meyers | 83,727 | 29% | |
| Libertarian | Jess Loban | 9,472 | 3% | |
| Independent | Grant Doherty | 8,016 | 3% | |
| Total votes | 286,507 | 100% | ||
| Republican hold | ||||
2016
| Party | Candidate | Votes | % | |
|---|---|---|---|---|
| Republican | Ken Buck | 248,230 | 63.5% | |
| Democratic | Bob Seay | 123,642 | 31.7% | |
| Libertarian | Bruce Griffith | 18,761 | 4.8% | |
| Total votes | 390,633 | 100% | ||
| Republican hold | ||||
2018
| Party | Candidate | Votes | % | |
|---|---|---|---|---|
| Republican | Ken Buck | 224,038 | 60.61% | |
| Democratic | Karen McCormick | 145,544 | 39.38% | |
| Write-in | 38 | 0.01% | ||
| Total votes | 369,620 | 100% | ||
| Republican hold | ||||
Historical district boundaries
References
- Martis, Kenneth C. (1989). The Historical Atlas of Political Parties in the United States Congress. New York: Macmillan Publishing Company.
- Martis, Kenneth C. (1982). The Historical Atlas of United States Congressional Districts. New York: Macmillan Publishing Company.
- Congressional Biographical Directory of the United States 1774–present
- Geography, US Census Bureau. "Congressional Districts Relationship Files (state-based)". www.census.gov.
- Bureau, Center for New Media & Promotion (CNMP), US Census. "My Congressional District". www.census.gov.
- https://www.census.gov/mycd/?st=08&cd=04
- "Partisan Voting Index – Districts of the 115th Congress" (PDF). The Cook Political Report. April 7, 2017. Retrieved April 7, 2017.
- Presidential Election Results, by district, swingstateproject.com
- "Our Campaigns - CO District 4 Race - Nov 03, 1914". www.ourcampaigns.com.
- "Our Campaigns - CO District 4 Race - Nov 07, 1916". www.ourcampaigns.com.
- "Our Campaigns - CO District 4 Race - Nov 05, 1918". www.ourcampaigns.com.
- "1920 Election Results" (PDF). house.gov.
- "1922 Election Results" (PDF). house.gov.
- "1924 Election Results" (PDF). house.gov.
- "1926 Election Results" (PDF). house.gov.
- "1928 Election Results" (PDF). house.gov.
- "1930 Election Results" (PDF). house.gov.
- "1932 Election Results" (PDF). house.gov.
- "1934 Election Results" (PDF). house.gov.
- "1936 Election Results" (PDF). house.gov.
- "1938 Election Results" (PDF). house.gov.
- "1940 Election Results" (PDF). house.gov.
- "Our Campaigns - CO District 4 - Special Election Race - Dec 09, 1941". www.ourcampaigns.com.
- "1942 Election Results" (PDF). house.gov.
- "1944 Election Results" (PDF). house.gov.
- "1946 Election Results" (PDF). house.gov.
- "1948 Election Results" (PDF). house.gov.
- "1950 Election Results" (PDF). house.gov.
- "1952 Election Results" (PDF). house.gov.
- "1954 Election Results" (PDF). house.gov.
- "1956 Election Results" (PDF). house.gov.
- "1958 Election Results" (PDF). house.gov.
- "1960 Election Results" (PDF). house.gov.
- "1962 Election Results" (PDF). house.gov.
- "1964 Election Results" (PDF). house.gov.
- "1966 Election Results" (PDF). house.gov.
- "1968 Election Results" (PDF). house.gov.
- "1970 Election Results" (PDF). house.gov.
- "1972 Election Results" (PDF). house.gov.
- "1974 Election Results" (PDF). house.gov.
- "1976 Election Results" (PDF). house.gov.
- "1978 Election Results" (PDF). house.gov.
- "1980 Election Results" (PDF). house.gov.
- "1982 Election Results" (PDF). house.gov.
- "1984 Election Results" (PDF). house.gov.
- "1986 Election Results" (PDF). house.gov.
- "1988 Election Results" (PDF). house.gov.
- "1990 Election Results" (PDF). house.gov.
- "1992 Election Results" (PDF). house.gov.
- "1994 Election Results" (PDF). house.gov.
- "1996 Election Results" (PDF). house.gov.
- "1998 Election Results" (PDF). house.gov.
- "2000 Election Results" (PDF). house.gov.
- "2002 Election Results" (PDF). house.gov.
- "2004 Election Results" (PDF). house.gov.
- "2006 Election Results" (PDF). house.gov.
- "2008 Election Results" (PDF). house.gov.
- "2010 Election Results". state.co.us. Archived from the original on November 29, 2010. Retrieved July 24, 2011.
- "2018 Colorado general election results". Retrieved June 21, 2019.