Lyon County, Kentucky
Lyon County is a county located in the U.S. state of Kentucky. As of the 2010 census, the population was 8,314.[1] Its county seat is Eddyville.[2] The county was formed from Caldwell County, Kentucky in 1854 and named for former Congressman Chittenden Lyon.[3][4]
Lyon County | |
|---|---|
 Lyon County Courthouse in Eddyville, Kentucky. | |
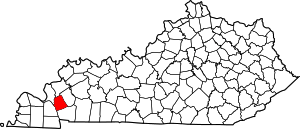 Location within the U.S. state of Kentucky | |
 Kentucky's location within the U.S. | |
| Coordinates: 37°03′32″N 88°06′49″W | |
| Country | |
| State | |
| Founded | 1854 |
| Named for | Chittenden Lyon |
| Seat | Eddyville |
| Largest city | Eddyville |
| Area | |
| • Total | 257 sq mi (670 km2) |
| • Land | 214 sq mi (550 km2) |
| • Water | 43 sq mi (110 km2) 17%% |
| Population | |
| • Estimate (2018) | 8,009 |
| • Density | 39/sq mi (15/km2) |
| Time zone | UTC−6 (Central) |
| • Summer (DST) | UTC−5 (CDT) |
| Congressional district | 1st |
| Website | www |
Geography
According to the U.S. Census Bureau, the county has a total area of 257 square miles (670 km2), of which 214 square miles (550 km2) is land and 43 square miles (110 km2) (17%) is water.[5]
Adjacent counties
- Crittenden County (north)
- Caldwell County (east)
- Trigg County (south)
- Marshall County (southwest)
- Livingston County (northwest)
National protected area
Demographics
| Historical population | |||
|---|---|---|---|
| Census | Pop. | %± | |
| 1860 | 5,307 | — | |
| 1870 | 6,233 | 17.4% | |
| 1880 | 6,768 | 8.6% | |
| 1890 | 7,628 | 12.7% | |
| 1900 | 9,319 | 22.2% | |
| 1910 | 9,423 | 1.1% | |
| 1920 | 8,795 | −6.7% | |
| 1930 | 8,530 | −3.0% | |
| 1940 | 9,067 | 6.3% | |
| 1950 | 6,853 | −24.4% | |
| 1960 | 5,924 | −13.6% | |
| 1970 | 5,562 | −6.1% | |
| 1980 | 6,490 | 16.7% | |
| 1990 | 6,624 | 2.1% | |
| 2000 | 8,080 | 22.0% | |
| 2010 | 8,314 | 2.9% | |
| Est. 2018 | 8,009 | [6] | −3.7% |
| U.S. Decennial Census[7] 1790-1960[8] 1900-1990[9] 1990-2000[10] 2010-2013[1] | |||
As of the census[11] of 2000, there were 8,080 people, 2,898 households, and 2,043 families living in the county. The population density was 38 per square mile (15/km2). There were 4,189 housing units at an average density of 19 per square mile (7.3/km2). The racial makeup of the county was 91.86% White, 6.72% Black or African American, 0.30% Native American, 0.17% Asian, 0.01% Pacific Islander, 0.40% from other races, and 0.54% from two or more races. 0.73% of the population were Hispanic or Latino of any race.
The largest ancestry groups in Lyon County, Kentucky according to the census[11] of 2000 are:
- English - 21%
- Irish - 15%
- German - 12%
- African - 7%
- French - 4%
- Scottish - 2%
- Scots-Irish - 20%
- Dutch - 2%
There were 2,898 households out of which 25.10% had children under the age of 18 living with them, 59.80% were married couples living together, 8.10% had a female householder with no husband present, and 29.50% were non-families. 26.80% of all households were made up of individuals and 12.20% had someone living alone who was 65 years of age or older. The average household size was 2.26 and the average family size was 2.70.
The age distribution was 15.80% under the age of 18, 7.50% from 18 to 24, 32.90% from 25 to 44, 27.00% from 45 to 64, and 16.80% who were 65 years of age or older. The median age was 42 years. For every 100 females there were 133.50 males. For every 100 females age 18 and over, there were 138.10 males.
The median income for a household in the county was $31,694, and the median income for a family was $39,940. Males had a median income of $36,034 versus $21,806 for females. The per capita income for the county was $16,016. About 10.20% of families and 12.70% of the population were below the poverty line, including 17.30% of those under age 18 and 13.30% of those age 65 or over.
Notable residents
- Keen Johnson, publisher and Kentucky governor, born in Lyon County, 1896
- Hylan Benton Lyon, Confederate general and Kentucky political figure
- Forrest Pogue, World War II Historian, born in Lyon County, 1912
Politics
| Year | Republican | Democratic | Third parties |
|---|---|---|---|
| 2016 | 70.4% 2,789 | 26.4% 1,045 | 3.2% 128 |
| 2012 | 62.8% 2,412 | 35.8% 1,373 | 1.4% 54 |
| 2008 | 57.6% 2,220 | 40.9% 1,577 | 1.5% 58 |
| 2004 | 54.3% 2,132 | 45.1% 1,769 | 0.6% 24 |
| 2000 | 49.4% 1,688 | 49.1% 1,680 | 1.5% 52 |
| 1996 | 34.0% 999 | 55.9% 1,641 | 10.1% 296 |
| 1992 | 30.3% 820 | 58.6% 1,583 | 11.1% 300 |
| 1988 | 44.5% 1,077 | 55.2% 1,337 | 0.3% 8 |
| 1984 | 43.0% 969 | 56.4% 1,272 | 0.6% 14 |
| 1980 | 38.3% 968 | 59.2% 1,496 | 2.5% 63 |
| 1976 | 26.3% 585 | 72.3% 1,606 | 1.4% 30 |
| 1972 | 58.5% 1,030 | 39.0% 687 | 2.4% 43 |
| 1968 | 29.9% 579 | 37.1% 719 | 33.0% 640 |
| 1964 | 29.1% 583 | 70.4% 1,412 | 0.6% 11 |
| 1960 | 42.6% 1,024 | 57.4% 1,379 | 0.0% 0 |
| 1956 | 39.0% 989 | 60.2% 1,527 | 0.8% 19 |
| 1952 | 34.6% 746 | 65.1% 1,404 | 0.4% 8 |
| 1948 | 26.2% 582 | 67.7% 1,505 | 6.1% 136 |
| 1944 | 34.5% 924 | 65.1% 1,743 | 0.3% 9 |
| 1940 | 31.6% 921 | 67.8% 1,979 | 0.6% 17 |
| 1936 | 33.2% 929 | 66.5% 1,861 | 0.3% 9 |
| 1932 | 29.3% 873 | 70.5% 2,099 | 0.2% 7 |
| 1928 | 48.4% 1,215 | 51.2% 1,286 | 0.4% 10 |
| 1924 | 36.3% 993 | 62.1% 1,696 | 1.6% 44 |
| 1920 | 38.9% 1,275 | 60.0% 1,968 | 1.2% 39 |
| 1916 | 38.2% 748 | 60.8% 1,191 | 1.1% 21 |
| 1912 | 32.0% 568 | 56.1% 996 | 11.9% 212 |
References
- "State & County QuickFacts". United States Census Bureau. Archived from the original on June 7, 2011. Retrieved March 6, 2014.
- "Find a County". National Association of Counties. Retrieved 2011-06-07.
- The Register of the Kentucky State Historical Society, Volume 1. Kentucky State Historical Society. 1903. pp. 36.
- Collins, Lewis (1877). History of Kentucky. p. 489.
- "2010 Census Gazetteer Files". United States Census Bureau. August 22, 2012. Archived from the original on August 12, 2014. Retrieved August 17, 2014.
- "Population and Housing Unit Estimates". Retrieved July 29, 2019.
- "U.S. Decennial Census". United States Census Bureau. Retrieved August 17, 2014.
- "Historical Census Browser". University of Virginia Library. Retrieved August 17, 2014.
- "Population of Counties by Decennial Census: 1900 to 1990". United States Census Bureau. Retrieved August 17, 2014.
- "Census 2000 PHC-T-4. Ranking Tables for Counties: 1990 and 2000" (PDF). United States Census Bureau. Retrieved August 17, 2014.
- "U.S. Census website". United States Census Bureau. Retrieved 2008-01-31.
- Leip, David. "Dave Leip's Atlas of U.S. Presidential Elections". uselectionatlas.org. Retrieved 2018-07-04.
External links
Municipalities and communities of Lyon County, Kentucky, United States | ||
|---|---|---|
| Cities | Location of Lyon County, Kentucky | |
| Unincorporated communities | ||
| Authority control |
|
|---|