Hancock County, Kentucky
Hancock County is a county located in the U.S. state of Kentucky. As of the 2010 census, the population was 8,565.[1] Its county seat is Hawesville.[2]
Hancock County | |
|---|---|
 Hancock County courthouse in Hawesville, KY | |
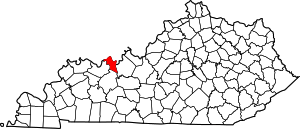 Location within the U.S. state of Kentucky | |
 Kentucky's location within the U.S. | |
| Coordinates: 37°50′N 86°47′W | |
| Country | |
| State | |
| Founded | 1829 |
| Named for | John Hancock |
| Seat | Hawesville |
| Largest city | Lewisport |
| Area | |
| • Total | 199 sq mi (520 km2) |
| • Land | 188 sq mi (490 km2) |
| • Water | 11 sq mi (30 km2) 5.6% |
| Population | |
| • Estimate (2018) | 8,758 |
| • Density | 46/sq mi (18/km2) |
| Time zone | UTC−6 (Central) |
| • Summer (DST) | UTC−5 (CDT) |
| Congressional district | 2nd |
| Website | www |
Hancock County is included in the Owensboro, KY Metropolitan Statistical Area.
History
Hancock County was formed in 1829 from portions of Breckinridge, Daviess, and Ohio counties.[3] The county is named for John Hancock, President of the Continental Congress and one of the signers of the Declaration of Independence.[4][5]
The courthouse, the second to serve the county, was built in 1868 and renovated in 1978.[6]
Geography
According to the U.S. Census Bureau, the county has a total area of 199 square miles (520 km2), of which 188 square miles (490 km2) is land and 11 square miles (28 km2) (5.6%) is water.[7] The northern border of the county lies along the Ohio River.
Adjacent counties
- Spencer County, Indiana (northwest)
- Perry County, Indiana (northeast)
- Breckinridge County (southeast)
- Ohio County (south)
- Daviess County (west)
Demographics
| Historical population | |||
|---|---|---|---|
| Census | Pop. | %± | |
| 1830 | 1,515 | — | |
| 1840 | 2,581 | 70.4% | |
| 1850 | 3,853 | 49.3% | |
| 1860 | 6,213 | 61.3% | |
| 1870 | 6,591 | 6.1% | |
| 1880 | 8,563 | 29.9% | |
| 1890 | 9,214 | 7.6% | |
| 1900 | 8,914 | −3.3% | |
| 1910 | 8,512 | −4.5% | |
| 1920 | 6,945 | −18.4% | |
| 1930 | 6,147 | −11.5% | |
| 1940 | 6,807 | 10.7% | |
| 1950 | 6,009 | −11.7% | |
| 1960 | 5,330 | −11.3% | |
| 1970 | 7,080 | 32.8% | |
| 1980 | 7,742 | 9.4% | |
| 1990 | 7,864 | 1.6% | |
| 2000 | 8,392 | 6.7% | |
| 2010 | 8,565 | 2.1% | |
| Est. 2018 | 8,758 | [8] | 2.3% |
| U.S. Decennial Census[9] 1790-1960[10] 1900-1990[11] 1990-2000[12] 2010-2013[1] | |||
As of the census[13] of 2000, there were 8,392 people, 3,215 households, and 2,436 families residing in the county. The population density was 44 per square mile (17/km2). There were 3,600 housing units at an average density of 19 per square mile (7.3/km2). The racial makeup of the county was 97.97% White, 0.85% Black or African American, 0.29% Native American, 0.17% Asian, 0.17% from other races, and 0.56% from two or more races. 0.76% of the population were Hispanic or Latino of any race.
There were 3,215 households out of which 36.40% had children under the age of 18 living with them, 64.40% were married couples living together, 8.30% had a female householder with no husband present, and 24.20% were non-families. 21.20% of all households were made up of individuals and 8.90% had someone living alone who was 65 years of age or older. The average household size was 2.59 and the average family size was 3.01.
In the county, the population was spread out with 26.70% under the age of 18, 8.50% from 18 to 24, 29.00% from 25 to 44, 24.90% from 45 to 64, and 11.00% who were 65 years of age or older. The median age was 36 years. For every 100 females, there were 97.50 males. For every 100 females age 18 and over, there were 95.80 males.
The median income for a household in the county was $36,914, and the median income for a family was $42,994. Males had a median income of $35,294 versus $23,574 for females. The per capita income for the county was $16,623. About 11.40% of families and 13.60% of the population were below the poverty line, including 18.00% of those under age 18 and 15.80% of those age 65 or over.
Communities
Incorporated
- Hawesville (county seat)
- Lewisport
Politics
| Year | Republican | Democratic | Third parties |
|---|---|---|---|
| 2016 | 64.9% 2,788 | 29.0% 1,244 | 6.1% 263 |
| 2012 | 53.5% 2,212 | 44.3% 1,833 | 2.2% 89 |
| 2008 | 46.5% 1,928 | 51.5% 2,135 | 2.0% 81 |
| 2004 | 56.7% 2,286 | 42.4% 1,709 | 0.8% 34 |
| 2000 | 56.3% 2,032 | 41.8% 1,508 | 1.9% 70 |
| 1996 | 40.6% 1,356 | 46.3% 1,547 | 13.1% 436 |
| 1992 | 35.0% 1,261 | 47.6% 1,714 | 17.5% 630 |
| 1988 | 53.4% 1,733 | 45.6% 1,478 | 1.0% 32 |
| 1984 | 59.6% 1,967 | 39.0% 1,287 | 1.4% 47 |
| 1980 | 45.5% 1,367 | 50.9% 1,530 | 3.6% 107 |
| 1976 | 40.9% 1,124 | 56.9% 1,562 | 2.2% 61 |
| 1972 | 64.6% 1,583 | 32.3% 791 | 3.1% 76 |
| 1968 | 44.7% 1,049 | 36.9% 867 | 18.4% 431 |
| 1964 | 34.5% 756 | 65.0% 1,423 | 0.5% 11 |
| 1960 | 59.4% 1,488 | 40.6% 1,018 | 0.0% 0 |
| 1956 | 56.1% 1,317 | 43.6% 1,022 | 0.3% 7 |
| 1952 | 53.1% 1,341 | 46.6% 1,177 | 0.3% 7 |
| 1948 | 45.5% 985 | 53.0% 1,146 | 1.5% 32 |
| 1944 | 54.4% 1,365 | 45.0% 1,129 | 0.6% 15 |
| 1940 | 51.5% 1,424 | 48.4% 1,338 | 0.1% 2 |
| 1936 | 44.9% 1,087 | 54.4% 1,317 | 0.7% 17 |
| 1932 | 41.5% 1,174 | 57.4% 1,623 | 1.0% 29 |
| 1928 | 58.3% 1,614 | 41.6% 1,151 | 0.1% 2 |
| 1924 | 48.9% 1,332 | 48.6% 1,323 | 2.6% 70 |
| 1920 | 50.2% 1,446 | 48.1% 1,384 | 1.7% 49 |
| 1916 | 51.1% 918 | 46.4% 833 | 2.5% 44 |
| 1912 | 15.2% 268 | 43.0% 757 | 41.8% 735 |
References
- "State & County QuickFacts". United States Census Bureau. Archived from the original on June 7, 2011. Retrieved March 8, 2014.
- "Find a County". National Association of Counties. Retrieved 2011-06-07.
- Rennick, Robert M. (1987). Kentucky Place Names. University Press of Kentucky. p. 129. Retrieved 2013-04-28.
- The Register of the Kentucky State Historical Society, Volume 1. Kentucky State Historical Society. 1903. p. 35.
- Gannett, Henry (1905). The Origin of Certain Place Names in the United States. Govt. Print. Off. p. 148.
- Hogan, Roseann Reinemuth (1992). Kentucky Ancestry: A Guide to Genealogical and Historical Research. Ancestry Publishing. p. 244. Retrieved 26 July 2013.
- "2010 Census Gazetteer Files". United States Census Bureau. August 22, 2012. Archived from the original on August 12, 2014. Retrieved August 16, 2014.
- "Population and Housing Unit Estimates". Retrieved July 29, 2019.
- "U.S. Decennial Census". United States Census Bureau. Retrieved August 16, 2014.
- "Historical Census Browser". University of Virginia Library. Retrieved August 16, 2014.
- "Population of Counties by Decennial Census: 1900 to 1990". United States Census Bureau. Retrieved August 16, 2014.
- "Census 2000 PHC-T-4. Ranking Tables for Counties: 1990 and 2000" (PDF). United States Census Bureau. Retrieved August 16, 2014.
- "U.S. Census website". United States Census Bureau. Retrieved 2008-01-31.
- Leip, David. "Dave Leip's Atlas of U.S. Presidential Elections". uselectionatlas.org. Retrieved 2018-07-02.
External links
Municipalities and communities of Hancock County, Kentucky, United States | ||
|---|---|---|
| Cities | Location of Hancock County, Kentucky | |
| Unincorporated communities | ||

| Authority control |
|
|---|