1991 Stevenage Borough Council election
The 1991 Stevenage Borough Council election took place on 2 May 1991. This was on the same day as other local elections. One third of the council was up for election; the seats which were last contested in 1987. The Labour Party retained control of the council, which it had held continuously since its creation in 1973.
| |||||||||||||||||||||||||||||||||||||||||||||||||||||
13 of the 39 seats to Stevenage Borough Council 20 seats needed for a majority | |||||||||||||||||||||||||||||||||||||||||||||||||||||
|---|---|---|---|---|---|---|---|---|---|---|---|---|---|---|---|---|---|---|---|---|---|---|---|---|---|---|---|---|---|---|---|---|---|---|---|---|---|---|---|---|---|---|---|---|---|---|---|---|---|---|---|---|---|
| |||||||||||||||||||||||||||||||||||||||||||||||||||||
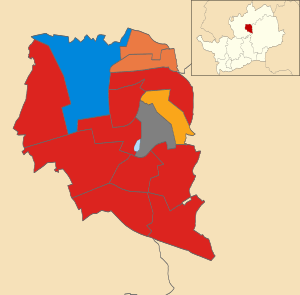 Map showing the results of contested wards in the 1991 Stevenage Borough Council elections. | |||||||||||||||||||||||||||||||||||||||||||||||||||||
| |||||||||||||||||||||||||||||||||||||||||||||||||||||
Overall results
| Party | Seats | Gains | Losses | Net gain/loss | Seats % | Votes % | Votes | +/− | ||
|---|---|---|---|---|---|---|---|---|---|---|
| Labour | 9 | 3 | 0 | 69.2 | 51.7 | 11,718 | ||||
| Conservative | 1 | 0 | 0 | 7.7 | 28.6 | 6,478 | ||||
| Liberal Democrats | 1 | 0 | 5 | 7.7 | 14.6 | 3,319 | ||||
| Liberal | 2 | 2 | 0 | 15.4 | 4.4 | 1,008 | New | |||
| Green | 0 | 0 | 0 | 0.0 | 0.6 | 133 | New | |||
| Total | 13 | 22,656 | ||||||||
| Labour hold | ||||||||||
All comparisons in seats and vote share are to the corresponding 1987 election.
Ward results
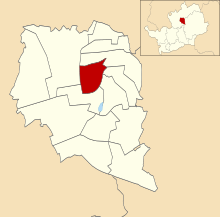
Bandley Hill
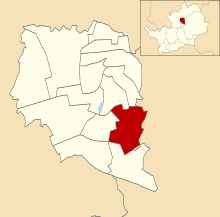
Location of Bandley Hill
| Party | Candidate | Votes | % | |
|---|---|---|---|---|
| Labour | J. Lloyd | 1,387 | 68.0% | |
| Conservative | F. Warner | 653 | 32.0% | |
| Turnout | 33.6% | |||
| Labour hold | ||||
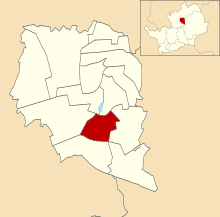
Bedwell Plash
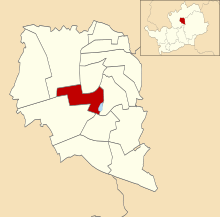
Location of Bedwell Plash ward
| Party | Candidate | Votes | % | |
|---|---|---|---|---|
| Labour | H. Lawrence | 1,197 | 73.8% | |
| Conservative | P. Gonzalez | 425 | 26.2% | |
| Turnout | 41.1% | |||
| Labour hold | ||||
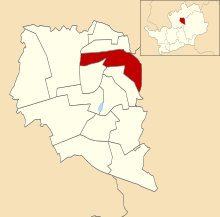
Longmeadow
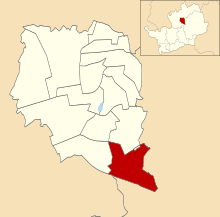
Location of Longmeadow ward
| Party | Candidate | Votes | % | |
|---|---|---|---|---|
| Labour | S. Myson | 951 | 40.7% | |
| Liberal Democrats | P. Akhurst | 840 | 36.0% | |
| Conservative | L. Bradshaw | 480 | 20.6% | |
| Green | W. Hoyes | 63 | 2.7% | |
| Turnout | 46.9% | |||
| Labour gain from Liberal Democrats | ||||
Martins Wood
Location of Martins Wood ward
| Party | Candidate | Votes | % | |
|---|---|---|---|---|
| Labour | L. Strange | 929 | 40.4% | |
| Conservative | I. Sills | 873 | 38.0% | |
| Liberal Democrats | K. Taylor | 497 | 21.6% | |
| Turnout | 42.1% | |||
| Labour hold | ||||
Mobbsbury
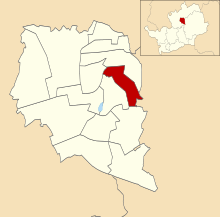
Location of Mobbsbury ward
| Party | Candidate | Votes | % | |
|---|---|---|---|---|
| Liberal Democrats | R. Parker | 869 | 50.9% | |
| Labour | J. Watts | 637 | 37.3% | |
| Conservative | J. Whittaker | 201 | 11.8% | |
| Turnout | 51.6% | |||
| Liberal Democrats hold | ||||
Monkswood
Location of Monkswood ward
| Party | Candidate | Votes | % | |
|---|---|---|---|---|
| Labour | B. Underwood | 717 | 75.6% | |
| Conservative | A. Wells | 231 | 24.4% | |
| Turnout | 39.0% | |||
| Labour hold | ||||
Old Stevenage
Location of Old Stevenage ward
| Party | Candidate | Votes | % | |
|---|---|---|---|---|
| Conservative | J. Carter | 1,195 | 47.9% | |
| Labour | J. Cox | 1,043 | 41.8% | |
| Liberal Democrats | D. Christy | 256 | 10.3% | |
| Turnout | 47.2% | |||
| Conservative hold | ||||
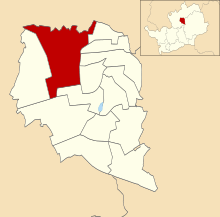
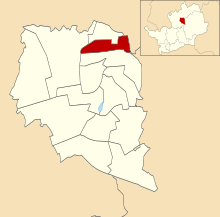
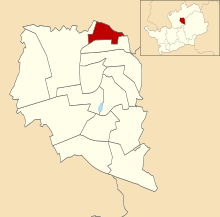
Pin Green
Location of Pin Green ward
| Party | Candidate | Votes | % | |
|---|---|---|---|---|
| Labour | D. Weston | 917 | 60.2% | |
| Conservative | C. Aylin | 366 | 24.0% | |
| Liberal Democrats | A. Simister | 170 | 11.2% | |
| Green | R. Gurney | 70 | 4.6% | |
| Turnout | 44.5% | |||
| Labour hold | ||||
Roebuck
Location of Roebuck ward
| Party | Candidate | Votes | % | |
|---|---|---|---|---|
| Labour | A. McCarthy | 903 | 50.5% | |
| Conservative | S. McPartland | 517 | 28.9% | |
| Liberal Democrats | R. Baskerville | 369 | 20.6% | |
| Turnout | 43.6% | |||
| Labour gain from Liberal Democrats | ||||
St Nicholas
Location of St Nicholas ward
| Party | Candidate | Votes | % | |
|---|---|---|---|---|
| Liberal | P. Gallagher | 637 | 43.1% | |
| Labour | M. Pelling | 541 | 36.6% | |
| Conservative | J. Gordon | 301 | 20.4% | |
| Turnout | 40.4% | |||
| Liberal gain from Liberal Democrats | ||||
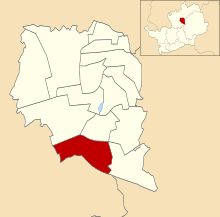
Shephall
Location of Shephall ward
| Party | Candidate | Votes | % | |
|---|---|---|---|---|
| Labour | B. Hall | 979 | 78.4% | |
| Conservative | S. Huetson | 269 | 21.6% | |
| Turnout | 36.9% | |||
| Labour hold | ||||
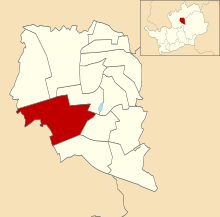
Symonds Green
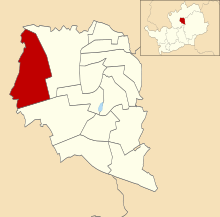
Location of Symonds Green ward
| Party | Candidate | Votes | % | |
|---|---|---|---|---|
| Labour | M. Cotter | 1,244 | 52.2% | |
| Liberal Democrats | M. Notley | 821 | 34.5% | |
| Conservative | F. Price | 318 | 13.3% | |
| Turnout | 44.3% | |||
| Labour hold | ||||
Wellfield
Location of Wellfield ward
| Party | Candidate | Votes | % | |
|---|---|---|---|---|
| Liberal | J. Wallis-Price | 371 | 47.0% | |
| Labour | R. Strange | 273 | 34.6% | |
| Conservative | J. Halling | 146 | 18.5% | |
| Turnout | 47.0% | |||
| Liberal gain from Liberal Democrats | ||||
References
- "Council compositions by year". The Elections Centre.
- "Local Election Summaries 1991". The Elections Centre.
- "Stevenage Borough Council Election Results 1973–2012" (PDF). Retrieved 11 July 2019.
| Metropolitan boroughs |
|
|---|---|
| District councils (England) |
|
| District councils (Wales) |
|
This article is issued from Wikipedia. The text is licensed under Creative Commons - Attribution - Sharealike. Additional terms may apply for the media files.