Hertfordshire County Council elections
Hertfordshire County Council in England is elected every four years. Since the last boundary changes, that took effect for the 2001 election, 77 councillors are elected for single member districts.[1]
Political control
Since 1973 political control of the council has been held by the following parties:[2]
| Party in control | Years |
|---|---|
| No overall control | 1973 - 1977 |
| Conservative | 1977 - 1985 |
| No overall control | 1985 - 1989 |
| Conservative | 1989 - 1993 |
| No overall control | 1993 - 2001 |
| Conservative | 2001–present |
Council elections
Summary of the council composition, click on the year for full details of each election.
| Year | Conservative | Labour | Liberal Democrats | Green | BNP | Independent | Notes |
|---|---|---|---|---|---|---|---|
| 1973[3] | 35 | 33 | 3 | 0 | 0 | 1 | |
| 1977[3] | 65 | 6 | 0 | 0 | 0 | 1 | |
| 1981[3] | 43 | 29 | 4 | 0 | 0 | 1 | New ward boundaries[4] |
| 1985[3] | 36 | 27 | 14 | 0 | 0 | 0 | |
| 1989[3] | 45 | 27 | 5 | 0 | 0 | 0 | |
| 1993[3] | 27 | 30 | 19 | 0 | 0 | 1 | |
| 1997[3] | 38 | 30 | 9 | 0 | 0 | 0 | |
| 2001[5] | 40 | 27 | 10 | 0 | 0 | 0 | New ward boundaries[6] |
| 2005[7] | 46 | 16 | 14 | 1 | 0 | 0 | |
| 2009[8] | 55 | 3 | 17 | 1 | 1 | 0 | |
| 2013[9] | 46 | 15 | 16 | 0 | 0 | 0 | |
| 2017[10] | 51 | 9 | 18 | 0 | 0 | 0 | New ward boundaries[11] |
County result maps
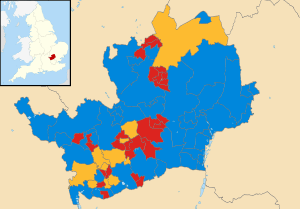 2001 results map
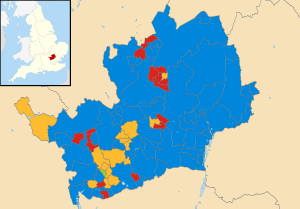 2005 results map
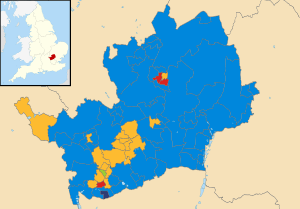 2009 results map
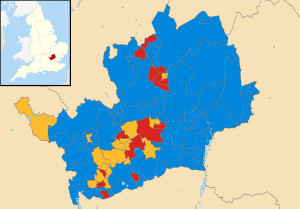 2013 results map
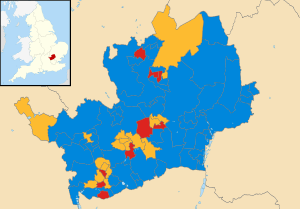 2017 results map
By-election results
By-elections are held for any vacancies that arise between elections.
1993-1997
| Party | Candidate | Votes | % | ± | |
|---|---|---|---|---|---|
| Conservative | Gerald Game | 1,067 | 62.0 | ||
| Labour | Sylvia Courtnage | 424 | 24.6 | ||
| Liberal Democrats | Henry Appiah | 231 | 13.4 | ||
| Majority | 643 | 37.4 | |||
| Turnout | 1,722 | 14.83 | |||
| Conservative hold | Swing | ||||
| Party | Candidate | Votes | % | ± | |
|---|---|---|---|---|---|
| Conservative | 1,406 | 50.9 | |||
| Labour | 1,083 | 39.2 | |||
| Liberal Democrats | 273 | 9.9 | |||
| Majority | 323 | ||||
| Turnout | 2,762 | ||||
| Conservative hold | Swing | ||||
1997-2001
| Party | Candidate | Votes | % | ± | |
|---|---|---|---|---|---|
| Conservative | 1,842 | 47.8 | +12.6 | ||
| Labour | 1,642 | 42.1 | -6.0 | ||
| Liberal Democrats | 388 | 10.1 | -6.6 | ||
| Majority | 218 | 5.7 | |||
| Turnout | 3,854 | 34.0 | |||
| Conservative gain from Labour | Swing | ||||
| Party | Candidate | Votes | % | ± | |
|---|---|---|---|---|---|
| Labour | 1,399 | 50.6 | -4.8 | ||
| Conservative | 1,106 | 40.1 | +12.4 | ||
| Liberal Democrats | 166 | 6.0 | -11.0 | ||
| Natural Law | 95 | 3.4 | +3.4 | ||
| Majority | 293 | 10.5 | |||
| Turnout | 2,766 | 24.9 | |||
| Labour hold | Swing | ||||
| Party | Candidate | Votes | % | ± | |
|---|---|---|---|---|---|
| Conservative | 1,293 | 51.7 | +11.3 | ||
| Labour | 941 | 37.6 | -5.5 | ||
| Liberal Democrats | 240 | 9.6 | -6.9 | ||
| Natural Law | 27 | 1.1 | +1.1 | ||
| Majority | 352 | 14.1 | |||
| Turnout | 2,501 | 27.9 | |||
| Conservative gain from Labour | Swing | ||||
| Party | Candidate | Votes | % | ± | |
|---|---|---|---|---|---|
| Conservative | 1,590 | 60.3 | +5.1 | ||
| Liberal Democrats | 808 | 30.7 | +3.6 | ||
| Labour | 237 | 9.0 | -8.7 | ||
| Majority | 782 | 29.6 | |||
| Turnout | 2,635 | 32.7 | |||
| Conservative hold | Swing | ||||
| Party | Candidate | Votes | % | ± | |
|---|---|---|---|---|---|
| Labour | 1,434 | 65.6 | +5.1 | ||
| Conservative | 482 | 22.0 | -1.6 | ||
| Liberal Democrats | 270 | 12.4 | +0.3 | ||
| Majority | 952 | 43.6 | |||
| Turnout | 2,186 | 23.5 | |||
| Labour hold | Swing | ||||
2001-2005
| Party | Candidate | Votes | % | ± | |
|---|---|---|---|---|---|
| Labour | 1,445 | 41.3 | +3.9 | ||
| Liberal Democrats | 1,113 | 31.8 | -0.2 | ||
| Conservative | 912 | 26.1 | -4.5 | ||
| Independent | 25 | 0.7 | +0.7 | ||
| Majority | 332 | 9.5 | |||
| Turnout | 3,495 | 34.7 | |||
| Labour hold | Swing | ||||
| Party | Candidate | Votes | % | ± | |
|---|---|---|---|---|---|
| Liberal Democrats | Audrey Oaten | 1,413 | 51.0 | +35.1 | |
| Labour | Geoffrey O'Connell | 817 | 29.5 | -14.6 | |
| Conservative | Richard Southern | 472 | 17.0 | -15.8 | |
| Green | Ian West | 70 | 2.5 | -0.7 | |
| Majority | 596 | 21.5 | |||
| Turnout | 2,772 | 27.7 | |||
| Liberal Democrats gain from Labour | Swing | ||||
| Party | Candidate | Votes | % | ± | |
|---|---|---|---|---|---|
| Conservative | 1,246 | 48.8 | +11.5 | ||
| Labour | 933 | 36.6 | -8.5 | ||
| Liberal Democrats | 372 | 14.6 | -3.0 | ||
| Majority | 313 | 12.2 | |||
| Turnout | 2,551 | 26.8 | |||
| Conservative gain from Labour | Swing | ||||
| Party | Candidate | Votes | % | ± | |
|---|---|---|---|---|---|
| Conservative | 1,851 | 59.9 | +8.8 | ||
| Liberal Democrats | 625 | 20.2 | +2.3 | ||
| Labour | 614 | 19.9 | -5.6 | ||
| Majority | 1,226 | 39.7 | |||
| Turnout | 3,090 | 30.2 | |||
| Conservative hold | Swing | ||||
| Party | Candidate | Votes | % | ± | |
|---|---|---|---|---|---|
| Conservative | 1,064 | 52.5 | +11.4 | ||
| Labour | 559 | 27.6 | -5.6 | ||
| Liberal Democrats | 403 | 19.9 | -5.8 | ||
| Majority | 505 | 24.9 | |||
| Turnout | 2,026 | 21.8 | |||
| Conservative hold | Swing | ||||
2005-2009
| Party | Candidate | Votes | % | ± | |
|---|---|---|---|---|---|
| Labour | John Lloyd | 1,144 | 45.5 | -5.5 | |
| Liberal Democrats | Elisabeth Knight | 994 | 39.6 | +18.8 | |
| Conservative | Ralph Dimelow | 374 | 14.9 | -13.3 | |
| Majority | 150 | 5.9 | |||
| Turnout | 2,512 | 28.1 | |||
| Labour hold | Swing | ||||
| Party | Candidate | Votes | % | ± | |
|---|---|---|---|---|---|
| Conservative | Richard Thake | 1,759 | 69.7 | +14.4 | |
| Labour | Joseph McWalter | 322 | 12.7 | -5.6 | |
| Liberal Democrats | Debra Wilkins | 310 | 12.3 | -7.0 | |
| Green | Stuart Madgin | 133 | 5.2 | -1.8 | |
| Majority | 1,437 | 57.0 | |||
| Turnout | 2,524 | 23.0 | |||
| Conservative hold | Swing | ||||
| Party | Candidate | Votes | % | ± | |
|---|---|---|---|---|---|
| Conservative | Teresa Heritage | 2,161 | 66.6 | +10.4 | |
| Liberal Democrats | Alison Steer | 819 | 25.3 | -0.4 | |
| Labour | Linda Spiri | 153 | 4.7 | -7.2 | |
| Green | Annette Tate | 110 | 3.4 | -2.8 | |
| Majority | 1,342 | 41.3 | |||
| Turnout | 3,243 | 30.2 | |||
| Conservative hold | Swing | ||||
| Party | Candidate | Votes | % | ± | |
|---|---|---|---|---|---|
| Labour | Sharon Taylor | 1,452 | 56.5 | +1.0 | |
| Conservative | Leslie Clark | 625 | 24.3 | -0.6 | |
| Liberal Democrats | Len Lambert | 329 | 12.8 | -6.8 | |
| UKIP | Rick Seddon | 165 | 6.4 | +6.4 | |
| Majority | 827 | 32.2 | |||
| Turnout | 2,571 | 29.0 | |||
| Labour hold | Swing | ||||
2009-2013
| Party | Candidate | Votes | % | ± | |
|---|---|---|---|---|---|
| Conservative | Alan Plancey | 982 | 44.5 | +5.5 | |
| Labour | Leon Reefe | 928 | 42.1 | +13.2 | |
| Liberal Democrats | Robert Gamble | 170 | 7.7 | -4.6 | |
| Independent | Frank Ward | 125 | 5.7 | -0.1 | |
| Majority | 54 | 2.4 | |||
| Turnout | 2,205 | 18.5 | |||
| Conservative hold | Swing | ||||
| Party | Candidate | Votes | % | ± | |
|---|---|---|---|---|---|
| Liberal Democrats | Martin Frearson | 1,482 | 42.1 | +2.6 | |
| Conservative | Salih Gaygusuz | 1,250 | 35.5 | +4.1 | |
| Labour | Iain Grant | 540 | 15.3 | -0.1 | |
| Green | Kate Metcalf | 249 | 7.1 | -6.7 | |
| Majority | 232 | 6.6 | |||
| Turnout | 3,521 | 33.1 | |||
| Liberal Democrats hold | Swing | ||||
| Party | Candidate | Votes | % | ± | |
|---|---|---|---|---|---|
| Conservative | Colin Bernard Woodward | 2,483 | 52.7% | +7.6% | |
| Liberal Democrats | Robert Ian Taylor | 1,256 | 26.6% | +0.6% | |
| Labour | Alexander Julian Young | 977 | 20.7% | +10.5% | |
| Majority | 1,227 | ||||
| Turnout | 4,716 | ||||
| Conservative hold | Swing | ||||
At the preceding election there had also been candidates for the British National Party (307 votes, 8.0%) and for the Green Party (392 votes, 10.3%).
| Party | Candidate | Votes | % | ± | |
|---|---|---|---|---|---|
| Conservative | Dee Hart | 1,389 | 56.44 | +14.54 | |
| Labour | Malcolm Aitken | 837 | 34.01 | +6.91 | |
| UKIP | Albert Nicholas | 159 | 6.46 | +6.46 | |
| Liberal Democrats | Peter Huse | 76 | 3.09 | -10.51 | |
| Majority | 552 | 22.43 | |||
| Turnout | 2,461 | 22.88 | |||
| Conservative hold | Swing | ||||
| Party | Candidate | Votes | % | ± | |
|---|---|---|---|---|---|
| Liberal Democrats | Kareen Mary Hastrick | 1231 | 40.2 | -3.3% | |
| Labour | Diana Mary Ivory | 791 | 25.8 | +13.1% | |
| Conservative | Richard Lloyd Vaughan Southern | 534 | 17.4 | -10.2% | |
| UKIP | Nicholas Richard Lincoln | 351 | 11.5 | n/a | |
| Green | Paula Mary Evelyn Broadhurst | 154 | 5.0 | -2.5% | |
| Majority | 440 | 12.6% | |||
| Turnout | 3061 | 33.5 | |||
| Liberal Democrats hold | Swing | ||||
Election caused by the resignation of previous incumbent.
| Party | Candidate | Votes | % | ± | |
|---|---|---|---|---|---|
| Conservative | William Wyatt-Lowe | 1413 | 47.8 | -3.0 | |
| Labour | Mike Bromberg | 693 | 23.5 | +8.8 | |
| Liberal Democrats | Chris Angell | 456 | 15.4 | -5.8 | |
| Green | Paul Harris | 180 | 6.1 | -7.2 | |
| UKIP | Howard Koch | 151 | 5.1 | +5.1 | |
| Independent | Rodney Tucker | 61 | 2.1 | +2.1 | |
| Majority | 720 | ||||
| Turnout | 23.8 | ||||
| Conservative hold | Swing | ||||
Election caused by the resignation of previous incumbent.[23] Percentage change is since June 2009.
2013-2017
| Party | Candidate | Votes | % | ± | |
|---|---|---|---|---|---|
| Labour Co-op | Judi Candida BILLING | 1250 | 47.8 | +1.8 | |
| Conservative | Alan MILLARD | 673 | 25.7 | -7.0 | |
| Liberal Democrats | Lisa Victoria COURTS | 246 | 9.4 | +2.8 | |
| UKIP | John Finbarr BARRY | 235 | 9.0 | +9.0 | |
| Green | Gavin NICHOLSON | 212 | 8.1 | -6.6 | |
| Majority | 577 | ||||
| Turnout | 2621 | 22.42 | |||
| Labour Co-op hold | Swing | ||||
Caused by the death of the previous incumbent.
2017-2021
Council leader and Conservative councillor Robert Gordon CBE (Goffs Oak and Bury Green) died in October 2017.[26] The seat was held for the Conservatives by Lesley Greensmith in the by-election on 22 February 2018.[27]
Liberal Democrat councillor Charlotte Hogg (St Albans North) resigned from the council in March 2018.[28] A by-election was held on 3 May, where Roma Mills from the Labour Party captured the seat from the Liberal Democrats.[27]
References
- "Your County Councillors". Hertfordshire. Archived from the original on 2009-07-24. Retrieved 2009-10-23.
- "Hertfordshire". BBC News Online. 19 April 2009. Retrieved 2009-10-23.
- "Council compositions by year". Elections Centre.
- "The County of Hertfordshire (Electoral Arrangements) Order 1980". legislation.gov.uk. 9 November 1980. Retrieved 17 May 2019.
- "Local Election 2001". BBC News.
- "The County of Hertfordshire (Electoral Changes) Order 2000". legislation.gov.uk. 11 September 2000. Retrieved 17 May 2019.
- "Local election results: Hertfordshire". BBC News.
- "Elections 2009". BBC News.
- "Local elections 2013". BBC News.
- "Hertfordshire County Council". BBC News.
- "The Hertfordshire (Electoral Changes) Order 2015". legislation.gov.uk. 11 September 2015. Retrieved 17 May 2019.
- "Election Results - County By-election 28 November 2002". Watford Borough Council. Archived from the original on 16 July 2011. Retrieved 2009-10-23.
- "Labour and lucky Tories make council gains". guardian.co.uk. London. 2005-09-16. Retrieved 2009-10-23.
- "Result of poll" (PDF). North Hertfordshire District Council. Archived from the original (PDF) on 2008-12-05. Retrieved 2009-10-23.
- "Election Results - Bedwell Division and Pin Green Ward". Stevenage Borough Council. Archived from the original on 2008-09-07. Retrieved 2009-10-23.
- "Tory victory in by-elections". This Is Local London. 2009-10-23. Retrieved 2009-10-23.
- "Liberal Democrats retain both seats in by election". St Albans & Harpenden Review. 2010-06-04. Retrieved 2010-06-04.
- "Archived copy". Archived from the original on 2012-04-01. Retrieved 2012-03-23.CS1 maint: archived copy as title (link)
- "Archived copy". Archived from the original on 2012-08-01. Retrieved 2012-03-23.CS1 maint: archived copy as title (link)
- "Archived copy". Archived from the original on 2012-08-01. Retrieved 2012-05-18.CS1 maint: archived copy as title (link)
- http://www.watfordobserver.co.uk/news/9689716.County_by_election__Lib_Dems_retain_Tudor_and_Meriden/
- http://www.dacorum.gov.uk/pdf/declaration%20results%20HCC.pdf%5B%5D
- http://www.hemeltoday.co.uk/news/local/by-elections-date-is-set-after-former-mayor-s-shock-porn-arrest-1-3853800
- http://www.north-herts.gov.uk/hitchin_north_declaration_of_result_of_poll.pdf%5B%5D
- "Archived copy". Archived from the original on 2013-12-17. Retrieved 2013-09-14.CS1 maint: archived copy as title (link)
- "Death of Robert Gordon". Retrieved 2018-04-10.
- "County Council elections". Retrieved 2018-04-10.
- Whieldon, Fraser. "St Albans North councillor Charlotte Hogg resigns". Herts Advertiser. Retrieved 2018-04-10.
External links
| Boroughs or districts |
|
|---|---|
| Major settlements |
|
| Topics |
|