2018 Stevenage Borough Council election
Elections to Stevenage Borough Council took place on 3 May 2018. This was on the same day as other local elections across the United Kingdom. One third of the council was up for election; the seats which were last contested in 2014. The Labour Party retained control of the council, which it had held continuously since 1973.
| |||||||||||||||||||||||||||||||||
13 of the 39 seats to Stevenage Borough Council 20 seats needed for a majority | |||||||||||||||||||||||||||||||||
|---|---|---|---|---|---|---|---|---|---|---|---|---|---|---|---|---|---|---|---|---|---|---|---|---|---|---|---|---|---|---|---|---|---|
| |||||||||||||||||||||||||||||||||
 Map showing the results of contested wards in the 2018 Stevenage Borough Council elections. Labour in red, Conservatives in blue and Liberal Democrats in yellow. | |||||||||||||||||||||||||||||||||
| |||||||||||||||||||||||||||||||||
Result Summary
| Party | Seats | Gains | Losses | Net gain/loss | Seats % | Votes % | Votes | +/− | ||
|---|---|---|---|---|---|---|---|---|---|---|
| Labour | 26 | 0 | 3 | 44.2 | 10,035 | |||||
| Conservative | 9 | 2 | 0 | 37.8 | 8,583 | |||||
| Liberal Democrats | 4 | 1 | 0 | 14.9 | 3,387 | |||||
| Green | 0 | 0 | 0 | 3.1 | 715 | |||||
| Total | 40 | 22,720 | ||||||||
| Labour hold | ||||||||||
Ward Results
Bandley Hill
Location of Bandley Hill ward
| Party | Candidate | Votes | % | ± | |
|---|---|---|---|---|---|
| Labour | Joan Lloyd | 772 | 47.4 | -2.2 | |
| Conservative | Nicholas Foster | 715 | 43.9 | +5.7 | |
| Liberal Democrats | Andrew Anderson | 143 | 8.8 | +2.6 | |
| Majority | 57 | 3.5 | |||
| Turnout | 1,630 | 32.01 | |||
| Labour hold | Swing | ||||
Bedwell

Location of Bedwell ward
| Party | Candidate | Votes | % | ± | |
|---|---|---|---|---|---|
| Labour | Lizzy Kelly | 1,001 | 60.4 | +4.6 | |
| Conservative | Michelle Frith | 506 | 30.5 | +5.2 | |
| Green | Victoria Snelling | 151 | 9.1 | +0.1 | |
| Majority | 495 | 29.9 | |||
| Turnout | 1,658 | 31.35 | |||
| Labour hold | Swing | ||||
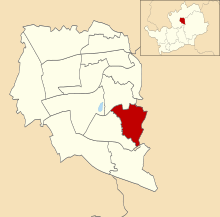
Chells

Location of Chells ward
| Party | Candidate | Votes | % | ± | |
|---|---|---|---|---|---|
| Liberal Democrats | Tom Wren | 796 | 46.3 | +16.4 | |
| Labour | Pam Stuart | 562 | 32.7 | -3.2 | |
| Conservative | Matthew Wyatt | 360 | 21.0 | -4.4 | |
| Majority | 234 | 13.6 | |||
| Turnout | 1,718 | 34.65 | |||
| Liberal Democrats gain from Labour | Swing | ||||
Longmeadow
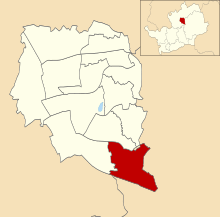
Location of Longmeadow ward
| Party | Candidate | Votes | % | ± | |
|---|---|---|---|---|---|
| Conservative | Doug Bainbridge | 789 | 48.1 | +7.3 | |
| Labour | David Wood | 665 | 40.6 | +0.2 | |
| Liberal Democrats | Stephen Booth | 185 | 11.3 | +2.9 | |
| Majority | 124 | 7.5 | |||
| Turnout | 1,639 | 36.31 | |||
| Conservative gain from Labour | Swing | ||||
Manor

Location of Manor ward
| Party | Candidate | Votes | % | ± | |
|---|---|---|---|---|---|
| Liberal Democrats | Andy McGuinness | 1,196 | 60.8 | +1.8 | |
| Conservative | Matthew Clarke | 400 | 20.3 | +0.3 | |
| Labour | David Martin | 370 | 18.8 | +1.8 | |
| Majority | 796 | 40.5 | |||
| Turnout | 1,966 | 39.27 | |||
| Liberal Democrats hold | Swing | ||||
Martins Wood

Location of Martins Wood ward
| Party | Candidate | Votes | % | ± | |
|---|---|---|---|---|---|
| Labour | Lloyd Briscoe | 639 | 41.5 | -7.1 | |
| Conservative | Joseph Barnes | 518 | 33.7 | -2.5 | |
| Liberal Democrats | Jill Brinkworth | 382 | 24.8 | +19.4 | |
| Majority | 121 | 7.8 | |||
| Turnout | 1,539 | 33.48 | |||
| Labour hold | Swing | ||||
Old Town

Location of Old Town ward
| Party | Candidate | Votes | % | ± | |
|---|---|---|---|---|---|
| Conservative | Jody Hanafin | 1,012 | 42.8 | +9.9 | |
| Labour | Monika Cherney-Craw | 1,010 | 42.7 | -0.1 | |
| Green | Elizabeth Sturges | 194 | 8.2 | +1.9 | |
| Liberal Democrats | Mason Humberstone | 149 | 6.3 | +2.0 | |
| Majority | 2 | 0.1 | |||
| Turnout | 2,365 | 37.65 | |||
| Conservative gain from Labour | Swing | ||||
Pin Green

Location of Pin Green ward
| Party | Candidate | Votes | % | ± | |
|---|---|---|---|---|---|
| Labour | Lin Martin-Haugh | 811 | 51.5 | +1.6 | |
| Conservative | Charlie Laing | 579 | 36.8 | +5.5 | |
| Green | Vicky Lovelace | 184 | 11.7 | +3.2 | |
| Majority | 232 | 14.7 | |||
| Turnout | 1,574 | 32.89 | |||
| Labour hold | Swing | ||||
Roebuck

Location of Roebuck ward
| Party | Candidate | Votes | % | ± | |
|---|---|---|---|---|---|
| Labour | Sarah-Jane Potter | 842 | 48.1 | +4.7 | |
| Conservative | Alex Farquharson | 706 | 40.3 | +11.7 | |
| Liberal Democrats | Nigel Bye | 113 | 6.5 | +1.8 | |
| Green | Martin Malocco | 90 | 5.1 | -0.1 | |
| Majority | 136 | 7.8 | |||
| Turnout | 1,751 | 34.23 | |||
| Labour hold | Swing | ||||
Shephall
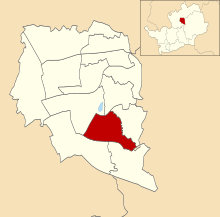
Location of Shephall ward
| Party | Candidate | Votes | % | ± | |
|---|---|---|---|---|---|
| Labour | Rob Broom | 727 | 53.4 | +0.3 | |
| Conservative | Michael Hearn | 482 | 35.4 | +6.8 | |
| Green | Michael Malocco | 84 | 6.2 | -3.8 | |
| Liberal Democrats | Paul Barber | 68 | 5.0 | N/A | |
| Majority | 245 | 18.0 | |||
| Turnout | 1,361 | 29.79 | |||
| Labour hold | Swing | ||||
St Nicholas

Location of St Nicholas ward
| Party | Candidate | Votes | % | ± | |
|---|---|---|---|---|---|
| Labour | Sandra Barr | 951 | 51.9 | +0.7 | |
| Conservative | Amanda Tandi | 690 | 37.6 | +5.4 | |
| Green | Naomi Collins | 96 | 5.2 | N/A | |
| Liberal Democrats | Matthew Snell | 96 | 5.2 | -3.6 | |
| Majority | 261 | 14.3 | |||
| Turnout | 1,833 | 34.87 | |||
| Labour hold | Swing | ||||
Symonds Green
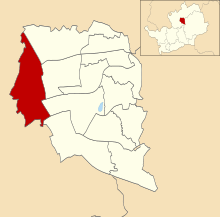
Location of Symonds Green ward
| Party | Candidate | Votes | % | ± | |
|---|---|---|---|---|---|
| Labour | Sharon Taylor | 847 | 52.3 | +6.0 | |
| Conservative | Alex Young | 602 | 37.2 | +8.3 | |
| Liberal Democrats | Clive Hearmon | 89 | 5.5 | +1.1 | |
| Green | Richard Warr | 81 | 5.0 | +1.4 | |
| Majority | 245 | 15.1 | |||
| Turnout | 1,619 | 36.36 | |||
| Labour hold | Swing | ||||
Woodfield

Location of Woodfield ward
| Party | Candidate | Votes | % | ± | |
|---|---|---|---|---|---|
| Conservative | Phil Bibby | 835 | 53.9 | +8.3 | |
| Labour | Irfan Javed | 543 | 35.1 | +4.6 | |
| Liberal Democrats | Neil Brinkworth | 170 | 11.0 | +5.9 | |
| Majority | 292 | 18.8 | |||
| Turnout | 1,548 | 36.37 | |||
| Labour hold | Swing | ||||
References
- Noel Dempsey (14 May 2018). "Local Elections 2018" (PDF). House of Commons Library. p. 21.
- "Stevenage Borough Council". BBC News. 3 May 2018. Archived from the original on 5 May 2018.
- https://www.bbc.co.uk/news/topics/cz3nm49dx89t/stevenage-borough-council
This article is issued from Wikipedia. The text is licensed under Creative Commons - Attribution - Sharealike. Additional terms may apply for the media files.