2001 Polish parliamentary election
The 2001 Polish parliamentary election was held on 23 September 2001 to elect deputies to both houses of the National Assembly.[1] The election concluded with an overwhelming victory for the centre-left Democratic Left Alliance – Labor Union, the electoral coalition between the Democratic Left Alliance (SLD) and the Labour Union (UP), which captured 41% of the vote in the crucial lower house Sejm. The 2001 election is recognized as marking the emergence of both Civic Platform (PO) and Law and Justice (PiS) as players in Polish politics, while also witnessing the outright collapse of the Solidarity Electoral Action (AWS) and its former coalition partner, the Freedom Union (UW).
| |||||||||||||||||||||||||||||||||||||||||||||||||||||||||||||||||||||||||||||||||||||||||||||
All 460 seats in the Sejm 231 seats were needed for a majority in the Sejm All 100 seats in the Senate | |||||||||||||||||||||||||||||||||||||||||||||||||||||||||||||||||||||||||||||||||||||||||||||
|---|---|---|---|---|---|---|---|---|---|---|---|---|---|---|---|---|---|---|---|---|---|---|---|---|---|---|---|---|---|---|---|---|---|---|---|---|---|---|---|---|---|---|---|---|---|---|---|---|---|---|---|---|---|---|---|---|---|---|---|---|---|---|---|---|---|---|---|---|---|---|---|---|---|---|---|---|---|---|---|---|---|---|---|---|---|---|---|---|---|---|---|---|---|
| Turnout | 46.29% | ||||||||||||||||||||||||||||||||||||||||||||||||||||||||||||||||||||||||||||||||||||||||||||
| |||||||||||||||||||||||||||||||||||||||||||||||||||||||||||||||||||||||||||||||||||||||||||||
 Seats won by Sejm District | |||||||||||||||||||||||||||||||||||||||||||||||||||||||||||||||||||||||||||||||||||||||||||||
| |||||||||||||||||||||||||||||||||||||||||||||||||||||||||||||||||||||||||||||||||||||||||||||


_(cropped).jpg)


Voter turnout for the 2001 election was 46.29%[2] For this election only, list seats were allocated using the Sainte-Laguë method instead of the D'Hondt method.
Background
At the end of its four-year term, the ruling AWS government of Prime Minister Jerzy Buzek faced bleak prospects for the September parliamentary election. In the previous presidential election in 2000, the SLD's Aleksander Kwaśniewski achieved a landslide reelection over AWS candidate Marian Krzaklewski. Economically, Polish consumer confidence dropped to its lowest since the mid-1990s, with unemployment rising above 16%.[3] Politically, the Buzek government faced a series of crises undermining its credibility. In May 2000, the AWS' junior coalition partner, the Freedom Union, walked out of the government regarding the party's objections to the slow pace of reform, forcing Buzek to set up a relatively weak minority government in its place.[4] Later in July 2001, Buzek's government was again hit by three further ministerial resignations over corruption charges, while the government's reform program for pensions and health care grounded to a halt in the Sejm.[3]
In light of Buzek's besieged administration, opposition parties took advantage of AWS' organisational and economic weaknesses. From the centre left, a political coalition between the Democratic Left Alliance (SLD) and the Labour Union (UP), headed by Leszek Miller, appeared as the ruling government's most formidable, united and vocal opposition. On the centre right, Solidarity's traditional spectrum of support increasingly became divided by the emergence of new political groups. Civic Platform (PO), composed of former AWS and UW members, repeated calls for a low flat-rate income tax and a culling of bureaucracy to attract investment.[3] Further down the right, the Law and Justice party (PiS), composed of AWS' more conservative and anti-communist adherents, campaigned on promises of tough anti-corruption and organised crime legislation.[3]
The campaign leading up to the September election was marred by voter apathy due to the summer holidays, and was also marginalized by the September 11 attacks in the United States.[5]
Opinion polls
Results
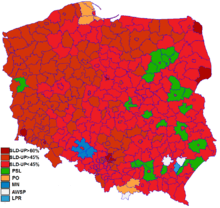
■ – Democratic Left Alliance
■ – Polish People's Party
■ – Civic Platform
■ – Solidarity Electoral Action
■ – League of Polish Families
■ – German Minority
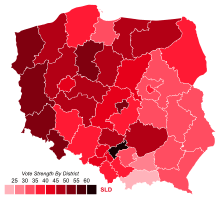
The SLD triumphed in the final tally, receiving 41% percent of the vote, though shy of an outright parliamentary majority in the Sejm.[6] The party increased its representation by 52 seats, earning it 216 representatives, and returned to the Chancellery after a four-year period of sitting in opposition. Partly due to the fractious nature of its opponents, the SLD secured pluralities in all of Poland's voivodeships as well as in an overwhelming majority of the nation's powiats. On the centre right, Civic Platform entered parliament for the first time, coming in second place with nearly 13% of the vote.[6] The party stood relatively strong in Pomeranian Voivodeship.
Surprisingly, ultra-nationalist parties performed well in the election's final results. The left-wing nationalist Self-Defence of the Republic of Poland (SRP) increased its vote 100-fold from the 1997 election, securing 53 seats and 10% of the vote, coming in third place. Headed by populist Andrzej Lepper, the party campaigned against Warsaw excess and Poland's ongoing negotiations to enter the European Union.[7] On the far right, the League of Polish Families, which campaigned on a staunchly Catholic and anti-EU platform, also entered the Sejm for the first time, gaining 38 seats and 8% of the vote.[7]
Law and Justice (PiS), headed by Lech Kaczyński, a former Minister of Justice in the Buzek government, scored 44 seats and 9.5% of the vote, also securing his party's entrance into the Sejm for the first time. The Polish People's Party (PSL) won 42 seats, slightly reversing the party's devastating losses from 1997. The PSL would later enter into coalition with the SLD to achieve a parliamentary majority.
The election proved catastrophic for Solidarity Electoral Action and its former Freedom Union coalition partner. Both parties failed to secure the 8% for coalitions and 5% for standalone parties threshold to enter the Sejm, with AWS and UW falling to 5.6% and 3.1%, respectively.[6] In the election's aftermath, Prime Minister Buzek tendered his resignation. Both the AWS and UW faced political extinction following the election's aftermath. The AWS dissolved itself by the end of 2001; the UW lingered until its own dissolution in 2005.
Sejm
| Party | Votes | % | Seats | +/– |
|---|---|---|---|---|
| Democratic Left Alliance – Labor Union | 5,342,519 | 41.0 | 216 | +52 |
| Civic Platform | 1,651,099 | 12.7 | 65 | New |
| Self-Defence of the Republic of Poland | 1,327,624 | 10.2 | 53 | +53 |
| Law and Justice | 1,236,787 | 9.5 | 44 | New |
| Polish People's Party | 1,168,659 | 9.0 | 42 | +15 |
| League of Polish Families | 1,025,148 | 7.9 | 38 | New |
| Solidarity Electoral Action | 729,207 | 5.6 | 0 | –201 |
| Freedom Union | 404,074 | 3.1 | 0 | –60 |
| Social Alternative Movement | 54,266 | 0.4 | 0 | New |
| German Minority | 47,230 | 0.4 | 2 | 0 |
| Polish Socialist Party | 13,459 | 0.1 | 0 | New |
| German Minority Upper Silesia | 8,024 | 0.1 | 0 | 0 |
| Polish Economic Union | 7,189 | 0.1 | 0 | New |
| Polska Wspólnota Narodowa | 2,644 | 0.0 | 0 | New |
| Invalid/blank votes | 541,483 | – | – | – |
| Total | 13,559,412 | 100 | 460 | 0 |
| Registered voters/turnout | 29,364,455 | 46.3 | – | – |
| Source: Nohlen & Stöver | ||||
Results in each constituency
| Constituency | Turnout | SLD | PO | SRP | PiS | PSL | LPR | AWSP | UW | MN | Others | Lead |
|---|---|---|---|---|---|---|---|---|---|---|---|---|
| 1 – Legnica | 43.50 | 53.69 | 10.50 | 9.42 | 7.03 | 5.81 | 5.89 | 4.07 | 3.19 | - | 0.40 | 43.19 |
| 2 – Wałbrzych | 43.89 | 52.68 | 11.74 | 10.91 | 4.67 | 5.48 | 6.48 | 4.24 | 3.27 | - | 0.55 | 40.94 |
| 3 – Wrocław | 46.92 | 39.15 | 17.83 | 9.51 | 10.26 | 4.74 | 7.86 | 5.21 | 5.00 | - | 0.45 | 21.32 |
| 4 – Bydgoszcz | 46.53 | 50.37 | 8.97 | 9.57 | 7.38 | 7.85 | 8.16 | 4.97 | 2.27 | - | 0.46 | 40.80 |
| 5 – Toruń | 42.68 | 47.36 | 9.59 | 12.05 | 6.98 | 8.86 | 7.61 | 4.23 | 2.64 | - | 0.67 | 35.31 |
| 6 – Lublin | 48.09 | 34.27 | 8.48 | 13.31 | 9.42 | 17.27 | 9.91 | 4.50 | 2.18 | - | 0.66 | 17.00 |
| 7 – Chełm | 46.65 | 34.58 | 5.91 | 15.86 | 5.23 | 21.38 | 11.30 | 3.85 | 1.49 | - | 0.40 | 13.20 |
| 8 – Zielona Góra | 42.58 | 51.54 | 9.81 | 9.60 | 5.66 | 7.49 | 5.44 | 5.99 | 3.36 | - | 1.10 | 41.73 |
| 9 – Łódź | 48.54 | 52.19 | 12.10 | 6.69 | 9.88 | 2.35 | 7.34 | 5.70 | 3.22 | - | 0.52 | 40.09 |
| 10 – Piotrków Trybunalski | 44.73 | 39.70 | 8.33 | 15.90 | 6.32 | 14.91 | 7.49 | 4.80 | 1.63 | - | 0.93 | 23.80 |
| 11 – Sieradz | 46.17 | 41.05 | 7.84 | 17.76 | 5.77 | 13.87 | 7.51 | 3.85 | 1.59 | - | 0.75 | 23.29 |
| 12 – Chrzanów | 48.27 | 35.24 | 14.09 | 8.38 | 9.87 | 9.30 | 11.54 | 8.16 | 2.84 | - | 0.57 | 21.15 |
| 13 – Kraków | 50.50 | 33.67 | 18.15 | 6.89 | 16.03 | 5.11 | 9.66 | 4.39 | 5.84 | - | 0.25 | 15.52 |
| 14 – Nowy Sącz | 47.95 | 23.32 | 19.13 | 7.98 | 11.68 | 10.86 | 11.44 | 12.80 | 2.04 | - | 0.75 | 4.19 |
| 15 – Tarnów | 46.59 | 25.56 | 13.77 | 10.05 | 9.77 | 17.40 | 13.02 | 7.87 | 2.22 | - | 0.33 | 8.16 |
| 16 – Płock | 42.11 | 41.21 | 7.70 | 13.04 | 7.48 | 17.04 | 5.67 | 5.27 | 1.98 | - | 0.61 | 24.17 |
| 17 – Radom | 43.66 | 34.38 | 10.64 | 13.54 | 8.00 | 18.10 | 7.71 | 5.47 | 1.59 | - | 0.58 | 16.28 |
| 18 – Siedlce | 45.65 | 30.06 | 7.60 | 14.19 | 8.42 | 22.95 | 9.67 | 4.94 | 1.60 | - | 0.56 | 7.11 |
| 19 – Warsaw I | 56.11 | 36.77 | 18.87 | 3.05 | 21.57 | 1.62 | 7.12 | 4.02 | 6.58 | - | 0.40 | 15.20 |
| 20 – Warsaw II | 45.15 | 30.76 | 16.05 | 8.26 | 18.12 | 8.95 | 9.38 | 4.90 | 3.15 | - | 0.45 | 12.64 |
| 21 – Opole | 39.83 | 38.84 | 11.97 | 11.01 | 5.33 | 5.08 | 6.62 | 3.66 | 3.09 | 13.62 | 0.78 | 25.22 |
| 22 – Krosno | 47.28 | 31.62 | 7.02 | 12.27 | 8.79 | 15.90 | 11.89 | 10.29 | 1.75 | - | 0.48 | 15.72 |
| 23 – Rzeszów | 49.14 | 31.19 | 8.86 | 10.14 | 8.41 | 13.78 | 15.78 | 9.90 | 1.36 | - | 0.58 | 15.41 |
| 24 – Białystok | 44.79 | 37.91 | 8.42 | 12.04 | 11.51 | 10.96 | 11.79 | 4.89 | 1.87 | - | 0.61 | 25.87 |
| 25 – Gdańsk | 47.56 | 34.58 | 25.82 | 6.38 | 15.95 | 3.39 | 5.90 | 4.91 | 2.83 | - | 0.23 | 8.76 |
| 26 – Gdynia | 47.32 | 36.46 | 24.92 | 9.21 | 9.30 | 4.96 | 7.87 | 4.27 | 2.69 | - | 0.32 | 11.54 |
| 27 – Bielsko-Biała | 51.06 | 38.30 | 13.80 | 7.91 | 9.87 | 5.65 | 9.83 | 10.21 | 3.79 | - | 0.65 | 24.50 |
| 28 – Częstochowa | 46.84 | 47.03 | 11.70 | 10.61 | 7.89 | 7.14 | 5.48 | 6.99 | 2.37 | - | 0.79 | 35.33 |
| 29 – Gliwice | 39.26 | 44.39 | 13.62 | 6.09 | 9.81 | 3.01 | 5.48 | 8.44 | 5.33 | - | 3.84 | 30.77 |
| 30 – Rybnik | 42.88 | 40.16 | 18.04 | 7.10 | 9.61 | 4.15 | 5.97 | 7.55 | 4.23 | 2.09 | 1.08 | 22.12 |
| 31 – Katowice | 44.90 | 44.60 | 16.43 | 5.55 | 12.44 | 2.01 | - | 13.34 | 4.60 | - | 1.03 | 28.17 |
| 32 – Sosnowiec | 48.53 | 62.40 | 8.45 | 6.84 | 6.66 | 3.86 | 3.97 | 4.23 | 2.71 | - | 0.86 | 53.95 |
| 33 – Kielce | 44.17 | 45.08 | 7.16 | 12.81 | 6.73 | 15.07 | 6.24 | 3.68 | 1.80 | - | 1.41 | 30.01 |
| 34 – Elbląg | 42.03 | 47.89 | 10.35 | 12.71 | 6.36 | 9.06 | 6.69 | 2.72 | 3.86 | - | 0.35 | 35.18 |
| 35 – Olsztyn | 40.16 | 47.22 | 11.64 | 9.63 | 7.87 | 6.94 | 8.57 | 3.97 | 3.48 | - | 0.67 | 35.58 |
| 36 – Kalisz | 49.99 | 47.31 | 10.16 | 12.77 | 4.06 | 12.00 | 7.49 | 3.75 | 1.93 | - | 0.54 | 34.54 |
| 37 – Konin | 47.82 | 48.07 | 8.88 | 13.76 | 4.78 | 11.33 | 5.66 | 5.15 | 1.80 | - | 0.56 | 34.31 |
| 38 – Piła | 49.12 | 48.34 | 10.47 | 11.74 | 4.62 | 10.55 | 6.64 | 4.55 | 2.68 | - | 0.43 | 36.60 |
| 39 – Poznań | 52.27 | 41.99 | 20.29 | 5.08 | 12.81 | 2.98 | 7.22 | 4.26 | 4.97 | - | 0.49 | 21.70 |
| 40 – Koszalin | 43.75 | 47.16 | 10.15 | 22.77 | 3.73 | 4.11 | 4.45 | 4.06 | 3.01 | - | 0.56 | 24.39 |
| 41 – Szczecin | 43.40 | 50.58 | 12.56 | 10.24 | 8.28 | 3.75 | 5.77 | 4.24 | 4.26 | - | 0.32 | 38.02 |
| Poland | 46.29 | 41.04 | 12.68 | 10.20 | 9.50 | 8.98 | 7.87 | 5.60 | 3.10 | 0.36 | 0.66 | 28.36 |
Seat distribution in each constituency
| Constituency | SLD | PO | SRP | PiS | PSL | LPR | MN | Sum |
|---|---|---|---|---|---|---|---|---|
| 1 – Legnica | 7 | 1 | 1 | 1 | 1 | 1 | - | 12 |
| 2 – Wałbrzych | 6 | 1 | 1 | - | - | 1 | - | 9 |
| 3 – Wrocław | 6 | 3 | 1 | 2 | 1 | 1 | - | 14 |
| 4 – Bydgoszcz | 7 | 1 | 1 | 1 | 1 | 1 | - | 12 |
| 5 – Toruń | 7 | 1 | 2 | 1 | 1 | 1 | - | 13 |
| 6 – Lublin | 5 | 1 | 2 | 2 | 3 | 2 | - | 15 |
| 7 – Chełm | 5 | 1 | 2 | - | 3 | 1 | - | 12 |
| 8 – Zielona Góra | 7 | 1 | 1 | 1 | 1 | 1 | - | 12 |
| 9 – Łódź | 6 | 2 | 1 | 1 | - | 1 | - | 11 |
| 10 – Piotrków Trybunalski | 4 | 1 | 2 | - | 1 | 1 | - | 9 |
| 11 – Sieradz | 5 | 1 | 2 | 1 | 2 | 1 | - | 12 |
| 12 – Chrzanów | 3 | 1 | - | 1 | 1 | 1 | - | 7 |
| 13 – Kraków | 5 | 3 | 1 | 2 | 1 | 2 | - | 14 |
| 14 – Nowy Sącz | 3 | 2 | 1 | 1 | 1 | 1 | - | 9 |
| 15 – Tarnów | 2 | 1 | 1 | 1 | 2 | 1 | - | 8 |
| 16 – Płock | 5 | 1 | 1 | 1 | 2 | - | - | 10 |
| 17 – Radom | 3 | 1 | 1 | 1 | 2 | 1 | - | 9 |
| 18 – Siedlce | 4 | 1 | 2 | 1 | 3 | 1 | - | 12 |
| 19 – Warsaw I | 8 | 4 | - | 5 | - | 2 | - | 19 |
| 20 – Warsaw II | 3 | 2 | 1 | 2 | 1 | 1 | - | 10 |
| 21 – Opole | 5 | 2 | 2 | 1 | - | 1 | 2 | 13 |
| 22 – Krosno | 4 | 1 | 2 | 1 | 2 | 1 | - | 11 |
| 23 – Rzeszów | 5 | 2 | 2 | 1 | 2 | 3 | - | 15 |
| 24 – Białystok | 6 | 1 | 2 | 2 | 2 | 2 | - | 15 |
| 25 – Gdańsk | 5 | 3 | 1 | 2 | - | 1 | - | 12 |
| 26 – Gdynia | 6 | 4 | 1 | 1 | 1 | 1 | - | 14 |
| 27 – Bielsko-Biała | 4 | 2 | 1 | 1 | - | 1 | - | 9 |
| 28 – Częstochowa | 4 | 1 | 1 | 1 | - | - | - | 7 |
| 29 – Gliwice | 6 | 2 | 1 | 1 | - | - | - | 10 |
| 30 – Rybnik | 5 | 2 | 1 | 1 | - | - | - | 9 |
| 31 – Katowice | 7 | 3 | 1 | 2 | - | - | - | 13 |
| 32 – Sosnowiec | 7 | 1 | 1 | - | - | - | - | 9 |
| 33 – Kielce | 8 | 1 | 2 | 1 | 3 | 1 | - | 16 |
| 34 – Elbląg | 5 | 1 | 1 | - | 1 | - | - | 8 |
| 35 – Olsztyn | 5 | 1 | 1 | 1 | - | 1 | - | 9 |
| 36 – Kalisz | 6 | 1 | 2 | - | 2 | 1 | - | 12 |
| 37 – Konin | 5 | 1 | 2 | - | 1 | - | - | 9 |
| 38 – Piła | 5 | 1 | 1 | - | 1 | 1 | - | 9 |
| 39 – Poznań | 5 | 2 | - | 2 | - | 1 | - | 10 |
| 40 – Koszalin | 5 | 1 | 2 | - | - | - | - | 8 |
| 41 – Szczecin | 7 | 2 | 2 | 1 | - | 1 | - | 13 |
| Total | 216 | 65 | 53 | 44 | 42 | 38 | 2 | 460 |
Senate
| Party | Votes | % | Seats | +/– |
|---|---|---|---|---|
| Democratic Left Alliance – Labor Union | 10,476,677 | 38.7 | 75 | +47 |
| Senate 2001 | 6,582,224 | 24.3 | 15 | – |
| Polish People's Party | 3,631,234 | 13.5 | 4 | +1 |
| Self-Defence of the Republic of Poland | 1,158,887 | 4.3 | 2 | – |
| League of Polish Families | 1,097,058 | 4.1 | 2 | New |
| Real Politics Union | 469,815 | 1.7 | 0 | 0 |
| Local lists | 3,624,697 | 13.4 | 2 | –3 |
| Invalid/blank votes | 479,179 | – | – | – |
| Total | 13,590,426 | 100 | 100 | 0 |
| Registered voters/turnout | 29,364,455 | 46.3 | – | – |
| Source: Nohlen & Stöver | ||||
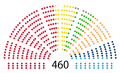 Distribution of seats in the Sejm
 Distribution of seats in the Senate
References
- Dieter Nohlen & Philip Stöver (2010) Elections in Europe: A data handbook, p1491 ISBN 978-3-8329-5609-7
- "Wybory do Sejmu: ogólne dane statystyczne". Wybory do Sejmu Rzeczypospolitej Polskiej i Senatu Rzeczypospolitej Polskiej, 23 września 2001. Państwowa Komisja Wyborcza. Retrieved 30 May 2012.
- "The end of Solidarity". The Economist. 16 August 2001. Retrieved 30 May 2012.
- "Poland sets up minority government". BBC News. 6 June 2000. Retrieved 30 May 2012.
- Szczerbiak, Aleks (1 September 2002). "Poland's Unexpected Political Earthquake: The September 2001 Parliamentary Election". Journal of Communist Studies and Transition Politics. 18 (3): 41–76. doi:10.1080/714003608.
- "Left victorious in Poland". BBC News. 24 September 2001. Retrieved 30 May 2012.
- "The left is back—in the centre". The Economist. 27 September 2001. Retrieved 30 May 2012.
- Obwieszczenie Państwowej Komisji Wyborczej z dn. 26 IX 1997 r., Monitor Polski. Nr 109, poz. 1186
- Obwieszczenie PKW z dn. 26 IX 2001 r., Dz.U. Nr 109, poz. 1187
| Presidential elections | |
|---|---|
| Legislative elections | |
| Local elections | |
| European elections | |
| Referendums | |
| |
| 1990–1995 Wałęsa Presidency |
|  |
|---|---|---|
| 1995–2005 Kwaśniewski Presidency |
| |
| 2005–2010 Kaczyński Presidency |
| |
| 2010–2015 Komorowski Presidency |
| |
| 2015-present Duda Presidency |
| |