1991 Polish parliamentary election
The 1991 Polish parliamentary election was held on 27 October 1991 to elect deputies to both houses of the National Assembly.[2] The 1991 election was notable on several counts. It was the first parliamentary election to be held since the formation of the Third Republic, the first entirely free and competitive legislative election since the fall of communism, the first completely free legislative election of any sort since 1928, and only the fifth completely free election in all of Polish history. Due to the collapse of the Solidarity movement's political wing, the 1991 election saw deep political fragmentation, with a multitude of new parties and alliances emerging in its wake.[3] Low voting thresholds within individual constituencies, along with a five percent national threshold allocated to a small portion of the Sejm, additionally contributed to party fragmentation.[4] As a result, 29 political parties gained entry into the Sejm and 22 in the Senate, with no party holding a decisive majority. Two months of intense coalition negotiations followed, with Jan Olszewski of the Centre Agreement forming a minority government along with the Christian National Union, remnants of the broader Center Civic Alliance, and the Peasants' Agreement, with conditional support from Polish People's Party, Solidarity and other minor parties.[5]
| |||||||||||||||||||||||||||||||||||||||||||||||||||||||||||||||||||||||||||||||||||||||||||||||||||||||||||||||||||||||||||||||||||||||||||||||||
All 460 seats in the Sejm 231 seats were needed for a majority in the Sejm All 100 seats in the Senate | |||||||||||||||||||||||||||||||||||||||||||||||||||||||||||||||||||||||||||||||||||||||||||||||||||||||||||||||||||||||||||||||||||||||||||||||||
|---|---|---|---|---|---|---|---|---|---|---|---|---|---|---|---|---|---|---|---|---|---|---|---|---|---|---|---|---|---|---|---|---|---|---|---|---|---|---|---|---|---|---|---|---|---|---|---|---|---|---|---|---|---|---|---|---|---|---|---|---|---|---|---|---|---|---|---|---|---|---|---|---|---|---|---|---|---|---|---|---|---|---|---|---|---|---|---|---|---|---|---|---|---|---|---|---|---|---|---|---|---|---|---|---|---|---|---|---|---|---|---|---|---|---|---|---|---|---|---|---|---|---|---|---|---|---|---|---|---|---|---|---|---|---|---|---|---|---|---|---|---|---|---|---|---|
| Turnout | 43.2% | ||||||||||||||||||||||||||||||||||||||||||||||||||||||||||||||||||||||||||||||||||||||||||||||||||||||||||||||||||||||||||||||||||||||||||||||||
| |||||||||||||||||||||||||||||||||||||||||||||||||||||||||||||||||||||||||||||||||||||||||||||||||||||||||||||||||||||||||||||||||||||||||||||||||
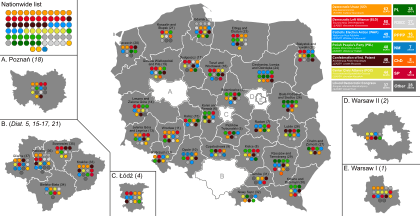 Seats won by Sejm District | |||||||||||||||||||||||||||||||||||||||||||||||||||||||||||||||||||||||||||||||||||||||||||||||||||||||||||||||||||||||||||||||||||||||||||||||||
| |||||||||||||||||||||||||||||||||||||||||||||||||||||||||||||||||||||||||||||||||||||||||||||||||||||||||||||||||||||||||||||||||||||||||||||||||
_Rueda_de_prensa_de_Felipe_Gonz%C3%A1lez_con_el_primer_ministro_de_Polonia._Pool_Moncloa._26_de_septiembre_de_1990_(cropped).jpeg)
.jpg)

.jpeg)

.jpg)
460 members of parliament (poseł) were elected; 391 from 6980 candidates from 37 regional lists of candidates and 69 from country-wide lists of candidates. In the Sejm elections, 27,517,280 citizens were eligible to vote, 11,887,949 (43.2%) of them cast their votes, 11,218,602 (94.4%) of those were counted as valid. In the Senate elections, 43.2% of citizens cast their votes, 96.5% were valid.
Elections were supervised by the National Electoral Commission (Państwowa Komisja Wyborcza). 37 regional (okręgowe) commissions were formed, and 22,341 district (obwodowe), staffed by 197,389 citizens.
A remarkable 111 parties competed and 29 parties (listed below) won Parliamentary seats. The success of the frivolous Polish Beer-Lovers' Party with 16 seats gained news coverage worldwide.
Results

■ – Democratic Union
■ – Democratic Left Alliance
■ – Polish People's Party
■ – Catholic Election Action
■ – Peasants' Agreement
■ – Civic Center Alliance
■ – Liberal Democratic Congress
■ – Confederation of Independent Poland
■ – Independent
■ – German Minority

| Party | Sejm | Senate | ||||
|---|---|---|---|---|---|---|
| Votes | % | Seats | Votes | % | Seats | |
| Democratic Union | 1,382,051 | 12.3 | 62 | 3,764,156 | 32.8 | 21 |
| Democratic Left Alliance | 1,344,820 | 12.0 | 60 | 2,431,178 | 21.2 | 4 |
| Catholic Election Action | 980,304 | 8.7 | 49 | 1,995,866 | 17.4 | 9 |
| Center Civic Alliance | 977,344 | 8.7 | 44 | 2,071,045 | 18.0 | 9 |
| Polish People's Party | 972,952 | 8.7 | 48 | 1,691,566 | 14.7 | 7 |
| Confederation of Independent Poland | 841,738 | 7.5 | 46 | 1,071,364 | 9.3 | 4 |
| Liberal Democratic Congress | 839,978 | 7.5 | 37 | 1,497,718 | 13.1 | 6 |
| Peasants' Agreement | 613,626 | 5.5 | 28 | 719,778 | 6.3 | 5 |
| Solidarity | 566,553 | 5.1 | 27 | 2,219,160 | 19.3 | 11 |
| Polish Beer-Lovers' Party | 367,106 | 3.3 | 16 | – | – | – |
| Christian Democracy | 265,179 | 2.4 | 5 | – | – | – |
| Real Politics Union | 253,024 | 2.3 | 3 | 371,891 | 2.2 | 0 |
| Labour Solidarity | 230,975 | 2.1 | 4 | – | – | – |
| Democratic Party | 159,017 | 1.4 | 1 | 453,721 | 4.0 | 0 |
| German Minority | 132,059 | 1.2 | 7 | – | – | – |
| Party of Christian Democrats | 125,314 | 1.1 | 4 | 507,722 | 4.4 | 3 |
| Party X | 52,735 | 0.5 | 3 | 417,857 | 3.6 | 0 |
| Democratic-Social Movement | 51,656 | 0.5 | 1 | – | – | – |
| Ludowe Porozumienie Wyborcze "Piast" | 42,031 | 0.4 | 1 | – | – | – |
| Silesian Autonomy Movement | 40,061 | 0.4 | 2 | – | – | – |
| Solidarni z Prezydentem | 27,586 | 0.2 | 1 | – | – | – |
| Związek Podhalan | 26,744 | 0.2 | 1 | – | – | – |
| Polski Związek Zachodni | 26,053 | 0.2 | 4 | – | – | – |
| Wielkopolsce i Polsce | 23,188 | 0.2 | 1 | – | – | – |
| Jedności Ludowej | 18,902 | 0.2 | 1 | – | – | – |
| Prawosławnych | 13,788 | 0.1 | 1 | – | – | – |
| Solidarność 80 | 12,769 | 0.1 | 1 | – | – | – |
| Unia Wielkopolan | 9,019 | 0.0 | 1 | – | – | – |
| Sojusz Kobiet | 1,922 | 0.0 | 1 | – | – | – |
| Local lists and independents | 820,108 | 7.3 | 0 | 3,708,344 | 32.3 | 21 |
| Invalid/blank votes | 669,347 | – | – | 413,019 | – | – |
| Total | 11,887,949 | 100 | 460 | 11,887,865 | 100 | 100 |
| Registered voters/turnout | 27,517,280 | 43.2 | – | 25,517,280 | 43.2 | – |
| Source: Nohlen & Stöver | ||||||
References
- "Posłowie X kadencji (Members of the X Sejm)". Sejm.gov.pl. Retrieved 8 January 2015.
- Dieter Nohlen & Philip Stöver (2010) Elections in Europe: A data handbook, p1491 ISBN 978-3-8329-5609-7
- Millard, Francis (September 1994). "The Shaping of the Polish Party System, 1989-93". East European Politics & Societies. 8 (3): 467–494. doi:10.1177/0888325494008003005.
- Lundberg, Thomas. "Political Transition in Hungary and Poland". Voting and Democracy Report: 1995. Center for Voting and Democracy. Retrieved 12 August 2012.
- Jasiewicz, Krzysztof (1 January 1992). "From Solidarity to Fragmentation" (PDF). Journal of Democracy. 3 (2): 55–69. doi:10.1353/jod.1992.0024. Archived from the original (PDF) on 18 August 2010. Retrieved 12 August 2012.
- Obwieszczenie Państwowej Komisji Wyborczej z dn. 31 X 1991 r., Monitor Polski. Nr 41, poz. 288
- Obwieszczenie PKW z dn. 30 X 1991 r., M.P. Nr 41, poz. 287
| Presidential elections | |
|---|---|
| Legislative elections | |
| Local elections | |
| European elections | |
| Referendums | |
| |
| 1990–1995 Wałęsa Presidency |
|  |
|---|---|---|
| 1995–2005 Kwaśniewski Presidency |
| |
| 2005–2010 Kaczyński Presidency |
| |
| 2010–2015 Komorowski Presidency |
| |
| 2015-present Duda Presidency |
| |