2004 Carlow County Council election
An election to Carlow County Council took place on 11 June 2004 as part of that year's Irish local elections. 21 councillors were elected from five electoral divisions by PR-STV voting for a five-year term of office.
| |||||||||||||||||||||||||||||||||
All 21 seats to Carlow County Council | |||||||||||||||||||||||||||||||||
|---|---|---|---|---|---|---|---|---|---|---|---|---|---|---|---|---|---|---|---|---|---|---|---|---|---|---|---|---|---|---|---|---|---|
| |||||||||||||||||||||||||||||||||
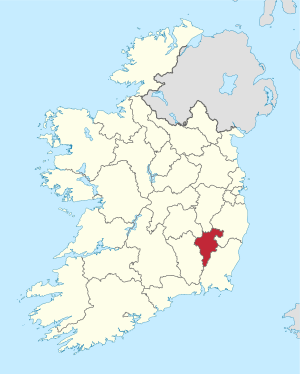 Map showing the area of Carlow County Council | |||||||||||||||||||||||||||||||||
| |||||||||||||||||||||||||||||||||
Results by party
| Party | Seats | ± | First Pref. votes | FPv% | ±% | |
|---|---|---|---|---|---|---|
| Fianna Fáil | 8 | -1 | 7,844 | 36.32% | ||
| Fine Gael | 7 | - | 7,107 | 32.91% | ||
| Labour Party | 4 | +1 | 3,713 | 17.19% | ||
| Green Party | 1 | - | 1,482 | 6.86% | ||
| Progressive Democrats | 1 | - | 730 | 3.38% | ||
| Totals | 21 | - | 21,596 | 100% | — | |
Results by Electoral Area
Borris
| Borris - 3 seats | ||||||||
|---|---|---|---|---|---|---|---|---|
| Party | Candidate | FPv% | Count 1 | Count 2 | Count 3 | Count 4 | ||
| Labour Party | Michael Meaney* | 33.13 | 1,002 | |||||
| Fine Gael | Tommy Kinsella | 23.41 | 708 | 798 | ||||
| Green Party | Mary White* | 20.17 | 610 | 680 | 693 | 827 | ||
| Fianna Fáil | Teddy Holden | 11.84 | 358 | 412 | 426 | 608 | ||
| Fianna Fáil | Peter O'Rourke | 11.44 | 346 | 377 | 391 | |||
| Electorate: 5,179 Valid: 3,024 (58.39%) Spoilt: 58 Quota: 757 Turnout: 3,082 (59.51%) | ||||||||
Carlow No.1
| Carlow No.1 - 3 seats | ||||||||
|---|---|---|---|---|---|---|---|---|
| Party | Candidate | FPv% | Count 1 | Count 2 | Count 3 | Count 4 | ||
| Fianna Fáil | Jennifer Murnane-O'Connor* | 30.23 | 843 | |||||
| Fianna Fáil | Joe McDonald* | 19.47 | 543 | 609 | 655 | 741 | ||
| Fine Gael | Declan Alcock* | 15.13 | 422 | 449 | 485 | 613 | ||
| Fine Gael | Colette Fennelly | 14.95 | 417 | 431 | 457 | 562 | ||
| Labour Party | Jimmy Brennan | 12.44 | 347 | 374 | 450 | |||
| Green Party | Matt Diskin | 7.78 | 217 | 228 | ||||
| Electorate: 5,777 Valid: 2,789 (48.28%) Spoilt: 44 Quota: 698 Turnout: 2,857 (49.45%) | ||||||||
Carlow No.2
| Carlow No.2 - 5 seats | ||||||||||||||
|---|---|---|---|---|---|---|---|---|---|---|---|---|---|---|
| Party | Candidate | FPv% | Count 1 | Count 2 | Count 3 | Count 4 | Count 5 | Count 6 | Count 7 | Count 8 | Count 9 | Count 10 | ||
| Fine Gael | Michael Abbey* | 22.94 | 1,094 | |||||||||||
| Fianna Fáil | Rody Kelly* | 17.38 | 853 | |||||||||||
| Progressive Democrats | Walter Lacey* | 14.87 | 730 | 788 | 797 | 814 | 852 | |||||||
| Labour Party | Des Hurley | 11.14 | 547 | 576 | 579 | 601 | 630 | 679 | 726 | 874 | ||||
| Fianna Fáil | Lorraine Hynes* | 7.76 | 381 | 404 | 414 | 421 | 486 | 519 | 553 | 597 | 614 | 631 | ||
| Green Party | Geraldine Callinan-O'Dea | 6.21 | 305 | 320 | 321 | 336 | 349 | 412 | 432 | |||||
| Fine Gael | Wayne Fennell* | 5.79 | 284 | 333 | 334 | 338 | 345 | 365 | 512 | 577 | 615 | 619 | ||
| Fine Gael | Gerry Dunne | 4.36 | 214 | 278 | 279 | 284 | 294 | 310 | ||||||
| Fianna Fáil | Annie Parker-Byrne | 3.95 | 194 | 208 | 214 | 226 | ||||||||
| Independent | Thompson Akinwunmi-Streets | 3.83 | 188 | 204 | 206 | 230 | 244 | |||||||
| Independent | Conor Dowling | 2.42 | 119 | 126 | 127 | |||||||||
| Electorate: 10,135 Valid: 4,909 (48.44%) Spoilt: 126 Quota: 819 Turnout: 5,035 (49.68%) | ||||||||||||||
Muinebheag
| Muinebheag - 5 seats | ||||||||||||
|---|---|---|---|---|---|---|---|---|---|---|---|---|
| Party | Candidate | FPv% | Count 1 | Count 2 | Count 3 | Count 4 | Count 5 | Count 6 | Count 7 | Count 8 | ||
| Labour Party | Jim Townsend* | 18.29 | 965 | |||||||||
| Fine Gael | Denis Foley | 18.10 | 955 | |||||||||
| Fianna Fáil | Arthur McDonald* | 12.66 | 668 | 675 | 691 | 710 | 721 | 766 | 820 | 931 | ||
| Fianna Fáil | Enda Nolan* | 12.05 | 636 | 656 | 691 | 697 | 719 | 776 | 803 | 890 | ||
| Fine Gael | Michael Drea | 8.38 | 442 | 447 | 461 | 480 | 503 | 533 | 611 | 654 | ||
| Fianna Fáil | Eddie Cullen | 7.77 | 410 | 416 | 431 | 436 | 456 | 521 | 541 | |||
| Fine Gael | Michael Doran | 7.62 | 402 | 408 | 413 | 425 | 463 | 531 | 579 | 760 | ||
| Fianna Fáil | Martin Nevin | 5.31 | 280 | 285 | 291 | 295 | 306 | |||||
| Labour Party | Liam O'Brien | 4.02 | 212 | 238 | 238 | 245 | 312 | 323 | ||||
| Green Party | John James Tully | 3.92 | 207 | 212 | 213 | 216 | ||||||
| Fianna Fáil | Pat Abbey | 1.88 | 99 | 104 | ||||||||
| Electorate: 9,184 Valid: 5,276 (57.45%) Spoilt: 99 Quota: 880 Turnout: 5,375 (58.53%) | ||||||||||||
Tullow
| Tullow - 5 seats | ||||||||||||||
|---|---|---|---|---|---|---|---|---|---|---|---|---|---|---|
| Party | Candidate | FPv% | Count 1 | Count 2 | Count 3 | Count 4 | Count 5 | Count 6 | Count 7 | Count 8 | Count 9 | Count 10 | ||
| Fianna Fáil | P.J. Kavanagh* | 15.47 | 866 | 866 | 875 | 909 | 929 | 932 | 977 | |||||
| Fianna Fáil | John Pender* | 15.40 | 862 | 866 | 872 | 893 | 735 | 825 | ||||||
| Fine Gael | Fred Hunter* | 12.20 | 683 | 689 | 705 | 717 | 763 | 766 | 841 | 1,023 | ||||
| Fine Gael | Michael Deering* | 11.09 | 621 | 635 | 650 | 667 | 688 | 691 | 740 | 859 | 910 | 920 | ||
| Fine Gael | Pat O'Toole | 9.63 | 539 | 540 | 553 | 562 | 585 | 587 | 695 | 718 | 727 | 733 | ||
| Fianna Fáil | Noel Kennedy | 9.02 | 505 | 525 | 531 | 536 | 565 | 567 | 574 | |||||
| Labour Party | William Paton* | 7.54 | 422 | 423 | 445 | 527 | 591 | 593 | 651 | 702 | 731 | 741 | ||
| Sinn Féin | Declan Sheeran | 5.95 | 333 | 341 | 352 | 363 | ||||||||
| Fine Gael | John O'Donovan | 5.82 | 326 | 326 | 344 | 378 | 392 | 393 | ||||||
| Labour Party | Billy Nolan | 3.89 | 218 | 220 | 242 | |||||||||
| Green Party | Patricia Carolan | 2.55 | 143 | 152 | ||||||||||
| Independent | Bill Leonard | 1.43 | 80 | |||||||||||
| Electorate: 9,693 Valid: 5,598 (57.75%) Spoilt: 72 Quota: 934 Turnout: 5,688 (58.68%) | ||||||||||||||
External links
| Preceded by 1999 Carlow County Council election |
Carlow County Council elections | Succeeded by 2009 Carlow County Council election |
This article is issued from Wikipedia. The text is licensed under Creative Commons - Attribution - Sharealike. Additional terms may apply for the media files.