2004 South Tipperary County Council election
An election to South Tipperary County Council took place on 11 June 2004 as part of that year's Irish local elections. 26 councillors were elected from five electoral divisions by PR-STV voting for a five-year term of office.
| |||||||||||||||||||||||||||||||||
All 26 seats to South Tipperary County Council | |||||||||||||||||||||||||||||||||
|---|---|---|---|---|---|---|---|---|---|---|---|---|---|---|---|---|---|---|---|---|---|---|---|---|---|---|---|---|---|---|---|---|---|
| |||||||||||||||||||||||||||||||||
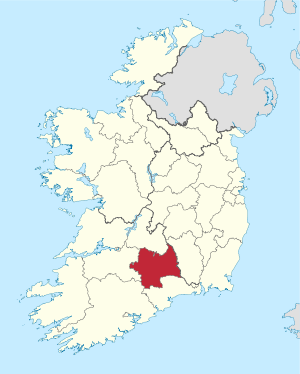 Map showing the area of South Tipperary County Council | |||||||||||||||||||||||||||||||||
| |||||||||||||||||||||||||||||||||
Results by party
| Party | Seats | ± | First Pref. votes | FPv% | ±% | |
|---|---|---|---|---|---|---|
| Fianna Fáil | 10 | -2 | 14,561 | 34.86% | ||
| Fine Gael | 8 | -1 | 11,641 | 27.87% | ||
| Labour Party | 2 | +1 | 4,000 | 9.58% | ||
| Independent | 6 | +2 | 8,751 | 20.95% | ||
| Totals | 26 | - | 41,770 | 100% | — | |
Results by Electoral Area
Cahir
| Cahir - 4 seats | ||||||||||||||
|---|---|---|---|---|---|---|---|---|---|---|---|---|---|---|
| Party | Candidate | FPv% | Count 1 | Count 2 | Count 3 | Count 4 | Count 5 | Count 6 | Count 7 | Count 8 | Count 9 | Count 10 | ||
| Fianna Fáil | Mattie McGrath* | 27.58 | 1,902 | |||||||||||
| Fianna Fáil | Michael Anglim* | 16.24 | 1,120 | 1,315 | 1,322 | 1,363 | 1,474 | |||||||
| Fine Gael | Liam Ahearn | 11.21 | 773 | 818 | 824 | 849 | 870 | 878 | 900 | 977 | 1,054 | 1,297 | ||
| Labour Party | Seanie Lonergan | 9.15 | 631 | 667 | 693 | 712 | 733 | 740 | 823 | 940 | 978 | 1,080 | ||
| Fine Gael | Dan Costigan* | 7.87 | 543 | 566 | 582 | 604 | 633 | 641 | 694 | 768 | 803 | 941 | ||
| Fine Gael | Marie Murphy | 6.93 | 478 | 522 | 524 | 555 | 568 | 570 | 609 | 651 | 774 | |||
| Fianna Fáil | Martin Neville | 5.06 | 349 | 411 | 412 | 428 | 449 | 484 | 504 | 528 | ||||
| Independent | Gerry Duffy | 4.77 | 329 | 351 | 378 | 392 | 401 | 407 | 448 | |||||
| Sinn Féin | Michael Nugent | 4.07 | 281 | 306 | 315 | 319 | 345 | 351 | ||||||
| Fianna Fáil | Patrick Byron | 3.22 | 222 | 257 | 257 | 275 | ||||||||
| Progressive Democrats | Seán English | 2.49 | 172 | 195 | 199 | |||||||||
| Independent | Liam Roche | 1.41 | 97 | 109 | ||||||||||
| Electorate: 10,248 Valid: 6,897 (67.30%) Spoilt: 107 Quota: 1,380 Turnout: 7,004 (68.35%) | ||||||||||||||
Cashel
| Cashel - 4 seats | |||||||||||
|---|---|---|---|---|---|---|---|---|---|---|---|
| Party | Candidate | FPv% | Count 1 | Count 2 | Count 3 | Count 4 | Count 5 | Count 6 | Count 7 | ||
| Fine Gael | Jack Crowe* | 20.62 | 1,565 | ||||||||
| Fianna Fáil | Dr.Seán McCarthy* | 16.53 | 1,255 | 1,262 | 1,337 | 1,398 | 1,481 | 1,522 | |||
| Independent | Tom Wood* | 16.39 | 1,244 | 1,250 | 1,375 | 1,474 | 1,731 | ||||
| Fianna Fáil | Roger Kennedy | 10.08 | 765 | 771 | 829 | 876 | 984 | 1,029 | 1,427 | ||
| Fine Gael | Catherine McLoughlin* | 9.75 | 740 | 754 | 772 | 862 | 941 | 1,003 | 1,135 | ||
| Fianna Fáil | Joseph O'Connell | 8.27 | 628 | 632 | 652 | 759 | 788 | 805 | |||
| Independent | Patrick Downey | 6.44 | 489 | 491 | 556 | 599 | |||||
| Labour Party | Jim Hickey | 5.99 | 455 | 460 | 504 | ||||||
| Sinn Féin | Liam Browne | 5.93 | 450 | 452 | |||||||
| Electorate: 11,949 Valid: 7,591 (63.53%) Spoilt: 84 Quota: 1,519 Turnout: 7,675 (64.23%) | |||||||||||
Clonmel
| Clonmel - 7 seats | ||||||||||||||||
|---|---|---|---|---|---|---|---|---|---|---|---|---|---|---|---|---|
| Party | Candidate | FPv% | Count 1 | Count 2 | Count 3 | Count 4 | Count 5 | Count 6 | Count 7 | Count 8 | Count 9 | Count 10 | Count 11 | Count 12 | ||
| Workers and Unemployed Action | Phil Prendergast* | 13.56 | 1,353 | |||||||||||||
| Fianna Fáil | Tom Ambrose* | 10.63 | 1,061 | 1,067 | 1,073 | 1,093 | 1,161 | 1,191 | 1,217 | 1,277 | ||||||
| Workers and Unemployed Action | Billy Shoer | 8.68 | 866 | 895 | 927 | 947 | 983 | 1,064 | 1,169 | 1,198 | 1,198 | 1,299 | ||||
| Workers and Unemployed Action | Pat English | 8.04 | 802 | 815 | 827 | 836 | 866 | 908 | 978 | 1,011 | 1,013 | 1,070 | 1,079 | 1,240 | ||
| Fianna Fáil | Pat Norris* | 7.12 | 710 | 713 | 725 | 762 | 777 | 786 | 794 | 815 | 820 | 956 | 964 | 1,048 | ||
| Fine Gael | Seán Nyhan* | 6.31 | 630 | 638 | 653 | 667 | 699 | 747 | 776 | 918 | 921 | 1,004 | 1,012 | 1,129 | ||
| Fianna Fáil | Martin O'Brien | 6.30 | 629 | 637 | 649 | 660 | 682 | 709 | 738 | 770 | 772 | 885 | 891 | 963 | ||
| Fine Gael | Derry Foley* | 6.21 | 620 | 623 | 627 | 663 | 700 | 717 | 729 | 939 | 946 | 1,006 | 1,014 | 1,142 | ||
| Fianna Fáil | Niall Dennehy* | 5.92 | 591 | 596 | 602 | 620 | 665 | 690 | 710 | 745 | 751 | |||||
| Fine Gael | Josephine Chamney | 5.68 | 567 | 571 | 579 | 598 | 627 | 663 | 674 | |||||||
| Green Party | Bernard Lennon | 5.21 | 520 | 526 | 536 | 569 | 591 | 639 | 708 | 770 | 774 | 850 | 862 | |||
| Sinn Féin | Brian Gearon | 4.31 | 430 | 433 | 447 | 451 | 462 | 487 | ||||||||
| Independent | Ted Boyle | 3.72 | 371 | 375 | 384 | 393 | ||||||||||
| Labour Party | Anne Taylor | 3.64 | 363 | 372 | 434 | 440 | 454 | |||||||||
| Progressive Democrats | P.J. Long | 2.49 | 248 | 249 | 251 | |||||||||||
| Labour Party | Cyril O'Flaherty | 2.16 | 216 | 219 | ||||||||||||
| Electorate: 16,321 Valid: 9,977 (61.13%) Spoilt: 177 Quota: 1,248 Turnout: 10,154 (62.21%) | ||||||||||||||||
Fethard
| Fethard - 6 seats | |||||||||||||
|---|---|---|---|---|---|---|---|---|---|---|---|---|---|
| Party | Candidate | FPv% | Count 1 | Count 2 | Count 3 | Count 4 | Count 5 | Count 6 | Count 7 | Count 8 | Count 9 | ||
| Labour Party | Denis Landy* | 15.30 | 1,449 | ||||||||||
| Independent | Eddie O'Meara* | 14.35 | 1,359 | ||||||||||
| Fine Gael | John Fahey* | 11.91 | 1,128 | 1,130 | 1,141 | 1,238 | 1,272 | 1,383 | |||||
| Fine Gael | Michael O'Brien | 9.52 | 901 | 904 | 917 | 963 | 981 | 1,087 | 1,114 | 1,127 | 1,130 | ||
| Fianna Fáil | Susan Meagher* | 8.99 | 851 | 852 | 895 | 976 | 1,014 | 1,441 | |||||
| Fine Gael | Joe Brennan | 8.87 | 840 | 856 | 931 | 965 | 1,067 | 1,108 | 1,117 | 1,127 | 1,129 | ||
| Fianna Fáil | Pat O'Meara* | 8.01 | 758 | 758 | 767 | 916 | 937 | ||||||
| Fianna Fáil | Denis Bourke* | 7.17 | 679 | 702 | 888 | 903 | 1,072 | 1,136 | 1,188 | 1,195 | 1,196 | ||
| Sinn Féin | David Dunne | 5.79 | 548 | 565 | 623 | 655 | |||||||
| Labour Party | Noel Quinlan | 5.37 | 508 | 523 | 534 | ||||||||
| Fianna Fáil | Sylvia Cooney-Sheehan | 4.72 | 447 | 466 | |||||||||
| Electorate: 14,623 Valid: 9,468 (64.75%) Spoilt: 170 Quota: 1,353 Turnout: 9,638 (65.91%) | |||||||||||||
Tipperary
| Tipperary - 5 seats | ||||||||||||
|---|---|---|---|---|---|---|---|---|---|---|---|---|
| Party | Candidate | FPv% | Count 1 | Count 2 | Count 3 | Count 4 | Count 5 | Count 6 | Count 7 | Count 8 | ||
| Fine Gael | Michael Fitzgerald* | 22.04 | 1,727 | |||||||||
| Fianna Fáil | Michael Maguire* | 11.94 | 936 | 1,004 | 1,037 | 1,061 | 1,157 | 1,295 | 1,417 | |||
| Fianna Fáil | Joe Donovan* | 11.18 | 876 | 949 | 982 | 1,012 | 1,065 | 1,109 | 1,163 | 1,179 | ||
| Fianna Fáil | Dr. John Wallace | 9.98 | 782 | 800 | 829 | 864 | 918 | 999 | 1,142 | 1,172 | ||
| Independent | Christy Kinahan* | 9.20 | 721 | 748 | 762 | 868 | 991 | 1,026 | 1,268 | 1,299 | ||
| Independent | Denis Leahy | 7.75 | 607 | 631 | 645 | 697 | 778 | 822 | ||||
| Fine Gael | John Crosse | 7.60 | 596 | 715 | 727 | 772 | 863 | 1,105 | 1,249 | 1,271 | ||
| Fine Gael | P.J. Maher | 6.80 | 533 | 580 | 590 | 605 | 659 | |||||
| Independent | Mick Byrnes | 6.55 | 513 | 528 | 539 | 600 | ||||||
| Labour Party | Billy Bourke | 4.82 | 378 | 391 | 403 | |||||||
| Progressive Democrats | David Mullins | 2.14 | 168 | 184 | ||||||||
| Electorate: 12,473 Valid: 7,837 (62.83%) Spoilt: 130 Quota: 1,307 Turnout: 7,967 (63.87%) | ||||||||||||
External links
| Preceded by 1999 South Tipperary County Council election |
South Tipperary County Council elections | Succeeded by 2009 South Tipperary County Council election |
This article is issued from Wikipedia. The text is licensed under Creative Commons - Attribution - Sharealike. Additional terms may apply for the media files.