2004 Clare County Council election
An election to Clare County Council took place on 11 June 2004 as part of that year's Irish local elections. 32 councillors were elected from six electoral divisions by PR-STV voting for a five-year term of office.
| |||||||||||||||||||||||||||||||||||||
All 32 seats to Clare County Council | |||||||||||||||||||||||||||||||||||||
|---|---|---|---|---|---|---|---|---|---|---|---|---|---|---|---|---|---|---|---|---|---|---|---|---|---|---|---|---|---|---|---|---|---|---|---|---|---|
| |||||||||||||||||||||||||||||||||||||
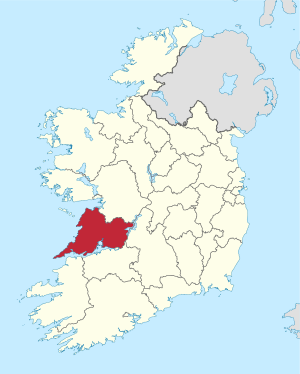 Map showing the area of Clare County Council | |||||||||||||||||||||||||||||||||||||
| |||||||||||||||||||||||||||||||||||||
Results by party
| Party | Seats | ± | First Pref. votes | FPv% | ±% | |
|---|---|---|---|---|---|---|
| Fianna Fáil | 15 | -3 | 22,717 | 41.51% | ||
| Fine Gael | 10 | +1 | 15,779 | 28.83% | ||
| Green Party | 1 | +1 | 2,466 | 4.51% | ||
| Labour Party | 1 | +1 | 1,815 | 3.32% | ||
| Independent | 5 | +1 | 8,801 | 16.08% | ||
| Progressive Democrats | 0 | -1 | 2,103 | 3.84% | ||
| Totals | 32 | - | 54,725 | 100% | — | |
Results by Electoral Area
Ennis
| Ennis - 7 seats | ||||||||||||||
|---|---|---|---|---|---|---|---|---|---|---|---|---|---|---|
| Party | Candidate | FPv% | Count 1 | Count 2 | Count 3 | Count 4 | Count 5 | Count 6 | Count 7 | Count 8 | Count 9 | Count 10 | ||
| Fine Gael | Joe Carey* | 15.97 | 1,939 | |||||||||||
| Fianna Fáil | Pat Daly* | 11.60 | 1,409 | 1,442 | 1,459 | 1,499 | 1,545 | |||||||
| Independent | Tommy Brennan* | 9.75 | 1,184 | 1,213 | 1,231 | 1,278 | 1,355 | 1,420 | 1,459 | 1,791 | ||||
| Fine Gael | Sonny Scanlan* | 9.12 | 1,108 | 1,166 | 1,195 | 1,215 | 1,233 | 1,277 | 1,394 | 1,441 | 1,457 | 1,461 | ||
| Green Party | Brian Meaney | 8.33 | 1,011 | 1,033 | 1,057 | 1,105 | 1,174 | 1,349 | 1,425 | 1,516 | 1,551 | |||
| Fianna Fáil | Peter Considine* | 7.72 | 937 | 956 | 963 | 1,008 | 1,044 | 1,069 | 1,203 | 1,294 | 1,359 | 1,362 | ||
| Fianna Fáil | Bernard Hanrahan* | 6.86 | 833 | 913 | 938 | 965 | 985 | 999 | 1,160 | 1,250 | 1,280 | 1,281 | ||
| Independent | Frankie Neylon | 6.19 | 752 | 770 | 798 | 822 | 875 | 929 | 962 | |||||
| Fine Gael | Tony Mulqueen | 6.15 | 747 | 835 | 857 | 910 | 942 | 1,007 | 1,044 | 1,177 | 1,226 | 1,240 | ||
| Fianna Fáil | Tom Malone | 5.15 | 626 | 636 | 649 | 674 | 701 | 738 | ||||||
| Labour Party | Paul O'Shea | 4.91 | 596 | 608 | 610 | 629 | 659 | |||||||
| Sinn Féin | Paddy Barrett | 3.59 | 436 | 446 | 464 | 472 | ||||||||
| Progressive Democrats | Roger Leyden | 2.96 | 359 | 379 | 384 | |||||||||
| Independent | J.J. McCabe | 1.70 | 207 | 228 | ||||||||||
| Electorate: 22,471 Valid: 12,144 (54.04%) Spoilt: 215 Quota: 1,519 Turnout: 12,359 (55.00%) | ||||||||||||||
Ennistymon
| Ennistymon - 6 seats | |||||||||
|---|---|---|---|---|---|---|---|---|---|
| Party | Candidate | FPv% | Count 1 | Count 2 | Count 3 | Count 4 | Count 5 | ||
| Fianna Fáil | Michael Kelly | 14.49 | 1,533 | ||||||
| Fine Gael | Joe Arkins* | 13.90 | 1,470 | 1,624 | |||||
| Fianna Fáil | Richard Nagle* | 11.68 | 1,235 | 1,267 | 1,368 | 1,376 | 1,381 | ||
| Fine Gael | Martin Conway | 11.67 | 1,234 | 1,324 | 1,438 | 1,488 | 1,506 | ||
| Fianna Fáil | Michael Hillery* | 11.54 | 1,221 | 1,251 | 1,313 | 1,318 | 1,321 | ||
| Fianna Fáil | Flan Garvey* | 11.42 | 1,208 | 1,272 | 1,526 | ||||
| Independent | Martin Lafferty* | 11.04 | 1,168 | 1,362 | 1,492 | 1,541 | |||
| Fianna Fáil | Tom Burke* | 7.64 | 808 | 852 | |||||
| Green Party | Ann Marie Flanagan | 6.62 | 700 | ||||||
| Electorate: 15,711 Valid: 10,577 (67.32%) Spoilt: 129 Quota: 1,512 Turnout: 10,706 (68.14%) | |||||||||
Killaloe
| Killaloe - 4 seats | ||||||||||||
|---|---|---|---|---|---|---|---|---|---|---|---|---|
| Party | Candidate | FPv% | Count 1 | Count 2 | Count 3 | Count 4 | Count 5 | Count 6 | Count 7 | Count 8 | ||
| Fianna Fáil | Cathal Crowe | 13.13 | 940 | 971 | 1,105 | 1,163 | 1,320 | 1,326 | 1,701 | |||
| Fine Gael | John McInerney | 12.29 | 880 | 925 | 997 | 1,297 | 1,454 | |||||
| Fianna Fáil | Pat O'Gorman* | 11.58 | 829 | 839 | 873 | 938 | 988 | 989 | 1,136 | 1,233 | ||
| Fianna Fáil | Tony O'Brien | 11.03 | 790 | 827 | 838 | 934 | 978 | 980 | 1,136 | 1,239 | ||
| Labour Party | Pascal Fitzgerald | 10.91 | 781 | 865 | 938 | 979 | 1,141 | 1,149 | 1,252 | 1,299 | ||
| Fianna Fáil | Michael Begley* | 10.77 | 771 | 791 | 803 | 877 | 975 | 979 | ||||
| Fine Gael | Batt Skehan | 9.51 | 681 | 719 | 746 | |||||||
| Progressive Democrats | Mary Mannion* | 9.12 | 653 | 697 | 757 | 809 | ||||||
| Independent | Noel Broggy | 6.38 | 457 | 494 | ||||||||
| Green Party | Mick Murtagh | 5.29 | 379 | |||||||||
| Electorate: 11,051 Valid: 7,161 (64.80%) Spoilt: 79 Quota: 1,433 Turnout: 7,240 (65.51%) | ||||||||||||
Kilrush
| Kilrush - 7 seats | ||||||||||||
|---|---|---|---|---|---|---|---|---|---|---|---|---|
| Party | Candidate | FPv% | Count 1 | Count 2 | Count 3 | Count 4 | Count 5 | Count 6 | Count 7 | Count 8 | ||
| Independent | Christy Curtin* | 13.84 | 1,564 | |||||||||
| Fianna Fáil | P.J. Kelly* | 10.52 | 1,189 | 1,205 | 1,221 | 1,313 | 1,370 | 1,402 | 1,414 | |||
| Fine Gael | Oliver Garry* | 10.25 | 1,158 | 1,169 | 1,187 | 1,205 | 1,251 | 1,422 | ||||
| Fine Gael | Madeleine Taylor-Quinn* | 9.55 | 1,079 | 1,092 | 1,156 | 1,183 | 1,342 | 1,624 | ||||
| Fianna Fáil | Tom Prendeville* | 9.05 | 1,022 | 1,026 | 1,049 | 1,083 | 1,207 | 1,246 | 1,273 | 1,294 | ||
| Fianna Fáil | Bill Chambers* | 8.98 | 1,015 | 1,036 | 1,065 | 1,197 | 1,354 | 1,473 | ||||
| Fianna Fáil | Patrick Keane* | 8.90 | 1,006 | 1,011 | 1,036 | 1,061 | 1,123 | 1,184 | 1,206 | 1,228 | ||
| Independent | Oliver Keating | 7.25 | 819 | 830 | 906 | 951 | 1,045 | 1,137 | 1,191 | 1,207 | ||
| Progressive Democrats | Murt Collins | 6.74 | 762 | 785 | 813 | 848 | ||||||
| Fine Gael | Tim Donnellan | 5.99 | 677 | 698 | 725 | 894 | 980 | |||||
| Fianna Fáil | Michael Shannon | 5.42 | 612 | 633 | 649 | |||||||
| Sinn Féin | Gerry Malone | 2.35 | 265 | 268 | ||||||||
| Green Party | Cillian Murphy | 1.15 | 130 | 132 | ||||||||
| Electorate: 16,894 Valid: 11,298 (66.88%) Spoilt: 141 Quota: 1,413 Turnout: 11,439 (67.71%) | ||||||||||||
Scariff
| Scariff- 3 seats | ||||||||
|---|---|---|---|---|---|---|---|---|
| Party | Candidate | FPv% | Count 1 | Count 2 | Count 3 | Count 4 | ||
| Fianna Fáil | Pat Hayes* | 26.93 | 1,469 | |||||
| Fine Gael | Paul Bugler* | 18.26 | 996 | 1,113 | 1,213 | 1,234 | ||
| Fianna Fáil | Colm Wiley* | 17.77 | 969 | 996 | 1,253 | 1,322 | ||
| Fine Gael | Joe Cooney | 17.46 | 952 | 985 | 1,278 | 1,293 | ||
| Independent | Jim McInerney | 12.69 | 692 | 793 | ||||
| Green Party | Colm O'Brien | 4.51 | 246 | |||||
| Labour Party | Stanley Airewele | 2.38 | 130 | |||||
| Electorate: 7,798 Valid: 5,454 (69.94%) Spoilt: 53 Quota: 1,364 Turnout: 5,507 (70.62%) | ||||||||
Shannon
| Shannon - 5 seats | ||||||||||||
|---|---|---|---|---|---|---|---|---|---|---|---|---|
| Party | Candidate | FPv% | Count 1 | Count 2 | Count 3 | Count 4 | Count 5 | Count 6 | Count 7 | Count 8 | ||
| Fine Gael | John Crowe* | 14.84 | 1,201 | 1,214 | 1,225 | 1,280 | 1,300 | 1,511 | ||||
| Fine Gael | Tony Mulcahy* | 14.77 | 1,195 | 1,207 | 1,252 | 1,286 | 1,350 | |||||
| Independent | Patricia McCarthy* | 13.79 | 1,116 | 1,134 | 1,199 | 1,252 | 1,353 | |||||
| Fianna Fáil | Pat McMahon* | 12.59 | 1,019 | 1,022 | 1,042 | 1,077 | 1,086 | 1,249 | 1,290 | 1,523 | ||
| Independent | Gerry Flynn | 9.43 | 763 | 778 | 829 | 845 | 917 | 956 | 994 | 1,418 | ||
| Fianna Fáil | P.J. Ryan | 8.65 | 700 | 722 | 729 | 761 | 766 | 793 | 803 | 940 | ||
| Fianna Fáil | Seán Hillery* | 7.12 | 576 | 580 | 598 | 632 | 666 | 692 | 712 | |||
| Fine Gael | Brendan Ryan | 5.71 | 462 | 465 | 477 | 516 | 533 | |||||
| Progressive Democrats | Mary O'Donnell | 4.07 | 329 | 334 | 340 | |||||||
| Sinn Féin | Cathy McCaffrey | 3.83 | 310 | 312 | ||||||||
| Labour Party | Tony McMahon | 3.81 | 308 | 313 | 353 | 375 | ||||||
| Independent | Michael Naughton | 0.98 | 79 | |||||||||
| Socialist Workers | Dominic Haugh | 0.33 | 27 | |||||||||
| Socialist Workers | John McMahon | 0.07 | 6 | |||||||||
| Electorate: 14,273 Valid: 8,091 (56.69%) Spoilt: 113 Quota: 1,349 Turnout: 8,204 (57.48%) | ||||||||||||
External links
| Preceded by 1999 Clare County Council election |
Clare County Council elections | Succeeded by 2009 Clare County Council election |
This article is issued from Wikipedia. The text is licensed under Creative Commons - Attribution - Sharealike. Additional terms may apply for the media files.