2004 Meath County Council election
An election to Meath County Council took place on 11 June 2004 as part of that year's Irish local elections. 29 councillors were elected from five electoral divisions by PR-STV voting for a five-year term of office.
| |||||||||||||||||||||||||||||||||
All 29 seats to Meath County Council | |||||||||||||||||||||||||||||||||
|---|---|---|---|---|---|---|---|---|---|---|---|---|---|---|---|---|---|---|---|---|---|---|---|---|---|---|---|---|---|---|---|---|---|
| |||||||||||||||||||||||||||||||||
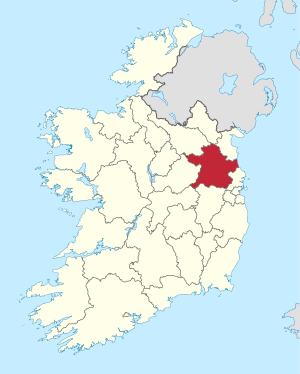 Map showing the area of Meath County Council | |||||||||||||||||||||||||||||||||
| |||||||||||||||||||||||||||||||||
Results by party
| Party | Seats | ± | First Pref. votes | FPv% | ±% | |
|---|---|---|---|---|---|---|
| Fianna Fáil | 12 | -2 | 24,011 | 38.36 | ||
| Fine Gael | 9 | -2 | 16,663 | 26.62 | ||
| Sinn Féin | 2 | +1 | 5,914 | 9.45 | ||
| Green Party | 1 | +1 | 2,690 | 4.30 | ||
| Independent | 5 | +2 | 8,539 | 13.64 | ||
| Totals | 29 | - | 62,598 | 100% | — | |
Results by Electoral Area
Dunshaughlin
| Dunshaughlin - 6 seats | ||||||||||||||||
|---|---|---|---|---|---|---|---|---|---|---|---|---|---|---|---|---|
| Party | Candidate | FPv% | Count 1 | Count 2 | Count 3 | Count 4 | Count 5 | Count 6 | Count 7 | Count 8 | Count 9 | Count 10 | Count 11 | Count 12 | ||
| Fianna Fáil | Nick Killian* | 14.74 | 2,195 | |||||||||||||
| Independent | Brian Fitzgerald* | 13.44 | 2,001 | 2,007 | 2,023 | 2,075 | 2,118 | 2,183 | ||||||||
| Fianna Fáil | Oliver Brooks* | 10.60 | 1,579 | 1,588 | 1,597 | 1,607 | 1,621 | 1,652 | 1,662 | 1,675 | 1,683 | 1,713 | 1,776 | 1,839 | ||
| Fianna Fáil | Noel Leonard | 9.84 | 1,465 | 1,472 | 1,480 | 1,487 | 1,491 | 1,515 | 1,518 | 1,530 | 1,754 | 1,770 | 2,075 | 2,136 | ||
| Fianna Fáil | Conor Tormey* | 7.92 | 1,180 | 1,190 | 1,192 | 1,210 | 1,230 | 1,267 | 1,268 | 1,318 | 1,330 | 1,574 | 1,610 | 1,640 | ||
| Fine Gael | Charles Bobbett | 7.68 | 1,143 | 1,154 | 1,171 | 1,239 | 1,272 | 1,309 | 1,313 | 1,419 | 1,452 | 1,844 | 2,552 | |||
| Fine Gael | John Fanning* | 6.82 | 1,016 | 1,018 | 1,024 | 1,036 | 1,062 | 1,076 | 1,077 | 1,189 | 1,203 | |||||
| Fine Gael | Ellen Cogavin | 6.15 | 916 | 918 | 940 | 946 | 966 | 977 | 979 | 1,037 | 1,300 | 1,490 | ||||
| Independent | Joe Bonner | 6.10 | 909 | 911 | 913 | 942 | 980 | 1,043 | 1,054 | 1,205 | 1,364 | 1,551 | 1,632 | 1,766 | ||
| Independent | Maria Murphy | 4.51 | 671 | 672 | 687 | 719 | 741 | 789 | 804 | 871 | ||||||
| Labour Party | John King | 3.02 | 449 | 450 | 584 | 599 | 683 | 756 | 759 | |||||||
| Sinn Féin | Keith Emmett | 2.97 | 442 | 444 | 452 | 474 | 511 | |||||||||
| Green Party | Antoin O Lochraigh | 2.34 | 348 | 350 | 373 | 389 | ||||||||||
| Independent | Joseph Mannering | 2.02 | 301 | 312 | 319 | |||||||||||
| Labour Party | Peter Ward | 1.85 | 276 | 277 | ||||||||||||
| Electorate: 27,800 Valid: 14,891 (53.56%) Spoilt: 265 Quota: 2,128 Turnout: 15,156 (54.52%) | ||||||||||||||||
Kells
| Kells - 6 seats | ||||||||
|---|---|---|---|---|---|---|---|---|
| Party | Candidate | FPv% | Count 1 | Count 2 | Count 3 | Count 4 | ||
| Sinn Féin | Michael Gallagher | 12.45 | 1,619 | 1,681 | 1,766 | 1,966 | ||
| Fine Gael | Eugene Cassidy | 12.13 | 1,577 | 1,601 | 1,761 | 1,837 | ||
| Fianna Fáil | Bryan Reilly* | 11.56 | 1,503 | 1,539 | 1,764 | 1,950 | ||
| Fine Gael | John V. FarrellyTD* | 11.35 | 1,475 | 1,516 | 1,613 | 1,887 | ||
| Fianna Fáil | Liz McCormack* | 10.89 | 1,416 | 1,475 | 1,652 | 1,713 | ||
| Fianna Fáil | Michael Lynch* | 10.82 | 1,407 | 1,426 | 1,713 | 1,828 | ||
| Fine Gael | Gerry Gibney* | 10.21 | 1,328 | 1,358 | 1,372 | 1,463 | ||
| Fianna Fáil | Dominic Moran | 8.71 | 1,133 | 1,143 | ||||
| Labour Party | Tommy Grimes | 8.38 | 1,089 | 1,187 | 1,215 | |||
| Green Party | Deirdre Reynolds | 3.49 | 454 | |||||
| Electorate: 21,503 Valid: 13,001 (60.46%) Spoilt: 340 Quota: 1,858 Turnout: 13,341 (62.04%) | ||||||||
Navan
| Navan - 7 seats | ||||||||||||||||
|---|---|---|---|---|---|---|---|---|---|---|---|---|---|---|---|---|
| Party | Candidate | FPv% | Count 1 | Count 2 | Count 3 | Count 4 | Count 5 | Count 6 | Count 7 | Count 8 | Count 9 | Count 10 | Count 11 | Count 12 | ||
| Fianna Fáil | Tommy Reilly* | 12.90 | 1,782 | |||||||||||||
| Sinn Féin | Joe Reilly* | 11.47 | 1,585 | 1,655 | 1,661 | '1,755 | ||||||||||
| Fine Gael | Jim Holloway* | 10.81 | 1,494 | 1,536 | 1,540 | 1,609 | 1,611 | 1,637 | 1,751 | |||||||
| Fianna Fáil | Alison Boyle | 9.18 | 1,268 | 1,299 | 1,314 | 1,341 | 1,343 | 1,450 | 1,521 | 1,524 | 1,593 | 1,625 | 1,736 | |||
| Fine Gael | Jenny D'Arcy | 7.18 | 992 | 1,018 | 1,020 | 1,089 | 1,091 | 1,121 | 1,188 | 1,192 | 1,260 | 1,582 | 1,800 | |||
| Fianna Fáil | Shane Cassells | 6.77 | 935 | 968 | 978 | 1,008 | 1,010 | 1,118 | 1,187 | 1,191 | 1,249 | 1,278 | 1,340 | 1,358 | ||
| Fianna Fáil | Jimmy Mangan* | 6.04 | 834 | 841 | 847 | 856 | 856 | 905 | 915 | 915 | 938 | 1,096 | 1,193 | 1,199 | ||
| Fine Gael | Patsy O'Neill* | 5.58 | 771 | 780 | 781 | 802 | 802 | 972 | 984 | 986 | 1,015 | 1,134 | 1,224 | 1,272 | ||
| Fine Gael | Caroline Hogan | 5.28 | 730 | 743 | 744 | 768 | 769 | 775 | 787 | 791 | 817 | |||||
| Fianna Fáil | Brendan Markey | 4.65 | 642 | 652 | 655 | 667 | 668 | |||||||||
| Sinn Féin | Peadar Toibin | 4.53 | 626 | 632 | 633 | 674 | 687 | 717 | 773 | 775 | ||||||
| Green Party | Fergal O'Byrne | 4.52 | 624 | 643 | 643 | 743 | 745 | 760 | 818 | 822 | 956 | 1,003 | ||||
| Labour Party | Anton McCabe | 4.15 | 574 | 616 | 618 | |||||||||||
| Independent | Andy Brennan | 3.95 | 546 | 623 | 625 | 680 | 682 | 701 | ||||||||
| Independent | Christy Gorman | 2.99 | 413 | |||||||||||||
| Electorate: 27,418 Valid: 13,816 (50.39%) Spoilt: 310 Quota: 1,728 Turnout: 14,126 (51.52%) | ||||||||||||||||
Slane
| Slane - 5 seats | ||||||||||||||
|---|---|---|---|---|---|---|---|---|---|---|---|---|---|---|
| Party | Candidate | FPv% | Count 1 | Count 2 | Count 3 | Count 4 | Count 5 | Count 6 | Count 7 | Count 8 | Count 9 | Count 10 | ||
| Independent | Jimmy Cudden* | 14.73 | 1,145 | 1,166 | 1,312 | 1,358 | 1,448 | 1,498 | 1,536 | 1,720 | 1,934 | |||
| Fianna Fáil | Hugh Gough* | 8.37 | 911 | 925 | 947 | 975 | 991 | 1,258 | 1,270 | 1,338 | 1,406 | 1,432 | ||
| Independent | Dominic Hannigan | 8.35 | 908 | 929 | 1,005 | 1,081 | 1,173 | 1,193 | 1,326 | 1,417 | 1,512 | 1,536 | ||
| Fianna Fáil | Patrick Boshell | 8.20 | 892 | 898 | 915 | 946 | 1,062 | 1,208 | 1,354 | 1,450 | 1,528 | 1,556 | ||
| Fine Gael | Ann Dillon-Gallagher* | 8.00 | 870 | 899 | 913 | 978 | 1,031 | 1,214 | 1,350 | 1,409 | 1,891 | |||
| Fine Gael | Shaun Lynch* | 7.92 | 862 | 875 | 937 | 967 | 1,013 | 1,052 | 1,251 | 1,304 | ||||
| Fianna Fáil | Gerard Reid | 7.70 | 838 | 845 | 866 | 870 | 899 | |||||||
| Sinn Féin | Seamus Lynch | 7.34 | 799 | 815 | 868 | 922 | 959 | 1,005 | 1,034 | |||||
| Fine Gael | Martina Maguire | 7.18 | 781 | 797 | 816 | 886 | 985 | 995 | ||||||
| Progressive Democrats | Sirena Campbell | 6.46 | 703 | 722 | 736 | 827 | ||||||||
| Labour Party | Shane Cassidy | 6.13 | 667 | 685 | 711 | |||||||||
| Green Party | Tom Kelly* | 5.40 | 587 | 741 | 778 | 907 | 1,050 | 1,078 | 1,236 | 1,389 | 1,527 | 1,558 | ||
| Independent | Pat O'Brien | 5.09 | 554 | 566 | ||||||||||
| Green Party | Carol Davis | 3.34 | 363 | |||||||||||
| Electorate: 22,580 Valid: 10,880 (48.18%) Spoilt: 297 Quota: 1,814 Turnout: 11,177 (49.50%) | ||||||||||||||
Trim
| Trim - 5 seats | ||||||||||
|---|---|---|---|---|---|---|---|---|---|---|
| Party | Candidate | FPv% | Count 1 | Count 2 | Count 3 | Count 4 | Count 5 | Count 6 | ||
| Fianna Fáil | Jimmy Fegan* | 17.92 | 1,794 | |||||||
| Fine Gael | Peter Higgins* | 15.05 | 1,507 | 1,549 | 1,578 | 1,682 | ||||
| Fianna Fáil | Seamus Murray* | 12.08 | 1,209 | 1,223 | 1,246 | 1,340 | 1,935 | |||
| Fine Gael | Willie Carey* | 12.00 | 1,201 | 1,219 | 1,222 | 1,264 | 1,411 | 1,482 | ||
| Independent | Phil Cantwell | 10.90 | 1,091 | 1,142 | 1,160 | 1,382 | 1,475 | 1,549 | ||
| Fianna Fáil | Gabriel Cribbin* | 10.27 | 1,028 | 1,043 | 1,079 | 1,149 | ||||
| Labour Party | Pat Holton | 10.22 | 1,023 | 1,100 | 1,106 | 1,278 | 1,395 | 1,464 | ||
| Sinn Féin | Caroli Ni Loinsigh | 8.42 | 843 | 890 | 900 | |||||
| Green Party | Carole Doherty | 3.14 | 314 | |||||||
| Electorate: 21,185 Valid: 10,010 (47.25%) Spoilt: 281 Quota: 1,669 Turnout: 10,291 (48.58%) | ||||||||||
External links
| Preceded by 1999 Meath County Council election |
Meath County Council elections | Succeeded by 2009 Meath County Council election |
This article is issued from Wikipedia. The text is licensed under Creative Commons - Attribution - Sharealike. Additional terms may apply for the media files.