2004 Mayo County Council election
An election to Mayo County Council took place on 11 June 2004 as part of that year's Irish local elections. 31 councillors were elected from seven electoral divisions by PR-STV voting for a five-year term of office.
| |||||||||||||||||||||||||||||||||
All 31 seats to Mayo County Council | |||||||||||||||||||||||||||||||||
|---|---|---|---|---|---|---|---|---|---|---|---|---|---|---|---|---|---|---|---|---|---|---|---|---|---|---|---|---|---|---|---|---|---|
| |||||||||||||||||||||||||||||||||
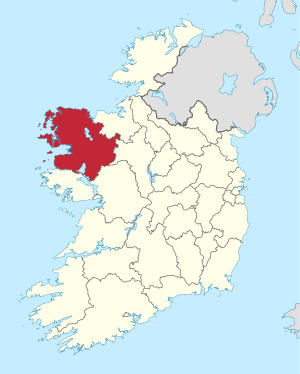 Map showing the area of Mayo County Council | |||||||||||||||||||||||||||||||||
| |||||||||||||||||||||||||||||||||
Results by party
| Party | Seats | ± | First Pref. votes | FPv% | ±% | |
|---|---|---|---|---|---|---|
| Fine Gael | 15 | +2 | 27,545 | 43.18% | ||
| Fianna Fáil | 12 | -4 | 23,615 | 37.02% | ||
| Sinn Féin | 1 | +1 | 2,706 | 4.24% | ||
| Labour Party | 1 | - | 1,439 | 2.26% | ||
| Independent | 2 | +1 | 7,317 | 11.47% | ||
| Totals | 31 | - | 63,795 | 100% | — | |
Results by Electoral Area
Ballina
| Ballina - 6 seats | ||||||||||||
|---|---|---|---|---|---|---|---|---|---|---|---|---|
| Party | Candidate | FPv% | Count 1 | Count 2 | Count 3 | Count 4 | Count 5 | Count 6 | Count 7 | Count 8 | ||
| Fianna Fáil | Annie Mae Reape* | 15.68 | 1,925 | |||||||||
| Fine Gael | Seamus Weir* | 13.75 | 1,688 | 1,710 | 1,775 | |||||||
| Fine Gael | Eddie Staunton* | 12.30 | 1,510 | 1,514 | 1,561 | 1,622 | 1,700 | 1,778 | ||||
| Fine Gael | Michelle Mulherin | 9.79 | 1,202 | 1,224 | 1,316 | 1,456 | 1,508 | 1,906 | ||||
| Fianna Fáil | Stephen Molloy* | 9.54 | 1,171 | 1,185 | 1,192 | 1,236 | 1,463 | 1,528 | 1,544 | 1,549 | ||
| Fine Gael | Jarlath Munnelly | 8.69 | 1,067 | 1,071 | 1,105 | 1,171 | 1,433 | 1,515 | 1,568 | 1,577 | ||
| Fianna Fáil | Johnnie O'Malley | 7.92 | 972 | 1,030 | 1,079 | 1,180 | 1,271 | 1,550 | 1,633 | 1,643 | ||
| Progressive Democrats | Greg Jackson | 7.18 | 881 | 895 | 915 | 1,043 | 1,090 | |||||
| Fianna Fáil | Brian Golden* | 6.33 | 777 | 786 | 792 | 869 | ||||||
| Independent | Raymond Collins | 5.93 | 728 | 743 | 768 | |||||||
| Fine Gael | Seán Newcombe | 2.87 | 352 | 361 | ||||||||
| Electorate: 19,794 Valid: 12,273 (62.0%) Spoilt: 185 Quota: 1,754 Turnout: 12,458 (62.94%) | ||||||||||||
Ballinrobe
| Ballinrobe - 3 seats | ||||||||
|---|---|---|---|---|---|---|---|---|
| Party | Candidate | FPv% | Count 1 | Count 2 | Count 3 | Count 4 | ||
| Fianna Fáil | Damien Ryan* | 23.16 | 1,551 | 1,584 | 1,986 | |||
| Fine Gael | Patsy O'Brien | 23.13 | 1,549 | 1,731 | ||||
| Independent | Harry Walsh | 18.20 | 1,219 | 1,342 | 1,484 | 1,632 | ||
| Fine Gael | Michael Burke* | 17.10 | 1,145 | 1,216 | 1,369 | 1,443 | ||
| Fianna Fáil | Nora Conroy | 11.47 | 768 | 808 | ||||
| Fine Gael | Padraig Flannery | 6.94 | 465 | |||||
| Electorate: 9,957 Valid: 6,697 (67.82%) Spoilt: 85 Quota: 1,675 Turnout: 6,782 (68.11%) | ||||||||
Belmullet
| Belmullet - 4 seats | |||||||||
|---|---|---|---|---|---|---|---|---|---|
| Party | Candidate | FPv% | Count 1 | Count 2 | Count 3 | Count 4 | Count 5 | ||
| Fianna Fáil | Tim Quinn* | 17.62 | 1,337 | 1,441 | 1,662 | ||||
| Fine Gael | Gerry Coyle* | 15.79 | 1,198 | 1,277 | 1,399 | 1,437 | 1,711 | ||
| Independent | Michael Holmes | 13.74 | 1,043 | 1,138 | 1,263 | 1,278 | 1,520 | ||
| Fine Gael | Pat Kilbane* | 13.39 | 1,016 | 1,023 | 1,049 | 1,051 | |||
| Fianna Fáil | Michael McNamara | 12.49 | 948 | 948 | 1,066 | 1,139 | 1,533 | ||
| Sinn Féin | Rose Conway-Walsh | 12.18 | 924 | 980 | 1,099 | 1,115 | 1,191 | ||
| Fianna Fáil | Frank Leneghan* | 9.72 | 738 | 754 | |||||
| Independent | Michael Healy | 5.07 | 385 | ||||||
| Electorate: 12,514 Valid: 7,589 (60.64%) Spoilt: 101 Quota: 1,518 Turnout: 7,690 (61.45%) | |||||||||
Castlebar
| Castlebar - 6 seats | ||||||||||||
|---|---|---|---|---|---|---|---|---|---|---|---|---|
| Party | Candidate | FPv% | Count 1 | Count 2 | Count 3 | Count 4 | Count 5 | Count 6 | Count 7 | Count 8 | ||
| Fine Gael | Cyril Burke* | 12.44 | 1,611 | 1,652 | 1,688 | 1,793 | 1,819 | 1,886 | ||||
| Fine Gael | Henry Kenny* | 12.21 | 1,581 | 1,640 | 1,674 | 1,950 | ||||||
| Fine Gael | Paddy McGuinness | 12.16 | 1,575 | 1,655 | 1,780 | 1,853 | ||||||
| Fianna Fáil | Seán Bourke* | 10.76 | 1,527 | 1,625 | 1,801 | 2,013 | ||||||
| Fianna Fáil | Al McDonnell* | 10.48 | 1,357 | 1,495 | 1,573 | 1,601 | 1,643 | 1,647 | 1,919 | |||
| Independent | Michael Kilcoyne | 9.30 | 1,204 | 1,228 | 1,303 | 1,339 | 1,361 | 1,374 | 1,550 | 1,570 | ||
| Labour Party | Johnny Mee* | 8.21 | 1,063 | 1,134 | 1,238 | 1,279 | 1,289 | 1,304 | 1,576 | 1,625 | ||
| Fine Gael | John Devaney* | 6.67 | 864 | 881 | 891 | |||||||
| Fianna Fáil | Iarla Duffy | 6.13 | 794 | 839 | 937 | 965 | 981 | 982 | ||||
| Fianna Fáil | Aidan Crowley | 5.44 | 704 | 771 | ||||||||
| Fianna Fáil | George O'Malley | 5.17 | 669 | |||||||||
| Electorate: 21,892 Valid: 12,949 (59.15%) Spoilt: 210 Quota: 1,850 Turnout: 13,159 (60.11%) | ||||||||||||
Claremorris
| Claremorris- 4 seats | ||||||||
|---|---|---|---|---|---|---|---|---|
| Party | Candidate | FPv% | Count 1 | Count 2 | Count 3 | Count 4 | ||
| Fine Gael | John Cribbin* | 21.42 | 1,693 | |||||
| Fine Gael | Tom Connolly | 20.37 | 1,610 | |||||
| Fianna Fáil | Patrick McHugh* | 17.43 | 1,378 | 1,390 | 1,415 | 1,556 | ||
| Fianna Fáil | Michael Carty* | 14.65 | 1,158 | 1,179 | 1,299 | 1,513 | ||
| Independent | Richard Finn* | 13.39 | 1,058 | 1,068 | 1,226 | 1,342 | ||
| Independent | Stephen Finn | 7.00 | 553 | 583 | 646 | |||
| Fine Gael | John Kelly | 5.74 | 454 | 493 | ||||
| Electorate: 12,295 Valid: 7,904 (64.29%) Spoilt: 144 Quota: 1,581 Turnout: 8,048 (65.46%) | ||||||||
Swinford
| Swinford - 4 seats | |||||||||||
|---|---|---|---|---|---|---|---|---|---|---|---|
| Party | Candidate | FPv% | Count 1 | Count 2 | Count 3 | Count 4 | Count 5 | Count 6 | Count 7 | ||
| Sinn Féin | Gerry Murray* | 22.07 | 1,782 | ||||||||
| Fine Gael | Eugene Lavin | 20.25 | 1,635 | ||||||||
| Fianna Fáil | Jimmy Maloney* | 13.97 | 1,128 | 1,140 | 1,159 | 1,286 | 1,371 | 1,693 | |||
| Fine Gael | Joseph Mellett* | 14.80 | 1,042 | 1,059 | 1,128 | 1,184 | 1,220 | 1,392 | 1,446 | ||
| Fine Gael | John Flannery* | 19.20 | 944 | 1,013 | 1,048 | 1,105 | 1,290 | 1,367 | 1,391 | ||
| Fianna Fáil | Brendan McNulty | 14.38 | 545 | 559 | 600 | 626 | 696 | ||||
| Fianna Fáil | Seán Murphy | 14.38 | 416 | 445 | 455 | 466 | |||||
| Labour Party | Michael Griffin | 14.38 | 376 | 390 | 403 | ||||||
| Independent | Martin Peyton | 14.38 | 205 | 217 | |||||||
| Electorate: 12,630 Valid: 8,073 (63.92%) Spoilt: 156 Quota: 1,615 Turnout: 8,229 (65.15%) | |||||||||||
Westport
| Westport - 4 seats | ||||||||||
|---|---|---|---|---|---|---|---|---|---|---|
| Party | Candidate | FPv% | Count 1 | Count 2 | Count 3 | Count 4 | Count 5 | Count 6 | ||
| Fianna Fáil | Margaret Adams* | 17.38 | 1,444 | 1,488 | 1,600 | 1,816 | ||||
| Fianna Fáil | Frank Chambers* | 15.86 | 1,318 | 1,349 | 1,556 | 1,788 | ||||
| Fine Gael | John O'Malley | 15.07 | 1,252 | 1,296 | 1,493 | 1,534 | 1,550 | 1,570 | ||
| Fine Gael | Peter Flynn | 13.62 | 1,132 | 1,186 | 1,339 | 1,394 | 1,424 | 1,442 | ||
| Fianna Fáil | Peter Sweeney* | 17.21 | 990 | 1,005 | 1,051 | |||||
| Fine Gael | Austin O'Malley | 11.55 | 960 | 982 | 1,056 | 1,498 | 1,549 | 1,617 | ||
| Independent | Christy Loftus | 9.86 | 819 | 936 | ||||||
| Green Party | Dr. Lucille Ryan-O'Shea | 3.51 | 292 | |||||||
| Independent | Tom King | 1.24 | 103 | |||||||
| Electorate: 12,390 Valid: 8,310 (67.07%) Spoilt: 130 Quota: 1,663 Turnout: 8,440 (68.12%) | ||||||||||
External links
| Preceded by 1999 Mayo County Council election |
Mayo County Council elections | Succeeded by 2009 Mayo County Council election |
This article is issued from Wikipedia. The text is licensed under Creative Commons - Attribution - Sharealike. Additional terms may apply for the media files.