2004 Wexford County Council election
An election to Wexford County Council took place on 11 June 2004 as part of that year's Irish local elections. 21 councillors were elected from four electoral divisions by PR-STV voting for a five-year term of office.
| |||||||||||||||||||||||||||||||||
All 21 seats to Wexford County Council | |||||||||||||||||||||||||||||||||
|---|---|---|---|---|---|---|---|---|---|---|---|---|---|---|---|---|---|---|---|---|---|---|---|---|---|---|---|---|---|---|---|---|---|
| |||||||||||||||||||||||||||||||||
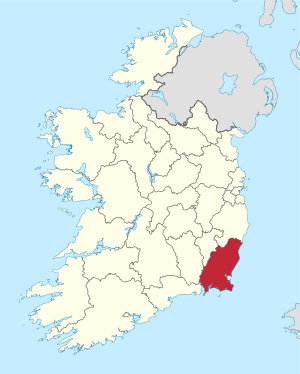 Map showing the area of Wexford County Council | |||||||||||||||||||||||||||||||||
| |||||||||||||||||||||||||||||||||
Results by party
| Party | Seats | ± | First Pref. votes | FPv% | ±% | |
|---|---|---|---|---|---|---|
| Fine Gael | 7 | -1 | 18,646 | 32.74% | ||
| Fianna Fáil | 6 | -3 | 17,419 | 30.59% | ||
| Sinn Féin | 3 | +3 | 5,103 | 8.96% | ||
| Labour Party | 1 | - | 5,012 | 8.80% | ||
| Independent | 4 | +1 | 8,830 | 15.50% | ||
| Totals | 21 | - | 56,952 | 100% | — | |
Results by Electoral Area
Enniscorthy
| Enniscorthy - 5 seats | ||||||||||||||||
|---|---|---|---|---|---|---|---|---|---|---|---|---|---|---|---|---|
| Party | Candidate | FPv% | Count 1 | Count 2 | Count 3 | Count 4 | Count 5 | Count 6 | Count 7 | Count 8 | Count 9 | Count 10 | Count 11 | Count 12 | ||
| Fianna Fáil | Peter Byrne* | 12.36 | 1,770 | 1,779 | 1,802 | 1,828 | 1,846 | 1,911 | 1,976 | 2,371 | 2,522 | |||||
| Fianna Fáil | Barbara Ann Murphy* | 11.44 | 1,639 | 1,644 | 1,654 | 1,660 | 1,760 | 1,797 | 1,832 | 2,010 | 2,058 | 2,130 | 2,158 | 2,179 | ||
| Fine Gael | Oliver Walsh* | 10.92 | 1,564 | 1,579 | 1,583 | 1,593 | 1,624 | 1,727 | 1,778 | 1,947 | 2,116 | 2,197 | 2,208 | 2,234 | ||
| Fine Gael | Trevor Masterson | 9.14 | 1,309 | 1,329 | 1,381 | 1,390 | 1,443 | 1,487 | 1,520 | 1,567 | 1,788 | 1,860 | 1,877 | 1,892 | ||
| Independent | Seán Doyle* | 8.98 | 1,286 | 1,324 | 1,365 | 1,397 | 1,431 | 1,510 | 1,657 | 1,722 | 1,880 | 2,500 | ||||
| Fine Gael | Kathleen Codd-Nolan | 8.60 | 1,232 | 1,252 | 1,288 | 1,294 | 1,332 | 1,374 | 1,398 | 1,438 | 1,751 | 1,845 | 1,879 | 1,929 | ||
| Fine Gael | Patrick Kavanagh* | 7.31 | 1,047 | 1,060 | 1,108 | 1,133 | 1,156 | 1,220 | 1,250 | 1,330 | ||||||
| Fianna Fáil | Willie Kavanagh | 6.90 | 988 | 998 | 1,001 | 1,004 | 1,013 | 1,157 | 1,196 | |||||||
| Sinn Féin | Noreen Sheridan | 5.07 | 727 | 750 | 755 | 780 | 805 | 823 | ||||||||
| Independent | Jackser Owens | 6.78 | 972 | 987 | 1,006 | 1,038 | 1,067 | 1,100 | 1,312 | 1,370 | 1,465 | |||||
| Progressive Democrats | Seán Quirke | 2.42 | 639 | 650 | 664 | 672 | 686 | |||||||||
| Labour Party | Winnie O'Leary | 2.42 | 346 | 372 | 377 | 466 | ||||||||||
| Fine Gael | Tara Manning | 1.93 | 277 | 287 | ||||||||||||
| Labour Party | Anne Robinson | 1.86 | 266 | 572 | 577 | 613 | ||||||||||
| Green Party | Michael Cuthbert | 1.84 | 264 | |||||||||||||
| Electorate: 24,684 Valid: 14,326 (58.04%) Spoilt: 322 Quota: 2,322 Turnout: 14,648 (59.34%) | ||||||||||||||||
Gorey
| Gorey - 4 seats | |||||||||||||
|---|---|---|---|---|---|---|---|---|---|---|---|---|---|
| Party | Candidate | FPv% | Count 1 | Count 2 | Count 3 | Count 4 | Count 5 | Count 6 | Count 7 | Count 8 | Count 9 | ||
| Fine Gael | Michael W. D'Arcy* | 15.58 | 1,952 | 1,984 | 2,091 | 2,201 | 2,459 | 2,571 | |||||
| Independent | Declan McPartlin | 13.63 | 1,707 | 1,762 | 1,807 | 1,896 | 1,992 | 2,150 | 2,162 | 2,617 | |||
| Fianna Fáil | Lorcan Allen* | 11.94 | 1,496 | 1,511 | 1,553 | 1,611 | 1,717 | 2,258 | 2,273 | 2,430 | 2,452 | ||
| Sinn Féin | Jimmy Fleming | 11.81 | 1,479 | 1,559 | 1,594 | 1,742 | 1,876 | 1,982 | 1,991 | 2,116 | 2,148 | ||
| Fine Gael | Peter Earle | 9.02 | 1,130 | 1,166 | 1,219 | 1,287 | 1,416 | 1,538 | 1,556 | 2,012 | 2,069 | ||
| Fine Gael | Michael Kinsella | 8.95 | 1,121 | 1,141 | 1,213 | 1,273 | 1,429 | 1,521 | 1,532 | ||||
| Fianna Fáil | Pat Rath | 8.82 | 1,105 | 1,130 | 1,149 | 1,190 | 1,274 | ||||||
| Fine Gael | Colin Webb | 6.69 | 838 | 867 | 1,038 | 1,153 | |||||||
| Labour Party | Bobby Ireton | 5.56 | 696 | 749 | 786 | ||||||||
| Fine Gael | Kay O'Gorman | 4.85 | 608 | 621 | |||||||||
| Independent | Eddie Colfer | 1.64 | 206 | ||||||||||
| Socialist Workers | John Carty | 1.51 | 189 | ||||||||||
| Electorate: 20,363 Valid: 12,527 (61.52%) Spoilt: 253 Quota: 2,506 Turnout: 12,780 (62.76%) | |||||||||||||
New Ross
| New Ross - 5 seats | ||||||||||||
|---|---|---|---|---|---|---|---|---|---|---|---|---|
| Party | Candidate | FPv% | Count 1 | Count 2 | Count 3 | Count 4 | Count 5 | Count 6 | Count 7 | Count 8 | ||
| Fianna Fáil | Sean Connick | 15.70 | 1,914 | 1,994 | 2,172 | |||||||
| Sinn Féin | John Dwyer | 11.22 | 1,368 | 1,406 | 1,548 | 1,575 | 1,601 | 1,678 | 1,960 | 1,986 | ||
| Fine Gael | Larry O'Brien* | 11.09 | 1,352 | 1,406 | 1,485 | 1,504 | 1,573 | 2,002 | 2,157 | |||
| Fianna Fáil | Jimmy Curtis* | 10.80 | 1,317 | 1,334 | 1,359 | 1,365 | 1,593 | 1,772 | 2,026 | 2,042 | ||
| Fine Gael | Denis Kennedy* | 10.48 | 1,278 | 1,308 | 1,389 | 1,403 | 1,415 | 1,589 | 1,690 | 1,722 | ||
| Fianna Fáil | Michael Sheehan* | 8.51 | 1,038 | 1,074 | 1,159 | 1,215 | 1,277 | 1,310 | ||||
| Fianna Fáil | Martin Murphy | 8.40 | 1,024 | 1,039 | 1,046 | 1,053 | 1,348 | 1,503 | 1,661 | 1,695 | ||
| Fine Gael | Patrick Whelan | 7.90 | 963 | 986 | 1,020 | 1,022 | 1,161 | |||||
| Fianna Fáil | Seamus Whelan* | 7.13 | 869 | 877 | 886 | 890 | ||||||
| Labour Party | Bobby Dunphy | 5.49 | 669 | 737 | ||||||||
| Independent | David Maher | 3.30 | 402 | |||||||||
| Electorate: 21,918 Valid: 12,194 (55.63%) Spoilt: 322 Quota: 2,033 Turnout: 12,516 (57.10%) | ||||||||||||
Wexford
| Wexford - 7 seats | ||||||||||||||||
|---|---|---|---|---|---|---|---|---|---|---|---|---|---|---|---|---|
| Party | Candidate | FPv% | Count 1 | Count 2 | Count 3 | Count 4 | Count 5 | Count 6 | Count 7 | Count 8 | Count 9 | Count 10 | Count 11 | Count 12 | ||
| Independent | Padge Reck* | 8.85 | 1,608 | 1,640 | 1,665 | 1,735 | 1,808 | 1,970 | 2,059 | 2,064 | 2,206 | 2,326 | ||||
| Labour Party | Ted Howlin* | 8.50 | 1,544 | 1,599 | 1,609 | 1,838 | 1,923 | 2,035 | 2,323 | |||||||
| Sinn Féin | Maurice Roche | 8.41 | 1,529 | 1,552 | 1,561 | 1,586 | 1,598 | 1,664 | 1,706 | 1,709 | 1,830 | 1,888 | 1,950 | 1,955 | ||
| Fine Gael | Pat Codd* | 8.04 | 1,462 | 1,475 | 1,494 | 1,498 | 1,601 | 1,607 | 1,638 | 1,642 | 1,678 | 1,841 | 2,151 | 2,166 | ||
| Fianna Fáil | Lisa McDonald | 7.66 | 1,392 | 1,418 | 1,537 | 1,567 | 1,630 | 1,688 | 1,805 | 1,809 | 1,918 | 2,204 | 2,343 | |||
| Independent | Leo Carthy* | 7.50 | 1,363 | 1,460 | 1,634 | 1,646 | 1,668 | 1,712 | 1,791 | 1,797 | 1,899 | 1,937 | 2,301 | |||
| Fianna Fáil | Gus Byrne* | 6.23 | 1,133 | 1,145 | 1,294 | 1,319 | 1,356 | 1,409 | 1,445 | 1,449 | 1,509 | 1,737 | 1,801 | 1,827 | ||
| Fine Gael | Jim Moore | 5.63 | 1,023 | 1,074 | 1,171 | 1,178 | 1,281 | 1,289 | 1,353 | 1,356 | 1,426 | 1,451 | ||||
| Fianna Fáil | Noel Keane | 5.47 | 995 | 997 | 1,039 | 1,045 | 1,072 | 1,083 | 1,091 | 1,092 | 1,105 | |||||
| Fine Gael | Anna Fenlon* | 5.35 | 972 | 1,008 | 1,025 | 1,127 | 1,290 | 1,424 | 1,480 | 1,490 | 1,648 | 1,692 | 1,920 | 1,945 | ||
| Green Party | Danny Forde | 4.68 | 850 | 876 | 890 | 949 | 973 | 1,035 | 1,077 | 1,088 | ||||||
| Fine Gael | Philomena Roche | 4.37 | 795 | 805 | 811 | 826 | ||||||||||
| Independent | Michael Furlong | 4.35 | 791 | 800 | 805 | 856 | 873 | |||||||||
| Labour Party | Gordon Rochford | 4.15 | 755 | 774 | 781 | 849 | 905 | 935 | ||||||||
| Labour Party | Davy Hynes | 4.05 | 736 | 745 | 751 | |||||||||||
| Fianna Fáil | Josephine Doyle* | 4.02 | 731 | 740 | ||||||||||||
| Independent | Angela Leahy | 2.72 | 495 | |||||||||||||
| Electorate: 34,708 Valid: 18,174 (52.36%) Spoilt: 425 Quota: 2,272 Turnout: 18,599 (53.59%) | ||||||||||||||||
External links
| Preceded by 1999 Wexford County Council election |
Wexford County Council elections | Succeeded by 2009 Wexford County Council election |
This article is issued from Wikipedia. The text is licensed under Creative Commons - Attribution - Sharealike. Additional terms may apply for the media files.